 🌊 Lakefront
182 E M-61 Hwy · Hay, MI
Flood risk 1/10 · Minimal
- FEMA flood zone
- X (unshaded)
- Chance of flooding over 30 yrs
- 0.0%
- Est. flood insurance / yr
- $473 – $860
Fire risk 3/10 · Minor
- Est. fire insurance / yr
- $784 – $1,456
Heat risk 2/10 · Minimal
- Hot days now (above 96°F)
- 7 days/yr
- Hot days in 30 yrs
- 14 days/yr
Wind risk 1/10 · Minimal
- Chance of severe wind over 30 yrs
- —
Air-quality risk 2/10 · Minimal
- Unhealthy air days now
- 0 days/yr
- Unhealthy air days in 30 yrs
- 1 days/yr
Risk factors via First Street. Map © Google.
Why this score? — see what drove the C+ grade
The composite is a weighted blend of 9 inputs, each scored 0–100. Each bar is that input's sub-score; the figure is the points it added to the 100-point composite (weight × sub-score).
- Cash flow +30.0/30.0
- 1% rule +10.0/10.0
- DSCR +10.0/10.0
- Schools +3.3/10.0
- Rent growth +2.5/5.0
- Livability +2.5/5.0
- Condition / age +2.5/5.0
- ARV discount +0.3/15.0
- Appreciation +0.0/10.0
$139,900
🖨 Deal sheet (PDF) 📄 Offer letter ✓ Due diligence
Listing remarks
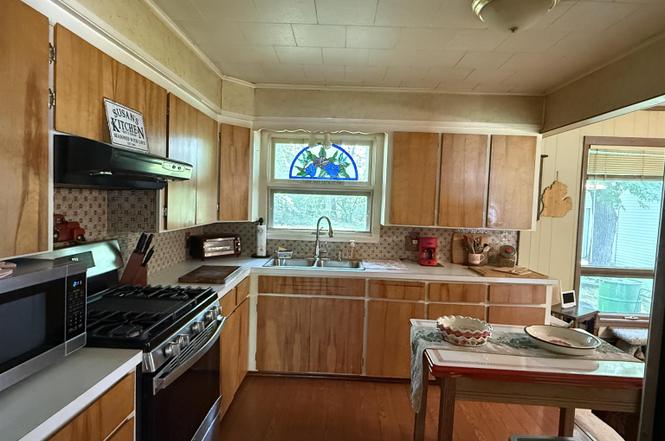
Comfortable 2 bedroom home with attached garage on 2 1/2 lots, just 10 minutes from Gladwin and conveniently located across from a convenience/grocery store and walking distance to a 3 restaurants, a gas station, and other shopping. Located just 2 minutes from hundreds of acres of DNR land adjoining 35000 DNR acres to the East, and just down from Smallwood Lake. The kitchen has Birch cabinets and the recently remodeled bath has ceramic tile flooring and Corian sink. Entry with slate flooring and double closets. Office area could be changed to a 3rd bedroom if needed.
Key facts
- Corian sink
- Attached garage
- Double closets
Tags
Property features AI
Finance
- Other: Located on M-61 Hwy in Valentines Shores Subdivision (Hay Twp), near Gladwin; Paved street access
Exterior
- Parking: Attached garage with space for 1 vehicle
- Utilities: Private well water; Septic system for sewer; Electric power; LP/Propane fuel for heating
- Home design: Residential, single-story home; Entry faces south (side of street: S)
- Construction: Vinyl siding exterior; Crawl-space foundation; Year built not specified
- Exterior features: Porch; Shed (outbuilding); Deep lot (150+ ft. frontage)
Interior
- Kitchen: Kitchen on main level (approx. 12 x 11); Appliances included: Range/Oven, Refrigerator
- Bedrooms: Main-level bedroom (16 x 11); Main-level bedroom (13 x 9)
- Flooring: Carpet in the living room
- Bathrooms: One full bathroom on the main level (approx. 12 x 6)
- Heating & cooling: Forced air electric heating; LP/Propane fuel available; Central air conditioning; Ceiling fan(s)
- Interior features: Gas fireplace in the living room
- Laundry & utility: Washer and Dryer included; Laundry room on main level (approx. 6 x 3)
Neighborhood map
What this means for you Summary
Snapshot
- This is a 2-bed/1.0-bath single-family listed at $140k.
Deal economics
- At list price, monthly cash flow is $832 ($10k/yr) — positive.
- The deal already cash-flows at list — no discount required.
- Meets the 1% rule at list price ($2k rent vs $140k).
Location & tenants
- Location reads: area grade C — affects rentability + tenant quality, not the cash-flow math above.
- Gladwin Community Schools (town): math 28% / reading 51% proficiency, ranked #232 of 540 in MI (top 43%) — families likely to look elsewhere, expect single-tenant / working-renter base with shorter leases.
- Zoned schools: Gladwin Elementary School (379 students, 67% FRL); Gladwin Junior High School (math 33% / reading 55%, grade D, #173 of 493 statewide, top 36%, 339 students, 59% FRL); Gladwin High School (math 17% / reading 47%, grade F, #405 of 713 statewide, top 59%, 495 students, 52% FRL).
- Market conditions: 289 active listings in the ZIP; 90 units permitted in Gladwin County in 2024 (0 in 5+ unit buildings).
Forward outlook
- Local home prices are declining (-3.0%/yr); year-one equity from $967 of loan paydown is wiped out by about $4k of value loss. Plan a longer hold.
- Gladwin County population projected at -25% by 2050 — secular population decline; favor cash flow + early exit over multi-decade hold.
- At projected returns (-3.0% appreciation + 3.0% rent growth), your $39k cash investment doubles in ~5 years — after that, you're playing with house money.
Negotiation context
- Only 13 days on market — expect competitive offers; lowballing is unlikely to land.
- 3 sale attempts since 23y ago with the ask held roughly flat each time — persistent listings suggest the price (not the market) is what's stuck; bring a comps-based counter.
- Current owner paid $70k; list at $140k implies a 100% gain — meaningful room to come down on a strong offer.
Questions for the listing agent
- Is there a deadline driving the sale (1031 exchange, divorce, estate, relocation)? That informs how much negotiation room exists.
- This sits on a lake — are riparian / water-frontage rights deeded with the parcel? Any dock permits, shoreline easements, or HOA water-use restrictions?
- What's the documented flood / surge / shoreline-erosion history here (FEMA AND non-FEMA — e.g., storm surge, creek backup, septic-field saturation)?
- Any water-quality or seasonal algae-bloom issues that affect tenant satisfaction or short-term-rental demand?
- What's the average days-on-market for RENTAL listings here right now (not sales)? A rising rental-DOM trend means longer vacancies and softer asking-rent achievability than the comps imply.
- What's the recent tenant-quality profile in this submarket — average credit score on applications, eviction rate, late-payment / NSF rate, and stable-employment percentage? A property-management company in the area should have these aggregated.
- How much new for-sale + rental construction is in the pipeline within 1–3 miles? Heavy new supply typically softens prices + rents 12–24 months out; constrained supply supports both.
Investment metrics
- 1% rule
- 1.50% ✓
- Cap rate
- 13.43%
- Cash-on-cash
- 25.49%
- DSCR
- 2.13
- GRM
- 5.6
CMA / ARV
- ARV (on-the-fly)
- $120,658
- Comps found
- 5
Show comp detail 5 sales within ~0.75 mi
| Address | Dist | Beds/Ba | Sqft | Sold | Price | $/sf | Match |
|---|---|---|---|---|---|---|---|
| 300 Sycamore St | 0.36mi | 2/1.0 | 1,120 (+5%) | 21mo | $80,000 | $71 | 57 |
| 265 Pine St | 0.27mi | 2/1.0 | 1,191 (+12%) | 23mo | $38,400 | $32 | 49 |
| 542 Silver St | 0.75mi | 3/2.0 (+1) | 1,100 (+3%) | 5mo | $92,000 | $84 | 46 |
| 264 & 274 Flynn Dr | 0.56mi | 3/1.5 (+1) | 1,040 (-2%) | 21mo | $167,000 | $161 | 46 |
| 555 Lakeview Dr | 0.72mi | 3/2.0 (+1) | 990 (-7%) | 21mo | $194,500 | $196 | 28 |
Match score weights: distance 35% · size 25% · config 20% · recency 20%. Top-matched comps best support the ARV.
Projected returns pro-forma
-3.0% appreciation · 3.0% rent growth · sell at horizon
- IRR
- 19.0%
- Equity multiple
- 1.77×
- Total profit
- $30,266
- Equity at exit
- $20,860
- IRR
- 27.4%
- Equity multiple
- 3.41×
- Total profit
- $94,364
- Equity at exit
- $12,096
Cash invested: $39,172 (down + closing). Projections, not guarantees.
Landlord ↔ Tenant lean methodology
- Overall (STATE)
- 62 Landlord-Friendly
- State Michigan
- 62 Landlord-Friendly · EVEN
- County
- — inherits STATE
- City
- — inherits STATE
ZIP-level market 48624
- Home prices YoY
- -23.4%
- Active inventory
- 289
- Price-to-rent
- 5.6×
Monthly cashflow live
- Estimated rent
- $2,097 medium interval (Pro) →
- Mortgage (P&I)
- −$734
- Tax from tax record
- −$33 /mo · $396/yr
- Insurance
- −$58
- HOA
- −$0
- Vacancy / Maint / Mgmt
- −$440
- Net cashflow
- $832
Break-even live
Sensitivity live
| Price | -10% $911 | -5% $872 | +0% $832 | +5% $792 | +10% $753 |
|---|---|---|---|---|---|
| Rent | -10% $666 | -5% $749 | +0% $832 | +5% $915 | +10% $998 |
| Rate | -1.0pp $902 | -0.5pp $868 | base $832 | +0.5pp $796 | +1.0pp $759 |
UW: 25.0% down · 7.5% · 30yr · 1.5% tax · 5.0% vac · 8.0% maint · 8.0% mgmt
Financing live
Cash to close
- Down payment
- $34,975
- Closing costs
- $4,197
- Reserves months
- —
- Total cash needed
- —
Loan-product check · same deal, 3 products live
Conventional
25% down · 7.5% · 30yr
- Down + closing
- —
- Monthly P&I
- —
- Monthly cashflow
- —
- DSCR
- —
- Eligible?
- —
Personal DTI + credit; lowest rate.
DSCR
20% down · 8.5% · 30yr
- Down + closing
- —
- Monthly P&I
- —
- Monthly cashflow
- —
- DSCR
- —
- Eligible?
- —
No personal income docs; deal must DSCR.
Hard money
10% down · 12.0% · 12mo
- Down + closing
- —
- Monthly P&I
- —
- Monthly cashflow
- —
- DSCR
- —
- Eligible?
- —
Short-term bridge; refi at stabilization.
Listing history 10 events
-
2026-06-21days on market $139,900 Active 13 DOM
-
2026-06-21days on market $139,900 Active 12 DOM
-
2026-06-18days on market $139,900 Active 10 DOM
-
2026-06-17days on market $139,900 Active 9 DOM
-
2026-06-16days on market $139,900 Active 8 DOM
-
2026-06-15days on market $139,900 Active 7 DOM
-
2026-06-13days on market $139,900 Active 5 DOM
-
2026-06-12days on market $139,900 Active 4 DOM
-
2026-06-09remarks 574-char remark
-
2026-06-09$139,900 Active 1 DOM
ⓘ Source: listings_history table (triggers on properties + properties_extension) + one-shot
backfill from property_details.listing_events for pre-trigger history.
Tax reassessment forecast MI · Partial reset (capped growth)
- Current annual tax
- $396 · $33/mo
- Projected year-2 tax
- $1,275 · $106/mo
- Expected delta
- +$879/yr (+$73/mo · 221.9%)
ⓘ Screening estimate from a state-policy table — verify with the county assessor before closing.
Climate risk First Street
- Flood 1/10 Low FEMA zone X (unshaded) · 0% chance over 30 yrs
- Wildfire 3/10 Moderate
- Heat 2/10 Low 7 d/yr ≥96°F today · 14 d/yr by 30 yrs out
- Wind 1/10 Low
- Air quality 2/10 Low 0 unhealthy d/yr today · 1 by 30 yrs out
Nearby sold comps map
Loading sold comps map…
Walkable amenities ~0.75 mi
Loading nearby amenities…
Taxation est. · year 1
- Rental income
- $25,169
- − Mortgage interest
- −$7,837
- − Property taxes
- −$396
- − Insurance
- −$700
- − Repairs & maintenance
- −$2,014
- − Management
- −$2,014
- − Depreciation
- −$4,070
- Taxable income
- $8,140
- Est. tax owed @ 24.0%
- −$1,954
- After-tax cash flow
- $8,031/yr
For passive investors: Depreciation is non-cash, so a rental often shows a tax loss while cash-flowing — sheltering income. Rental losses are passive: they offset passive income freely, and up to $25,000/yr can offset ordinary (W-2) income if you actively participate and your MAGI is under $100k (phasing out to $0 by $150k); unused losses carry forward. On sale, claimed depreciation is recaptured at up to 25%, and gains may owe capital-gains tax (a 1031 exchange can defer both). Figures are a year-1 estimate at your 24.0% rate — not tax advice; consult a CPA.
Schools (NCES district)
- District
- Gladwin Community Schools
- NCES district ID
- 2615990
- Math proficiency
- 28% ▼ -13.00%
- Reading proficiency
- 51% ▼ -2.00%
- Median HH income
- $38,917
- Composite
- 32.93/100
- National rank
- #5595
- State rank
- #232 of 540 in MI
Livability — Hay
No livability data for this city. (Only ~50 U.S. cities are tracked.)
Census & demographics
- Population (ZIP)
- 16,269
Population outlook (Gladwin County) Hauer SSP2
- Today (2025)
- 23,440 people
- By 2030
- 22,281 · -4.9%
- By 2040
- 19,867 · -15.2%
- By 2050
- 17,667 · -24.6%
- By 2075
- 12,909 · -44.9%
- By 2100
- 8,629 · -63.2%
Race, ethnicity, and origin ACS 2023
- Neighborhood character
- Predominantly White (94%)
- Race & ethnicity
- White 94% Two or more races 4% Hispanic / Latino 2%
- Common ancestry
- Romanian 8% Lithuanian 3% Iranian 3%
- Foreign-born
- 1%
- Languages at home
- 95% English-only · German/W. Germanic 4% Spanish 1%
Political lean MEDSL · Gladwin
- 2024 margin
- Solid R (+40.7) · D 29.1% · R 69.8% · Other 1.1%
- 2008→2024 swing
- -42.2pp toward R · 2008: 1.5pp · 2024: -40.7pp
- All cycles
- 2024: R+40.7 2020: R+36.8 2016: R+34.7 2012: R+7.2 2008: D+1.5
Not yet ingested
- Civics
- —
Market trends
- HPI YoY
- ▼ -72.67%
- Current HPI
- 238.0744
- Rent YoY
- —
- Metro
- —
- State GDP YoY
- ▲ 1.37%
- F500 in state
- 28
Industry mix (Fortune 500 HQ in MI)
| Industry | F500 HQs | Revenue |
|---|---|---|
| Automotive Parts | 3 | $48B |
|
||
| Automotive | 2 | $372B |
|
||
| Chemicals | 1 | $45B |
|
||
| Automotive Retail | 1 | $29B |
|
||
| Healthcare / Medical Devices | 1 | $23B |
|
||
| Automotive Technology | 1 | $20B |
|
||
Price history
+125.6% since first listed4 events — show timeline
- 2026-06-05 Listed $139,900 MiRealSource-MiMLS
- 2018-08-03 Sold (Public Records) $69,900 Public Records
- 2017-07-15 Listed $69,900 MiRealSource-MiMLS
- 2003-06-25 Listed $62,000 MiRealSource-MiMLS
Property tax history
-5.3%/yrLatest (2025): $396 · -66.9% YoY. Source: county tax records.
Cash-flow waterfall
monthlySold comps — $/sqft
last 12 mo · ≤1 miLoading sold comps…