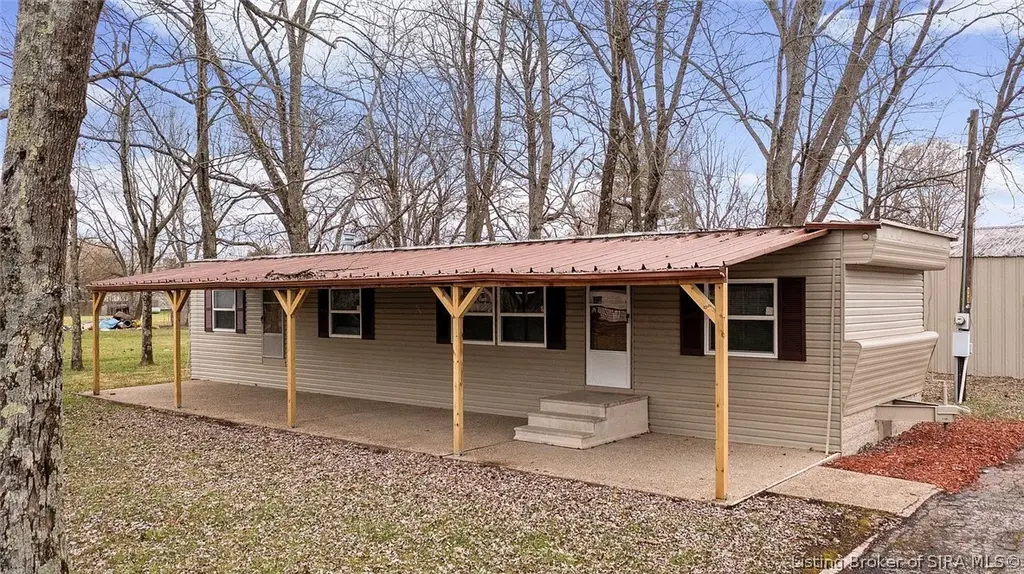
19515 Lakeview Dr · New Washington, IN
Flood risk 1/10 · Minimal
- FEMA flood zone
- X (unshaded)
- Chance of flooding over 30 yrs
- 0.0%
- Est. flood insurance / yr
- $507 – $1,088
Fire risk 1/10 · Minimal
- Est. fire insurance / yr
- $717 – $1,331
Heat risk 4/10 · Minor
- Hot days now (above 105°F)
- 7 days/yr
- Hot days in 30 yrs
- 19 days/yr
Wind risk 2/10 · Minimal
- Chance of severe wind over 30 yrs
- 2.0%
Air-quality risk 2/10 · Minimal
- Unhealthy air days now
- 1 days/yr
- Unhealthy air days in 30 yrs
- 2 days/yr
Risk factors via First Street. Map © Google.
Why this score? — see what drove the C- grade
The composite is a weighted blend of 9 inputs, each scored 0–100. Each bar is that input's sub-score; the figure is the points it added to the 100-point composite (weight × sub-score).
- Cash flow +23.0/30.0
- ARV discount +7.5/15.0
- DSCR +7.4/10.0
- 1% rule +5.0/10.0
- Livability +3.2/5.0
- Schools +2.7/10.0
- Rent growth +2.5/5.0
- Condition / age +2.5/5.0
- Appreciation +0.0/10.0
$119,999
🖨 Deal sheet (PDF) 📄 Offer letter ✓ Due diligence
Listing remarks
Great Cash flow cow investment or move in ready! 1% rule! Great renter that has been with us for a while. 2 Bed 1 bath. located in quiet and peaceful Hibernia. Large detached 2 car garage. Currently rented month to month.
Key facts
- 0.5 acre lot
- 2 garage spots
- Built 1964
Property features AI
Finance
- Financial info: Annual tax reported
Exterior
- Parking: Detached 2-car garage
- Utilities: Public water connected
- Home design: Single-wide mobile home; Single-story
- Construction: 624 sq. ft. above-grade living area
- Exterior features: Half-acre lot; Lot size source: Assessor
Interior
- Bathrooms: 1 full bathroom
- Interior features: Central air conditioning; Forced air heating
Neighborhood map
What this means for you Summary
Snapshot
- This is a 2-bed/1.0-bath manufactured listed at $120k.
Deal economics
- At list price, monthly cash flow is $213 ($3k/yr) — positive.
- The deal already cash-flows at list — no discount required.
- To meet the 1% rule (rent ≥ 1% of price), the offer needs to be $120k (0.1% below list).
- Recommended offer: $116k (3.0% below list) — sets the bar for market timing.
Location & tenants
- Location reads 63/100 on livability (#420 in IN) — a middle-class / working-renter tenant base. Strengths: cost of living A+; Watch: employment D+, amenities F, commute F.
- Greater Clark County Schools (suburban): math 26% / reading 37% proficiency, ranked #224 of 301 in IN (top 74%) — families likely to look elsewhere, expect single-tenant / working-renter base with shorter leases.
- Zoned schools: New Washington Elementary School (math 42% / reading 42%, grade F, #434 of 994 statewide, top 48%, 319 students, 53% FRL).
- Market conditions: 264 active listings in the ZIP; solid renter incomes; 911 units permitted in Clark County in 2024 (133 in 5+ unit buildings).
- This rent is only 15% of the median local income ($95k/yr) — well below the 30% rent-burden line; pricing power to push rent on renewal without tenant pushback.
Forward outlook
- Local home prices are declining (-3.0%/yr); year-one equity from $829 of loan paydown is wiped out by about $4k of value loss. Plan a longer hold.
- Clark County population projected at +17% by 2050 — long-run rental-demand tailwind backs the buy-and-hold thesis.
Negotiation context
- It's been on market 60 days — a 3% lower offer ($116k) is reasonable based on typical stale-listing flexibility.
Questions for the listing agent
- It's been on market 60 days. Have you received any prior offers? Is the seller open to a 3% concession, seller financing, or rate buy-down credit?
- Built in 1964 — when were the roof, HVAC, electrical panel, plumbing, and water heater last replaced?
- Is there a deadline driving the sale (1031 exchange, divorce, estate, relocation)? That informs how much negotiation room exists.
- Schools are B-rated — typically a magnet for longer-tenancy family renters. What's the average tenant stay here, and is there a school-zone premium baked into asking?
- What's the average days-on-market for RENTAL listings here right now (not sales)? A rising rental-DOM trend means longer vacancies and softer asking-rent achievability than the comps imply.
- What's the recent tenant-quality profile in this submarket — average credit score on applications, eviction rate, late-payment / NSF rate, and stable-employment percentage? A property-management company in the area should have these aggregated.
- How much new for-sale + rental construction is in the pipeline within 1–3 miles? Heavy new supply typically softens prices + rents 12–24 months out; constrained supply supports both.
Investment metrics
- 1% rule
- 1.00% ✗
- Cap rate
- 8.43%
- Cash-on-cash
- 7.62%
- DSCR
- 1.34
- GRM
- 8.3
CMA / ARV
No comps found within radius.
Projected returns pro-forma
-3.0% appreciation · 3.0% rent growth · sell at horizon
- IRR
- -4.7%
- Equity multiple
- 0.82×
- Total profit
- $-5,894
- Equity at exit
- $17,892
- IRR
- 4.9%
- Equity multiple
- 1.36×
- Total profit
- $12,205
- Equity at exit
- $10,375
Cash invested: $33,600 (down + closing). Projections, not guarantees.
Landlord ↔ Tenant lean methodology
- Overall (STATE)
- 90 Strongly Landlord-Friendly
- State Indiana
- 90 Strongly Landlord-Friendly · R+11
- County
- — inherits STATE
- City
- — inherits STATE
ZIP-level market 47111
- Active inventory
- 264
- Price-to-rent
- 8.3×
Monthly cashflow live
- Estimated rent
- $1,199 medium interval (Pro) →
- Mortgage (P&I)
- −$629
- Tax from tax record
- −$55 /mo · $658/yr
- Insurance
- −$50
- HOA
- −$0
- Vacancy / Maint / Mgmt
- −$252
- Net cashflow
- $213
Break-even live
Sensitivity live
| Price | -10% $281 | -5% $247 | +0% $213 | +5% $179 | +10% $145 |
|---|---|---|---|---|---|
| Rent | -10% $119 | -5% $166 | +0% $213 | +5% $261 | +10% $308 |
| Rate | -1.0pp $274 | -0.5pp $244 | base $213 | +0.5pp $182 | +1.0pp $151 |
UW: 25.0% down · 7.5% · 30yr · 1.5% tax · 5.0% vac · 8.0% maint · 8.0% mgmt
Financing live
Cash to close
- Down payment
- $30,000
- Closing costs
- $3,600
- Reserves months
- —
- Total cash needed
- —
Loan-product check · same deal, 3 products live
Conventional
25% down · 7.5% · 30yr
- Down + closing
- —
- Monthly P&I
- —
- Monthly cashflow
- —
- DSCR
- —
- Eligible?
- —
Personal DTI + credit; lowest rate.
DSCR
20% down · 8.5% · 30yr
- Down + closing
- —
- Monthly P&I
- —
- Monthly cashflow
- —
- DSCR
- —
- Eligible?
- —
No personal income docs; deal must DSCR.
Hard money
10% down · 12.0% · 12mo
- Down + closing
- —
- Monthly P&I
- —
- Monthly cashflow
- —
- DSCR
- —
- Eligible?
- —
Short-term bridge; refi at stabilization.
Listing history 16 events
-
2026-06-21days on market $119,999 Active 60 DOM
-
2026-06-18days on market $119,999 Active 57 DOM
-
2026-06-17days on market $119,999 Active 56 DOM
-
2026-06-16days on market $119,999 Active 55 DOM
-
2026-06-15days on market $119,999 Active 54 DOM
-
2026-06-13days on market $119,999 Active 52 DOM
-
2026-06-13days on market $119,999 Active 51 DOM
-
2026-06-10days on market $119,999 Active 49 DOM
-
2026-06-09days on market $119,999 Active 48 DOM
-
2026-06-08days on market $119,999 Active 47 DOM
-
2026-06-07days on market $119,999 Active 46 DOM
-
2026-06-03days on market $119,999 Active 42 DOM
-
2026-06-02days on market $119,999 Active 41 DOM
-
2026-06-01days on market $119,999 Active 40 DOM
-
2026-05-31days on market $119,999 Active 39 DOM
-
2026-04-22$119,999 Active 221-char remark
ⓘ Source: listings_history table (triggers on properties + properties_extension) + one-shot
backfill from property_details.listing_events for pre-trigger history.
Tax reassessment forecast IN · Partial reset (capped growth)
- Current annual tax
- $658 · $55/mo
- Projected year-2 tax
- $839 · $70/mo
- Expected delta
- +$181/yr (+$15/mo · 27.5%)
ⓘ Screening estimate from a state-policy table — verify with the county assessor before closing.
Climate risk First Street
- Flood 1/10 Low FEMA zone X (unshaded) · 0% chance over 30 yrs
- Wildfire 1/10 Low
- Heat 4/10 Moderate 7 d/yr ≥105°F today · 19 d/yr by 30 yrs out
- Wind 2/10 Low 2% chance of damaging wind over 30 yrs
- Air quality 2/10 Low 1 unhealthy d/yr today · 2 by 30 yrs out
Nearby sold comps map
Loading sold comps map…
Walkable amenities ~0.75 mi
Loading nearby amenities…
Taxation est. · year 1
- Rental income
- $14,392
- − Mortgage interest
- −$6,722
- − Property taxes
- −$658
- − Insurance
- −$600
- − Repairs & maintenance
- −$1,151
- − Management
- −$1,151
- − Depreciation
- −$3,491
- Taxable income
- $619
- Est. tax owed @ 24.0%
- −$149
- After-tax cash flow
- $2,412/yr
For passive investors: Depreciation is non-cash, so a rental often shows a tax loss while cash-flowing — sheltering income. Rental losses are passive: they offset passive income freely, and up to $25,000/yr can offset ordinary (W-2) income if you actively participate and your MAGI is under $100k (phasing out to $0 by $150k); unused losses carry forward. On sale, claimed depreciation is recaptured at up to 25%, and gains may owe capital-gains tax (a 1031 exchange can defer both). Figures are a year-1 estimate at your 24.0% rate — not tax advice; consult a CPA.
Schools (NCES district)
- District
- Greater Clark County Schools
- NCES district ID
- 1803940
- Math proficiency
- 26% ▼ -15.00%
- Reading proficiency
- 37% ▼ -13.00%
- Median HH income
- $47,838
- Composite
- 27.2/100
- National rank
- #7020
- State rank
- #224 of 301 in IN
Livability — New Washington
- Score
- 63/100
- State rank
- #420
- US rank
- #15195
Category grades
Schools grade is shown separately in the Schools card above.
Census & demographics
- County
- Clark County · 108,879 people
- Metro
- Louisville/Jefferson County, KY-IN
- Population (ZIP)
- 17,738
- Household income
- $95,376
- Rent vs Own
- Severe rent burden
- 151.0
Population outlook (Clark County) Hauer SSP2
- Today (2025)
- 126,401 people
- By 2030
- 131,455 · +4.0%
- By 2040
- 140,471 · +11.1%
- By 2050
- 147,677 · +16.8%
- By 2075
- 161,702 · +27.9%
- By 2100
- 164,078 · +29.8%
Race, ethnicity, and origin ACS 2023
- Neighborhood character
- Predominantly White (87%)
- Race & ethnicity
- White 87% Two or more races 5% Hispanic / Latino 4% Black 3%
- Common ancestry
- Italian 2% Lithuanian 2% Romanian 2%
- Foreign-born
- 3% · Canada, China
- Languages at home
- 95% English-only · Spanish 3% Chinese 1%
Political lean MEDSL · Clark
- 2024 margin
- Strong R (+20.4) · D 38.9% · R 59.3% · Other 1.8%
- 2008→2024 swing
- -13.3pp toward R · 2008: -7.1pp · 2024: -20.4pp
- All cycles
- 2024: R+20.4 2020: R+18.3 2016: R+22.0 2012: R+9.9 2008: R+7.1
Not yet ingested
- Civics
- —
Market trends
- HPI YoY
- ▼ -126.16%
- Current HPI
- 198.7046
- Rent YoY
- —
- Metro
- Louisville/Jefferson County, KY-IN
- State GDP YoY
- ▲ 2.90%
- F500 in state
- 18
Industry mix (Fortune 500 HQ in IN)
| Industry | F500 HQs | Revenue |
|---|---|---|
| Industrial Machinery | 2 | $37B |
|
||
| Healthcare | 1 | $177B |
|
||
| Pharmaceuticals | 1 | $45B |
|
||
| Metals / Steel | 1 | $18B |
|
||
| Agriculture | 1 | $17B |
|
||
| Packaging | 1 | $12B |
|
||
Price history
1 event — show timeline
- 2026-04-22 Listed $119,999 SIRA
Property tax history
+2.4%/yrLatest (2024): $658 · +9.5% YoY. Source: county tax records.
Cash-flow waterfall
monthlySold comps — $/sqft
last 12 mo · ≤1 miLoading sold comps…