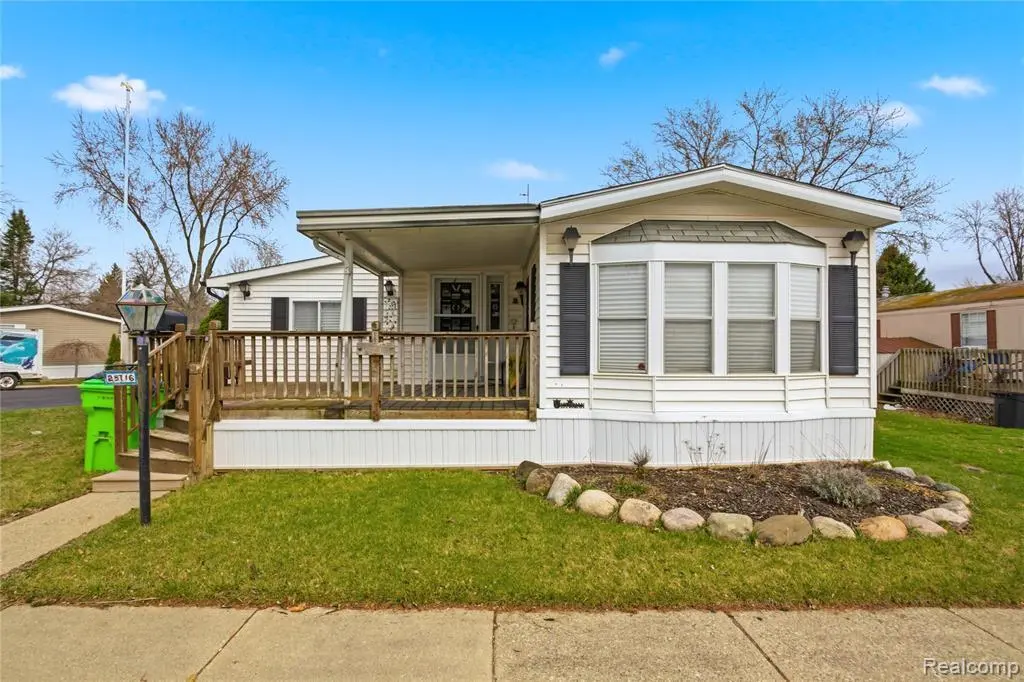
25716 Jackson St St · Novi, MI
Flood risk 1/10 · Minimal
- FEMA flood zone
- X
- Chance of flooding over 30 yrs
- 0.0%
- Est. flood insurance / yr
- $508 – $851
Fire risk 1/10 · Minimal
- Est. fire insurance / yr
- $784 – $1,456
Heat risk 3/10 · Minor
- Hot days now (above threshold)
- 7 days/yr
- Hot days in 30 yrs
- 15 days/yr
Wind risk No data
- Chance of severe wind over 30 yrs
- —
Air-quality risk 3/10 · Minor
- Unhealthy air days now
- 2 days/yr
- Unhealthy air days in 30 yrs
- 4 days/yr
Risk factors via First Street. Map © Google.
Why this score? — see what drove the B- grade
The composite is a weighted blend of 9 inputs, each scored 0–100. Each bar is that input's sub-score; the figure is the points it added to the 100-point composite (weight × sub-score).
- Cash flow +26.0/30.0
- 1% rule +10.0/10.0
- DSCR +8.7/10.0
- ARV discount +7.5/15.0
- Schools +6.5/10.0
- Livability +4.3/5.0
- Condition / age +3.8/5.0
- Rent growth +2.9/5.0
- Appreciation +0.0/10.0
$64,900
🖨 Deal sheet 📄 Offer letter ✓ Due diligence
Listing remarks MLS
Move-in ready manufactured home located in the highly desirable city of Novi! Situated on a premium corner lot, this home offers added privacy and curb appeal. Enjoy comfortable, low-maintenance living in a vibrant community featuring great amenities, including a pool, recreation center, and tennis courts. A fantastic opportunity to own in a well-maintained neighborhood with convenient access to shopping, dining, and major roadways.
Key facts
- Premium corner lot
- Great amenities
- Tennis courts
Tags
Neighborhood map
What this means for you Summary
Snapshot
- This is a 2-bed/1.5-bath single-family listed at $65k. Condition is rated good.
Deal economics
- At list price, monthly cash flow is $161 ($2k/yr) — positive.
- The deal already cash-flows at list — no discount required.
- Meets the 1% rule at list price ($2k rent vs $65k).
- Recommended offer: $61k (6.0% below list) — sets the bar for market timing.
- Cap rate 9.3% vs local median 2.8% in Novi — top-decile yield for the area; either an underpriced asset or a hidden risk that comps aren't pricing in. Stress-test before assuming the spread holds.
Location & tenants
- Location reads 86/100 on livability (#20 in MI, #377 nationally) — a professional / high-income tenant draw. Strengths: schools A+, crime A+, employment A+; Watch: commute F.
- Novi Community School District (urban): math 73% / reading 72% proficiency, ranked #7 of 540 in MI (top 1%) — strong family-tenant draw, lease renewals of 3-5y typical; only 7% free/reduced lunch — higher-income household profile.
- Market conditions: Rents rising (+1.7%/yr); 134 active listings in the ZIP; 12 comparable units currently listed for rent nearby; rentals at typical pace (median 18d on market — plan ~3-4 weeks tenant-placement turnaround); high-income renter base; 2,614 units permitted in Oakland County in 2024 (721 in 5+ unit buildings).
Forward outlook
- Local home prices are declining (-3.0%/yr); year-one equity from $449 of loan paydown is wiped out by about $2k of value loss. Plan a longer hold.
- Oakland County population projected at +10% by 2050 — modest demand growth; plan on rents tracking national, not racing it.
Negotiation context
- It's been on market 66 days — a 6% lower offer ($61k) is reasonable based on typical stale-listing flexibility.
- 2 sale attempts with the ask held roughly flat each time — persistent listings suggest the price (not the market) is what's stuck; bring a comps-based counter.
Risks & watch-outs
- Watch-outs: HOA is 47% of rent.
Questions for the listing agent
- It's been on market 66 days. Have you received any prior offers? Is the seller open to a 6% concession, seller financing, or rate buy-down credit?
- What does the HOA fee cover, when was the last increase, and are there any pending special assessments or reserve-fund shortfalls?
- Why hasn't it sold? Are there any deal-killer items the seller is aware of (foundation, flood, title, zoning, code violations)?
- Is there a deadline driving the sale (1031 exchange, divorce, estate, relocation)? That informs how much negotiation room exists.
- Schools are A-rated — typically a magnet for longer-tenancy family renters. What's the average tenant stay here, and is there a school-zone premium baked into asking?
- What's the average days-on-market for RENTAL listings here right now (not sales)? A rising rental-DOM trend means longer vacancies and softer asking-rent achievability than the comps imply.
- What's the recent tenant-quality profile in this submarket — average credit score on applications, eviction rate, late-payment / NSF rate, and stable-employment percentage? A property-management company in the area should have these aggregated.
- How much new for-sale + rental construction is in the pipeline within 1–3 miles? Heavy new supply typically softens prices + rents 12–24 months out; constrained supply supports both.
Investment metrics
- 1% rule
- 2.96% ✓
- Cap rate
- 9.28%
- Cash-on-cash
- 10.66%
- DSCR
- 1.47
- GRM
- 2.8
CMA / ARV
- ARV (median comp)
- $341,509
- List price
- $64,900
- Delta
- -81.00%
- Verdict
- UNDERPRICED
- Comps
- 13 within 1.0 mi
Show comp detail 4 sales within ~0.75 mi
| Address | Dist | Beds/Ba | Sqft | Sold | Price | $/sf | Match |
|---|---|---|---|---|---|---|---|
| 25654 Madison St | 0.09mi | 2/2.0 | 1,200 (-13%) | 10mo | $30,000 | $25 | 63 |
| 25712 Seeley Rd | 0.17mi | 3/1.0 (+1) | 1,460 (+6%) | 20mo | $270,000 | $185 | 59 |
| 24826 Joseph Dr | 0.59mi | 3/1.0 (+1) | 1,408 (+2%) | 10mo | $345,000 | $245 | 54 |
| 26852 Roric St | 0.59mi | 3/2.0 (+1) | 1,248 (-10%) | 10mo | $39,900 | $32 | 41 |
Match score weights: distance 35% · size 25% · config 20% · recency 20%. Top-matched comps best support the ARV.
Projected returns pro-forma
-3.0% appreciation · 1.68% rent growth · sell at horizon
- IRR
- -3.3%
- Equity multiple
- 0.88×
- Total profit
- $-2,166
- Equity at exit
- $9,677
- IRR
- 3.2%
- Equity multiple
- 1.20×
- Total profit
- $3,670
- Equity at exit
- $5,611
Cash invested: $18,172 (down + closing). Projections, not guarantees.
Landlord ↔ Tenant lean methodology
- Overall (STATE)
- 62 Landlord-Friendly
- State Michigan
- 62 Landlord-Friendly · EVEN
- County
- — inherits STATE
- City
- — inherits STATE
ZIP-level market 48375
- Rents YoY
- 1.7%
- Active inventory
- 134
- Price-to-rent
- 2.8×
Monthly cashflow live
- Estimated rent
- $1,923 high interval (Pro) →
- Mortgage (P&I)
- −$340
- Tax est. 1.5%
- −$81 /mo · $974/yr
- Insurance
- −$27
- HOA
- −$909
- Vacancy / Maint / Mgmt
- −$404
- Net cashflow
- $161
Break-even live
UW: 25.0% down · 7.5% · 30yr · 1.5% tax · 5.0% vac · 8.0% maint · 8.0% mgmt
Financing live
Cash to close
- Down payment
- $16,225
- Closing costs
- $1,947
- Reserves months
- —
- Total cash needed
- —
Loan-product check · same deal, 3 products live
Conventional
25% down · 7.5% · 30yr
- Down + closing
- —
- Monthly P&I
- —
- Monthly cashflow
- —
- DSCR
- —
- Eligible?
- —
Personal DTI + credit; lowest rate.
DSCR
20% down · 8.5% · 30yr
- Down + closing
- —
- Monthly P&I
- —
- Monthly cashflow
- —
- DSCR
- —
- Eligible?
- —
No personal income docs; deal must DSCR.
Hard money
10% down · 12.0% · 12mo
- Down + closing
- —
- Monthly P&I
- —
- Monthly cashflow
- —
- DSCR
- —
- Eligible?
- —
Short-term bridge; refi at stabilization.
Rent comps 12 comps
| Address | Beds | Baths | Sqft | Rent | $/sqft | DOM | Units | Dist |
|---|---|---|---|---|---|---|---|---|
| 24701 Bashian Dr #8 Novi, MI | 2.0 | 2.5 | 1250 | $1,800 | $1.44 | 43d | 1 | 0.69mi |
| 24651 Olde Orchard St Novi, MI | 2.0 | 2.5 | 1096 | $1,795 | $1.64 | 5d | 1 | 0.70mi |
| 25528 Portico Ln Unit 161 Novi, MI | 2.0 | 2.0 | 1240 | $1,800 | $1.45 | 43d | 1 | 0.89mi |
| 25588 Portico Ln Novi, MI | 3.0 | 2.5 | 1838 | $2,700 | $1.47 | 43d | 1 | 0.90mi |
| 41670 Tera Ln Novi, MI | 3.0 | 2.0 | 1794 | $1,700 | $0.95 | 44d | 1 | 0.94mi |
| 37850 Spring Ln Farmington Hills, MI | 1.0–2.0 | 1.0–2.0 | 927 | $1,916 | $2.07 | 1d | 12 | 1.14mi |
| 23737 Stonehenge Blvd Novi, MI | 2.0 | 1.0 | 936 | $1,900 | $2.03 | 17d | 1 | 1.14mi |
| 26375 Halsted Rd Farmington Hills, MI | 2.0–3.0 | 2.5 | 1565 | $2,144 | $1.37 | 1d | 4 | 1.15mi |
| 37863 Wendy Lee St Farmington Hills, MI | 3.0 | 2.0 | 1235 | $2,450 | $1.98 | 24d | 1 | 1.18mi |
| 42101 Fountain Park Dr N Novi, MI | 1.0–2.0 | 1.0–2.0 | 985 | $1,824 | $1.85 | 1d | 20 | 1.18mi |
| 23672 N Rockledge Novi, MI | 2.0 | 1.0 | 970 | $1,695 | $1.75 | 12d | 1 | 1.22mi |
| 25300 Constitution Novi, MI | 1.0–4.0 | 1.0–2.5 | 1241 | $2,473 | $1.99 | 1d | 15 | 1.37mi |
HOA detail
- Monthly dues
- $909 · $10,908/yr
- Likely covers
- pool
Listing history 16 events
-
2026-06-18days on market $64,900 Active 66 DOM
-
2026-06-17days on market $64,900 Active 65 DOM
-
2026-06-16days on market $64,900 Active 64 DOM
-
2026-06-15days on market $64,900 Active 63 DOM
-
2026-06-13days on market $64,900 Active 61 DOM
-
2026-06-13days on market $64,900 Active 60 DOM
-
2026-06-09days on market $64,900 Active 57 DOM
-
2026-06-08days on market $64,900 Active 56 DOM
-
2026-06-07days on market $64,900 Active 55 DOM
-
2026-06-04days on market $64,900 Active 52 DOM
-
2026-06-03days on market $64,900 Active 51 DOM
-
2026-06-02days on market $64,900 Active 50 DOM
-
2026-06-01days on market $64,900 Active 49 DOM
-
2026-05-31days on market $64,900 Active 48 DOM
-
2026-04-13$64,900 Active 436-char remark
Show marketing remark (436 chars)
Move-in ready manufactured home located in the highly desirable city of Novi! Situated on a premium corner lot, this home offers added privacy and curb appeal. Enjoy comfortable, low-maintenance living in a vibrant community featuring great amenities, including a pool, recreation center, and tennis courts. A fantastic opportunity to own in a well-maintained neighborhood with convenient access to shopping, dining, and major roadways.
ⓘ Source: listings_history table (triggers on properties + properties_extension) + one-shot
backfill from property_details.listing_events for pre-trigger history.
Climate risk First Street
- Flood 1/10 Low FEMA zone X · 0% chance over 30 yrs
- Wildfire 1/10 Low
- Heat 3/10 Moderate
- Air quality 3/10 Moderate 2 unhealthy d/yr today · 4 by 30 yrs out
Nearby sold comps map
Loading sold comps map…
Walkable amenities ~0.75 mi
Loading nearby amenities…
Taxation est. · year 1
- Rental income
- $23,073
- − Mortgage interest
- −$3,635
- − Property taxes
- −$974
- − Insurance
- −$324
- − Repairs & maintenance
- −$1,846
- − Management
- −$1,846
- − HOA
- −$10,908
- − Depreciation
- −$1,888
- Taxable income
- $1,652
- Est. tax owed @ 24.0%
- −$396
- After-tax cash flow
- $1,541/yr
For passive investors: Depreciation is non-cash, so a rental often shows a tax loss while cash-flowing — sheltering income. Rental losses are passive: they offset passive income freely, and up to $25,000/yr can offset ordinary (W-2) income if you actively participate and your MAGI is under $100k (phasing out to $0 by $150k); unused losses carry forward. On sale, claimed depreciation is recaptured at up to 25%, and gains may owe capital-gains tax (a 1031 exchange can defer both). Figures are a year-1 estimate at your 24.0% rate — not tax advice; consult a CPA.
Condition & rehab AI · 12 photos
This move-in ready manufactured home in Novi offers a good condition with minimal repairs needed. It's located on a premium corner lot with added privacy and curb appeal, making it an excellent opportunity for investment.
Value-add opportunities
- Resale Paint exterior siding — Fresh paint can enhance curb appeal and property value.
- Resale Paint interior walls — Fresh paint can make the interior look more modern and appealing.
- Both Replace countertops — New countertops can improve functionality and aesthetics, benefiting both resale and rental value.
- Both Replace flooring — New flooring can improve functionality and aesthetics, benefiting both resale and rental value.
- Both Replace appliances — Upgraded appliances can improve functionality and aesthetics, benefiting both resale and rental value.
- Resale Landscaping improvements — Enhanced landscaping can improve curb appeal and property value.
Renovation cost estimate screening
Value-add ROI direction
- Resale Paint exterior siding — Fresh paint can enhance curb appeal and property value. ↑
- Resale Paint interior walls — Fresh paint can make the interior look more modern and appealing. ↑
- Both Replace countertops — New countertops can improve functionality and aesthetics, benefiting both resale and rental value. ↑
- Both Replace flooring — New flooring can improve functionality and aesthetics, benefiting both resale and rental value. ↑
- Both Replace appliances — Upgraded appliances can improve functionality and aesthetics, benefiting both resale and rental value. ↑
- Resale Landscaping improvements — Enhanced landscaping can improve curb appeal and property value. ↑
ⓘ Cost ranges are severity-bucket heuristics (US national rule-of-thumb). Get contractor quotes + a written scope before underwriting a rehab budget.
Schools (NCES district)
- District
- Novi Community School District
- NCES district ID
- 2626130
- Math proficiency
- 73% ▼ -3.00%
- Reading proficiency
- 72% ▼ -1.00%
- Median HH income
- $90,023
- Composite
- 65.28/100
- National rank
- #489
- State rank
- #7 of 540 in MI
Livability — Novi
- Score
- 86/100
- State rank
- #20
- US rank
- #377
Category grades
Schools grade is shown separately in the Schools card above.
Census & demographics
- Census place
- Novi, MI
- County
- Oakland County · 1,009,092 people
- City population
- 43,845
- Metro
- Detroit-Warren-Dearborn, MI
- Population (ZIP)
- 24,029
- Household income
- $112,545
- Rent vs Own
- Severe rent burden
- 517.0
Population outlook (Oakland County) Hauer SSP2
- Today (2025)
- 1,335,747 people
- By 2030
- 1,375,100 · +2.9%
- By 2040
- 1,435,385 · +7.5%
- By 2050
- 1,469,250 · +10.0%
- By 2075
- 1,531,946 · +14.7%
- By 2100
- 1,450,485 · +8.6%
Race, ethnicity, and origin ACS 2023
- Neighborhood character
- Diverse neighborhood (Simpson 0.60)
- Race & ethnicity
- White 56% Asian 27% Two or more races 7% Black 6% Hispanic / Latino 5%
- Hispanic origin (detail)
- Mexican 4%
- Common ancestry
- Romanian 10% Lithuanian 3% Slovak 2%
- Foreign-born
- 29% · China, Canada, South Korea
- Languages at home
- 67% English-only · Other Asian/Pacific 12% Other Indo-European 8% Spanish 4%
Political lean MEDSL · Oakland
- 2024 margin
- D (+10.6) · D 54.4% · R 43.8% · Other 1.9%
- 2008→2024 swing
- -3.9pp toward R · 2008: 14.5pp · 2024: 10.6pp
- All cycles
- 2024: D+10.6 2020: D+14.1 2016: D+8.1 2012: D+8.1 2008: D+14.5
Not yet ingested
- Civics
- —
Market trends
- HPI YoY
- ▼ -337.82%
- Current HPI
- 166.0153
- Rent YoY
- ▲ 1.68%
- Metro
- Detroit-Warren-Dearborn, MI
- State GDP YoY
- ▲ 1.37%
- F500 in state
- 28
Industry mix (Fortune 500 HQ in MI)
| Industry | F500 HQs | Revenue |
|---|---|---|
| Automotive Parts | 3 | $48B |
|
||
| Automotive | 2 | $372B |
|
||
| Chemicals | 1 | $45B |
|
||
| Automotive Retail | 1 | $29B |
|
||
| Healthcare / Medical Devices | 1 | $23B |
|
||
| Automotive Technology | 1 | $20B |
|
||
Price history
+0.0% since first listed2 events — show timeline
- 2026-04-13 Listed $64,900 REALCOMP
- 2026-04-13 Listed $64,900 MiRealSource-MiMLS
Cash-flow waterfall
monthlySold comps — $/sqft
last 12 mo · ≤1 miLoading sold comps…