701 Trails · Carter, TX
Flood risk No data
- FEMA flood zone
- —
- Chance of flooding over 30 yrs
- —
- Est. flood insurance / yr
- —
Fire risk No data
- Est. fire insurance / yr
- —
Heat risk No data
- Hot days now (above threshold)
- —
- Hot days in 30 yrs
- —
Wind risk No data
- Chance of severe wind over 30 yrs
- —
Air-quality risk No data
- Unhealthy air days now
- —
- Unhealthy air days in 30 yrs
- —
Risk factors via First Street. Map © Google.
Why this score? — see what drove the C- grade
The composite is a weighted blend of 9 inputs, each scored 0–100. Each bar is that input's sub-score; the figure is the points it added to the 100-point composite (weight × sub-score).
- Cash flow +21.3/30.0
- ARV discount +7.5/15.0
- DSCR +6.8/10.0
- 1% rule +5.0/10.0
- Condition / age +4.0/5.0
- Schools +3.5/10.0
- Rent growth +2.5/5.0
- Livability +2.5/5.0
- Appreciation +0.0/10.0
$225,000
🖨 Deal sheet 📄 Offer letter ✓ Due diligence
Listing remarks
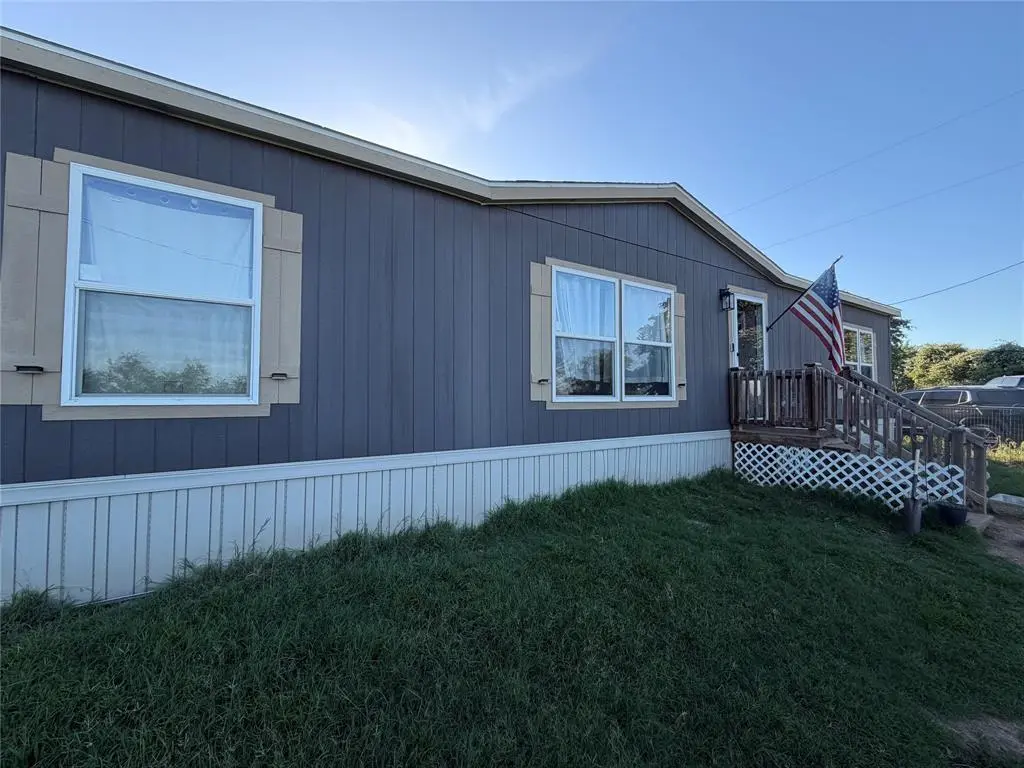
A 2021 Clayton Homes home situated on a dead end road which creates a feeling of total privacy with a country lifestyle on 2 acres! Storage building for added bonus of extra storage. This split bedroom 3 bedroom 2 bathroom layout is open planned with views for miles! At only 5 years old, you benefit from modern applianced, upgrades - including traditional Septic System with leach field and your own water well - which means no Water or Sewer utility bill! With part of your lot in Parker County at . 39 in Wise County - which also lowers your tax bill! This home gives you all the benefits AND sits in highly desirable Poolville ISD. No restrictions & No HOA!
Key facts
- Water well
- Storage building
- Modern appliances
Tags
Property features AI
Finance
- Other: Property spans multiple parcels
- Financial info: Accepts Cash, Conventional, FHA, and VA financing; Treat as clear loan type; No second mortgage
- HOA & community: No association
Exterior
- Parking: Driveway
- Utilities: No municipal utility district
- Home design: Single family residence; Residential property; Detached; Built in 2021
- Exterior features: Horse permitted; All-weather road access
Interior
- Kitchen: Dishwasher
- Bedrooms: 3 bedrooms (primary bedroom on level 1)
- Bathrooms: 2 full bathrooms
- Interior features: Eat-in kitchen; One living area; One dining area; Levels: One
Neighborhood map
What this means for you Summary
Snapshot
- This is a 3-bed/2.0-bath manufactured listed at $225k. Condition is rated good.
Deal economics
- At list price, monthly cash flow is $329 ($4k/yr) — positive.
- The deal already cash-flows at list — no discount required.
- To meet the 1% rule (rent ≥ 1% of price), the offer needs to be $225k (0.0% below list).
- Recommended offer: $225k (0.0% below list) — sets the bar for 1% rule.
- Cap rate 8.0% vs local median 2.5% in Carter — top-decile yield for the area; either an underpriced asset or a hidden risk that comps aren't pricing in. Stress-test before assuming the spread holds.
Location & tenants
- Location reads: area grade C — affects rentability + tenant quality, not the cash-flow math above.
- Poolville ISD (rural): math 40% / reading 41% proficiency, ranked #385 of 826 in TX (top 47%) — families likely to look elsewhere, expect single-tenant / working-renter base with shorter leases.
- Zoned schools: Poolville El (math 32% / reading 37%, grade F, #1,995 of 4,322 statewide, top 50%, 380 students, 52% FRL).
- Market conditions: 288 active listings in the ZIP; 437 units permitted in Parker County in 2024 (0 in 5+ unit buildings).
Forward outlook
- Local home prices are declining (-3.0%/yr); year-one equity from $2k of loan paydown is wiped out by about $7k of value loss. Plan a longer hold.
- Parker County population projected at +32% by 2050 — long-run rental-demand tailwind backs the buy-and-hold thesis.
Negotiation context
- Only 14 days on market — expect competitive offers; lowballing is unlikely to land.
Questions for the listing agent
- Is there a deadline driving the sale (1031 exchange, divorce, estate, relocation)? That informs how much negotiation room exists.
- What's the average days-on-market for RENTAL listings here right now (not sales)? A rising rental-DOM trend means longer vacancies and softer asking-rent achievability than the comps imply.
- What's the recent tenant-quality profile in this submarket — average credit score on applications, eviction rate, late-payment / NSF rate, and stable-employment percentage? A property-management company in the area should have these aggregated.
- How much new for-sale + rental construction is in the pipeline within 1–3 miles? Heavy new supply typically softens prices + rents 12–24 months out; constrained supply supports both.
Investment metrics
- 1% rule
- 1.00% ✗
- Cap rate
- 8.05%
- Cash-on-cash
- 6.27%
- DSCR
- 1.28
- GRM
- 8.3
CMA / ARV
No comps found within radius.
Projected returns pro-forma
-3.0% appreciation · 3.0% rent growth · sell at horizon
- IRR
- -6.7%
- Equity multiple
- 0.75×
- Total profit
- $-15,539
- Equity at exit
- $33,548
- IRR
- 2.9%
- Equity multiple
- 1.21×
- Total profit
- $13,318
- Equity at exit
- $19,454
Cash invested: $63,000 (down + closing). Projections, not guarantees.
Landlord ↔ Tenant lean methodology
- Overall (STATE)
- 87 Strongly Landlord-Friendly
- State Texas
- 87 Strongly Landlord-Friendly · R+5
- County
- — inherits STATE
- City
- — inherits STATE
ZIP-level market 76487
- Home prices YoY
- -3.5%
- Active inventory
- 288
- Price-to-rent
- 8.3×
Monthly cashflow live
- Estimated rent
- $2,249 medium interval (Pro) →
- Mortgage (P&I)
- −$1,180
- Tax from tax record
- −$174 /mo · $2,088/yr
- Insurance
- −$94
- HOA
- −$0
- Vacancy / Maint / Mgmt
- −$472
- Net cashflow
- $329
Break-even live
UW: 25.0% down · 7.5% · 30yr · 1.5% tax · 5.0% vac · 8.0% maint · 8.0% mgmt
Financing live
Cash to close
- Down payment
- $56,250
- Closing costs
- $6,750
- Reserves months
- —
- Total cash needed
- —
Loan-product check · same deal, 3 products live
Conventional
25% down · 7.5% · 30yr
- Down + closing
- —
- Monthly P&I
- —
- Monthly cashflow
- —
- DSCR
- —
- Eligible?
- —
Personal DTI + credit; lowest rate.
DSCR
20% down · 8.5% · 30yr
- Down + closing
- —
- Monthly P&I
- —
- Monthly cashflow
- —
- DSCR
- —
- Eligible?
- —
No personal income docs; deal must DSCR.
Hard money
10% down · 12.0% · 12mo
- Down + closing
- —
- Monthly P&I
- —
- Monthly cashflow
- —
- DSCR
- —
- Eligible?
- —
Short-term bridge; refi at stabilization.
Listing history 11 events
-
2026-06-18days on market $225,000 Active 14 DOM
-
2026-06-17days on market $225,000 Active 13 DOM
-
2026-06-16days on market $225,000 Active 12 DOM
-
2026-06-15days on market $225,000 Active 11 DOM
-
2026-06-13days on market $225,000 Active 9 DOM
-
2026-06-13days on market $225,000 Active 8 DOM
-
2026-06-09days on market $225,000 Active 5 DOM
-
2026-06-08days on market $225,000 Active 4 DOM
-
2026-06-07days on market $225,000 Active 3 DOM
-
2026-06-04remarks 664-char remark
-
2026-06-04$225,000 Active 1 DOM
ⓘ Source: listings_history table (triggers on properties + properties_extension) + one-shot
backfill from property_details.listing_events for pre-trigger history.
Tax reassessment forecast TX · Resets to sale price
- Current annual tax
- $2,088 · $174/mo
- Projected year-2 tax
- $4,118 · $343/mo
- Expected delta
- +$2,030/yr (+$169/mo · 97.2%)
ⓘ Screening estimate from a state-policy table — verify with the county assessor before closing.
Nearby sold comps map
Loading sold comps map…
Walkable amenities ~0.75 mi
Loading nearby amenities…
Taxation est. · year 1
- Rental income
- $26,987
- − Mortgage interest
- −$12,603
- − Property taxes
- −$2,088
- − Insurance
- −$1,125
- − Repairs & maintenance
- −$2,159
- − Management
- −$2,159
- − Depreciation
- −$6,545
- Taxable income
- $307
- Est. tax owed @ 24.0%
- −$74
- After-tax cash flow
- $3,874/yr
For passive investors: Depreciation is non-cash, so a rental often shows a tax loss while cash-flowing — sheltering income. Rental losses are passive: they offset passive income freely, and up to $25,000/yr can offset ordinary (W-2) income if you actively participate and your MAGI is under $100k (phasing out to $0 by $150k); unused losses carry forward. On sale, claimed depreciation is recaptured at up to 25%, and gains may owe capital-gains tax (a 1031 exchange can defer both). Figures are a year-1 estimate at your 24.0% rate — not tax advice; consult a CPA.
Condition & rehab AI · 3 photos
This 2021 Clayton Homes manufactured home is in excellent condition with modern appliances and a split bedroom layout. It offers privacy and a country lifestyle on 2 acres with a storage building for added bonus storage. The home is in a highly desirable school district with no HOA and no restrictions.
Value-add opportunities
- Both Landscaping and curb appeal improvements — Enhances curb appeal and property value
- Both Painting exterior and interior — Fresh paint can improve curb appeal and interior aesthetics
- Both Landscaping and curb appeal improvements — Enhances curb appeal and property value
Renovation cost estimate screening
Value-add ROI direction
- Both Landscaping and curb appeal improvements — Enhances curb appeal and property value ↑
- Both Painting exterior and interior — Fresh paint can improve curb appeal and interior aesthetics ↑
- Both Landscaping and curb appeal improvements — Enhances curb appeal and property value ↑
ⓘ Cost ranges are severity-bucket heuristics (US national rule-of-thumb). Get contractor quotes + a written scope before underwriting a rehab budget.
Schools (NCES district)
- District
- Poolville ISD
- NCES district ID
- 4835340
- Math proficiency
- 40% ▼ -4.00%
- Reading proficiency
- 41% ▲ 3.00%
- Median HH income
- $49,462
- Composite
- 34.86/100
- National rank
- #5090
- State rank
- #385 of 826 in TX
Livability — Carter
No livability data for this city. (Only ~50 U.S. cities are tracked.)
Census & demographics
- Population (ZIP)
- 3,799
Population outlook (Parker County) Hauer SSP2
- Today (2025)
- 147,426 people
- By 2030
- 157,863 · +7.1%
- By 2040
- 177,519 · +20.4%
- By 2050
- 194,786 · +32.1%
- By 2075
- 238,799 · +62.0%
- By 2100
- 264,126 · +79.2%
Race, ethnicity, and origin ACS 2023
- Neighborhood character
- Predominantly White (77%)
- Race & ethnicity
- White 77% Hispanic / Latino 15% Two or more races 11%
- Hispanic origin (detail)
- Mexican 13%
- Common ancestry
- Lithuanian 3% Serbian 2% Italian 1%
- Foreign-born
- 2% · Canada
- Languages at home
- 92% English-only · Spanish 8%
Political lean MEDSL · Parker
- 2024 margin
- Solid R (+66.4) · D 16.4% · R 82.8%
- 2008→2024 swing
- -11.2pp toward R · 2008: -55.2pp · 2024: -66.4pp
- All cycles
- 2024: R+66.4 2020: R+64.4 2016: R+67.5 2012: R+65.8 2008: R+55.2
Not yet ingested
- Civics
- —
Market trends
- HPI YoY
- ▼ -10.44%
- Current HPI
- 283.54
- Rent YoY
- —
- Metro
- —
- State GDP YoY
- ▲ 3.95%
- F500 in state
- 110
Industry mix (Fortune 500 HQ in TX)
| Industry | F500 HQs | Revenue |
|---|---|---|
| Energy | 16 | $1,198B |
|
||
| Technology | 5 | $198B |
|
||
| Engineering / Construction | 4 | $72B |
|
||
| Energy Services | 3 | $60B |
|
||
| Utilities | 3 | $41B |
|
||
| Healthcare | 2 | $330B |
|
||
Price history
1 event — show timeline
- 2026-06-02 Listed $225,000 NTREIS
Property tax history
-0.2%/yrLatest (2025): $2,088 · +8.4% YoY. Source: county tax records.
Cash-flow waterfall
monthlySold comps — $/sqft
last 12 mo · ≤1 miLoading sold comps…