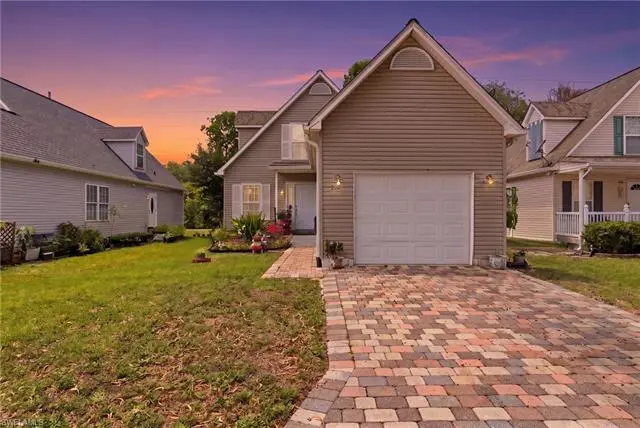
199 Leawood Cir · Berkshire Lakes, FL
Flood risk 6/10 · Moderate
- FEMA flood zone
- X (shaded)
- Chance of flooding over 30 yrs
- 0.57%
- Est. flood insurance / yr
- $507 – $1,088
Fire risk 1/10 · Minimal
- Est. fire insurance / yr
- $947 – $1,759
Heat risk 10/10 · Severe
- Hot days now (above 107°F)
- 7 days/yr
- Hot days in 30 yrs
- 29 days/yr
Wind risk 10/10 · Severe
- Chance of severe wind over 30 yrs
- 99.0%
Air-quality risk 2/10 · Minimal
- Unhealthy air days now
- 2 days/yr
- Unhealthy air days in 30 yrs
- 2 days/yr
Risk factors via First Street. Map © Google.
Why this score? — see what drove the D- grade
The composite is a weighted blend of 9 inputs, each scored 0–100. Each bar is that input's sub-score; the figure is the points it added to the 100-point composite (weight × sub-score).
- Cash flow +12.4/30.0
- ARV discount +7.5/15.0
- Schools +5.0/10.0
- DSCR +3.7/10.0
- 1% rule +3.4/10.0
- Livability +2.5/5.0
- Condition / age +2.5/5.0
- Rent growth +2.2/5.0
- Appreciation +0.0/10.0
$349,000
🖨 Deal sheet 📄 Offer letter ✓ Due diligence
Listing remarks
Amazing opportunity to own a 3BR/2.5BA home in Leawood Lakes with a large master bedroom and one-car garage. Functional layout with all bedrooms upstairs. Centrally located near shopping and schools with a low quarterly HOA. Community pool. Brand new roof.
Key facts
- One-car garage
- Brand new roof
- Centrally located
Tags
Property features AI
Finance
- HOA & community: Mandatory HOA; Quarterly HOA fee of $385 (total annual recurring fees $1,540); One-time fees $100; HOA includes lawn/land maintenance; Professional management; Community pool; Non-gated community
Exterior
- Parking: Attached garage; 1 garage space
- Utilities: Central water; Central sewer; Cable available
- Home design: Single family residential; 2 stories; Rear exposure faces west; Built in 2002; Located in Leawood Lakes development
- Construction: Wood frame construction
- Exterior features: Shingle roof; Shutters for storm protection; Aluminum siding exterior finish; Windows: see remarks; Preserve view
Interior
- Kitchen: Refrigerator/Freezer included
- Bedrooms: 3 bedrooms; 2-story floor plan
- Flooring: Tile flooring
- Bathrooms: 2 full bathrooms; 1 half bathroom; Master bath: None
- Heating & cooling: Central electric heating; Central electric cooling
- Interior features: Eat-in kitchen; See remarks for additional interior details; Unfurnished
- Laundry & utility: Central electric heat; Central electric cooling
Neighborhood map
What this means for you Summary
Snapshot
- This is a 3-bed/2.5-bath single-family listed at $349k.
Deal economics
- At list price, monthly cash flow is $-57 ($-683/yr) — negative.
- To cash-flow at today's rent, offer at most $339k (2.9% below list).
- To meet the 1% rule (rent ≥ 1% of price), the offer needs to be $293k (16.2% below list).
- Recommended offer: $293k (16.2% below list) — sets the bar for 1% rule.
Location & tenants
- Location reads: area grade D — affects rentability + tenant quality, not the cash-flow math above.
- Collier (suburban): math 60% / reading 56% proficiency, ranked #16 of 73 in FL (top 22%) — acceptable for families but not a draw, mixed tenant base, ~2y average lease.
- Market conditions: Rents soft (-1.1%/yr); 436 active listings in the ZIP; 40 comparable units currently listed for rent nearby; rentals at typical pace (median 21d on market — plan ~3-4 weeks tenant-placement turnaround); 3,520 units permitted in Collier County in 2024 (959 in 5+ unit buildings).
- At $2,926/mo this rent would consume 49% of the median local household income ($72k/yr) (locally 1423% of renters already pay >50% of income on rent) — very limited rent-growth headroom before tenants either downsize or default.
Forward outlook
- Local home prices are declining (-3.0%/yr); year-one equity from $2k of loan paydown is wiped out by about $10k of value loss. Plan a longer hold.
- Collier County population projected at +30% by 2050 — long-run rental-demand tailwind backs the buy-and-hold thesis.
Negotiation context
- It's been on market 27 days — a 2% lower offer ($344k) is reasonable based on typical stale-listing flexibility.
- 6 sale attempts since 15y ago with the ask held roughly flat each time — persistent listings suggest the price (not the market) is what's stuck; bring a comps-based counter.
- Current owner paid $278k; 26% above their basis — modest negotiation headroom, anchor on the comps not their cost.
Risks & watch-outs
- Climate carrying-cost: major flood risk; severe wind risk, 99% chance of damaging wind over 30y; extreme-heat days projected 7→29/yr by 2055 (HVAC capex compounding) — expect insurance premiums to compound above CPI over the hold.
Questions for the listing agent
- What do current leases actually rent for vs. the listed asking? Can we see a recent rent roll and the last 12 months of T-12 income?
- What does the HOA fee cover, when was the last increase, and are there any pending special assessments or reserve-fund shortfalls?
- Is there a deadline driving the sale (1031 exchange, divorce, estate, relocation)? That informs how much negotiation room exists.
- The area grade is low — what's the realistic commute time and amenity access for the typical tenant pool here? Any planned neighborhood developments (good or bad) we should know about?
- What's the average days-on-market for RENTAL listings here right now (not sales)? A rising rental-DOM trend means longer vacancies and softer asking-rent achievability than the comps imply.
- What's the recent tenant-quality profile in this submarket — average credit score on applications, eviction rate, late-payment / NSF rate, and stable-employment percentage? A property-management company in the area should have these aggregated.
- How much new for-sale + rental construction is in the pipeline within 1–3 miles? Heavy new supply typically softens prices + rents 12–24 months out; constrained supply supports both.
Investment metrics
- 1% rule
- 0.84% ✗
- Cap rate
- 6.10%
- Cash-on-cash
- -0.70%
- DSCR
- 0.97
- GRM
- 9.9
CMA / ARV
No comps found within radius.
Projected returns pro-forma
-3.0% appreciation · 0.0% rent growth · sell at horizon
- IRR
- -20.8%
- Equity multiple
- 0.30×
- Total profit
- $-68,735
- Equity at exit
- $52,037
- IRR
- -22.8%
- Equity multiple
- 0.00×
- Total profit
- $-97,589
- Equity at exit
- $30,175
Cash invested: $97,720 (down + closing). Projections, not guarantees.
Landlord ↔ Tenant lean methodology
- Overall (STATE)
- 87 Strongly Landlord-Friendly
- State Florida
- 87 Strongly Landlord-Friendly · R+3
- County
- — inherits STATE
- City
- — inherits STATE
ZIP-level market 34104
- Rents YoY
- -1.1%
- Active inventory
- 436
- Price-to-rent
- 9.9×
Monthly cashflow live
- Estimated rent
- $2,926 high interval (Pro) →
- Mortgage (P&I)
- −$1,830
- Tax from tax record
- −$265 /mo · $3,180/yr
- Insurance
- −$145
- HOA
- −$128
- Vacancy / Maint / Mgmt
- −$615
- Net cashflow
- $-57
Break-even live
UW: 25.0% down · 7.5% · 30yr · 1.5% tax · 5.0% vac · 8.0% maint · 8.0% mgmt
Financing live
Cash to close
- Down payment
- $87,250
- Closing costs
- $10,470
- Reserves months
- —
- Total cash needed
- —
Loan-product check · same deal, 3 products live
Conventional
25% down · 7.5% · 30yr
- Down + closing
- —
- Monthly P&I
- —
- Monthly cashflow
- —
- DSCR
- —
- Eligible?
- —
Personal DTI + credit; lowest rate.
DSCR
20% down · 8.5% · 30yr
- Down + closing
- —
- Monthly P&I
- —
- Monthly cashflow
- —
- DSCR
- —
- Eligible?
- —
No personal income docs; deal must DSCR.
Hard money
10% down · 12.0% · 12mo
- Down + closing
- —
- Monthly P&I
- —
- Monthly cashflow
- —
- DSCR
- —
- Eligible?
- —
Short-term bridge; refi at stabilization.
Rent comps 40 comps
| Address | Beds | Baths | Sqft | Rent | $/sqft | DOM | Units | Dist |
|---|---|---|---|---|---|---|---|---|
| 193 Fox Glen Dr Naples, FL | 3.0 | 2.0 | 1345 | $6,500 | $4.83 | 23d | 1 | 0.43mi |
| 5301 Whitten Dr #81 Naples, FL | 3.0 | 2.0 | 1386 | $2,700 | $1.95 | 23d | 1 | 0.62mi |
| 1075 Foxfire Ln Naples, FL | 2.0 | 2.0 | 1092 | $3,300 | $3.02 | 23d | 3 | 0.68mi |
| 882 Bluebird St Naples, FL | 3.0 | 2.0 | 1308 | $6,000 | $4.59 | 23d | 1 | 0.70mi |
| 5257 Whitten Dr Naples, FL | 2.0 | 2.0 | 1500 | $2,500 | $1.67 | 13d | 1 | 0.70mi |
| 6825 Sterling Greens Dr #102 Naples, FL | 3.0 | 2.0 | 1499 | $4,500 | $3.00 | 23d | 1 | 0.74mi |
| 6643 Craven Hill Way Naples, FL | 3.0 | 2.0 | 1384 | $2,900 | $2.10 | 13d | 1 | 0.76mi |
| 6816 Sterling Greens Pl #105 Naples, FL | 2.0 | 2.0 | 1243 | $1,895 | $1.52 | 21d | 1 | 0.77mi |
| 6816 Sterling Greens Dr Unit 1105 Naples, FL | 2.0 | 2.0 | 1243 | $1,895 | $1.52 | 13d | 1 | 0.77mi |
| 6700 Dennis Cir Unit A103 Naples, FL | 2.0 | 2.0 | 1308 | $2,000 | $1.53 | 13d | 1 | 0.79mi |
| 6828 Sterling Greens Dr Unit 4105 Naples, FL | 2.0 | 2.0 | 1242 | $3,750 | $3.02 | 13d | 1 | 0.80mi |
| 7065 Dennis Cir #302 Naples, FL | 2.0 | 2.0 | 1097 | $4,000 | $3.65 | 21d | 1 | 0.81mi |
| 1051 Eastham Way Unit B104 Naples, FL | 2.0 | 2.0 | 1091 | $4,300 | $3.94 | 13d | 1 | 0.87mi |
| 1748 Royal Cir Naples, FL | 3.0 | 2.0 | 1451 | $3,200 | $2.21 | 23d | 1 | 0.88mi |
| 4502 Parrot Ave Naples, FL | 3.0 | 2.0 | 1200 | $2,950 | $2.46 | 23d | 1 | 0.91mi |
| 1787 Reuven Cir Unit 1001 Naples, FL | 2.0 | 2.0 | 1112 | $1,300 | $1.17 | 13d | 1 | 0.91mi |
| 1100 Eastham Way Unit A-105 Naples, FL | 2.0 | 2.0 | 1184 | $4,500 | $3.80 | 13d | 1 | 0.92mi |
| 2972 Kings Lake Blvd #2972 Naples, FL | 2.0 | 2.0 | 1100 | $3,000 | $2.73 | 23d | 1 | 0.99mi |
| 1701 Courtyard Way Naples, FL | 2.0 | 2.0 | 1072 | $1,990 | $1.86 | 23d | 1 | 1.01mi |
| 1933 Courtyard Way Unit D-103 Naples, FL | 2.0 | 2.0 | 947 | $1,850 | $1.95 | 13d | 1 | 1.02mi |
| 1950 W Crown Pointe Blvd Unit B207 Naples, FL | 2.0 | 2.0 | 1129 | $1,950 | $1.73 | 23d | 1 | 1.04mi |
| 4210 Looking Glass Ln Unit 4210 Naples, FL | 2.0 | 2.0 | 1300 | $3,000 | $2.31 | 13d | 1 | 1.04mi |
| 1765 Courtyard Way Unit C206 Naples, FL | 2.0 | 2.5 | 1150 | $1,650 | $1.43 | 13d | 1 | 1.05mi |
| 1765 Courtyard Way Unit C-104 Naples, FL | 2.0 | 2.0 | 1132 | $2,700 | $2.39 | 13d | 1 | 1.05mi |
| 1895 Courtyard Way #103 Naples, FL | 3.0 | 2.0 | 1046 | $2,200 | $2.10 | 21d | 1 | 1.05mi |
| 4180 Looking Glass Ln Unit 4104 Naples, FL | 2.0 | 2.0 | 1246 | $4,000 | $3.21 | 13d | 1 | 1.07mi |
| 1810 Florida Club Cir Naples, FL | 2.0 | 2.0 | 1200 | $2,075 | $1.73 | 13d | 2 | 1.07mi |
| 1820 Florida Club Cir Naples, FL | 3.0 | 2.0 | 1282 | $2,850 | $2.22 | 23d | 2 | 1.08mi |
| 2050 W Crown Pointe Blvd Unit C214 Naples, FL | 3.0 | 2.0 | 1267 | $4,200 | $3.31 | 23d | 1 | 1.09mi |
| 1840 Florida Club Cir #5309 Naples, FL | 2.0 | 1.0 | 1328 | $2,300 | $1.73 | 23d | 1 | 1.13mi |
| 613 Windsor Sq #101 Naples, FL | 2.0 | 2.0 | 1316 | $3,800 | $2.89 | 23d | 1 | 1.13mi |
| 1830 Florida Club Cir #4111 Naples, FL | 3.0 | 2.0 | 1189 | $2,250 | $1.89 | 21d | 1 | 1.13mi |
| 1802 Kings Lake Blvd Unit 2-101 Naples, FL | 2.0 | 2.0 | 1465 | $5,500 | $3.75 | 23d | 1 | 1.14mi |
| 1826 Kings Lake Blvd #101 Naples, FL | 3.0 | 2.0 | 1456 | $2,700 | $1.85 | 13d | 1 | 1.16mi |
| 4060 Ice Castle Way #10 Naples, FL | 2.0 | 2.0 | 1246 | $3,600 | $2.89 | 13d | 1 | 1.16mi |
| 565 Windsor Sq #201 Naples, FL | 3.0 | 2.0 | 1421 | $3,800 | $2.67 | 21d | 1 | 1.17mi |
| 800 New Waterford Dr #201 Naples, FL | 2.0 | 2.0 | 1362 | $2,440 | $1.79 | 21d | 1 | 1.17mi |
| 1835 Florida Club Cir #3201 Naples, FL | 3.0 | 2.0 | 1375 | $2,095 | $1.52 | 13d | 1 | 1.17mi |
| 636 Windsor Sq #102 Naples, FL | 2.0 | 2.0 | 1191 | $3,750 | $3.15 | 23d | 1 | 1.18mi |
| 6954 Avalon Cir #703 Naples, FL | 2.0 | 2.0 | 1467 | $3,000 | $2.04 | 13d | 1 | 1.18mi |
HOA detail
- Monthly dues
- $128 · $1,536/yr
- Likely covers
- pool
Listing history 23 events
-
2026-05-13status Pending
-
2026-04-28price $349,000
-
2026-04-16$349,900 Active
-
2026-04-14historical
-
2026-03-31$355,000 Active
-
2026-03-26historical
-
2026-02-18status Active
-
2026-02-16status Pending
-
2026-01-30price $359,999
-
2026-01-05price $366,000
-
2026-01-02price $366,900
-
2025-12-15price $367,000
-
2025-12-15status Active
-
2025-12-08status Pending
-
2025-11-24price $369,899
-
2025-11-03price $369,999
-
2025-08-26$389,000 Active
-
2022-02-04soldstatus $278,000
-
2011-09-16soldstatus $89,500
-
2011-08-26$92,500
-
2003-03-24soldstatus $154,000
-
2001-07-03soldstatus $3,750,000
-
2000-03-14soldstatus $3,033,000
ⓘ Source: listings_history table (triggers on properties + properties_extension) + one-shot
backfill from property_details.listing_events for pre-trigger history.
Tax reassessment forecast FL · Resets to sale price
- Current annual tax
- $3,180 · $265/mo
- Projected year-2 tax
- $3,180 · $265/mo
- Expected delta
- $0/yr ($0/mo · 0.0%)
ⓘ Screening estimate from a state-policy table — verify with the county assessor before closing.
Climate risk First Street
- Flood 6/10 Major FEMA zone X (shaded) · 57% chance over 30 yrs
- Wildfire 1/10 Low
- Heat 10/10 Extreme 7 d/yr ≥107°F today · 29 d/yr by 30 yrs out
- Wind 10/10 Extreme 99% chance of damaging wind over 30 yrs
- Air quality 2/10 Low 2 unhealthy d/yr today · 2 by 30 yrs out
Nearby sold comps map
Loading sold comps map…
Walkable amenities ~0.75 mi
Loading nearby amenities…
Taxation est. · year 1
- Rental income
- $35,115
- − Mortgage interest
- −$19,549
- − Property taxes
- −$3,180
- − Insurance
- −$1,745
- − Repairs & maintenance
- −$2,809
- − Management
- −$2,809
- − HOA
- −$1,536
- − Depreciation
- −$10,153
- Taxable loss
- −$6,667
- Est. tax savings @ 24.0%
- +$1,600
- After-tax cash flow
- $917/yr
For passive investors: Depreciation is non-cash, so a rental often shows a tax loss while cash-flowing — sheltering income. Rental losses are passive: they offset passive income freely, and up to $25,000/yr can offset ordinary (W-2) income if you actively participate and your MAGI is under $100k (phasing out to $0 by $150k); unused losses carry forward. On sale, claimed depreciation is recaptured at up to 25%, and gains may owe capital-gains tax (a 1031 exchange can defer both). Figures are a year-1 estimate at your 24.0% rate — not tax advice; consult a CPA.
Schools (NCES district)
- District
- Collier
- NCES district ID
- 1200330
- Math proficiency
- 60% ▼ -4.00%
- Reading proficiency
- 56% ▼ -2.00%
- Median HH income
- $58,275
- Composite
- 50.23/100
- National rank
- #1892
- State rank
- #16 of 73 in FL
Livability — Berkshire Lakes
No livability data for this city. (Only ~50 U.S. cities are tracked.)
Census & demographics
- County
- Collier County · 396,295 people
- Metro
- Naples-Marco Island, FL
- Population (ZIP)
- 26,408
- Household income
- $71,686
- Rent vs Own
- Severe rent burden
- 1423.0
Population outlook (Collier County) Hauer SSP2
- Today (2025)
- 420,858 people
- By 2030
- 450,054 · +6.9%
- By 2040
- 502,232 · +19.3%
- By 2050
- 544,932 · +29.5%
- By 2075
- 627,203 · +49.0%
- By 2100
- 659,015 · +56.6%
Race, ethnicity, and origin ACS 2023
- Neighborhood character
- Majority White (62%)
- Race & ethnicity
- White 62% Hispanic / Latino 30% Two or more races 19% Black 4% Asian 2%
- Hispanic origin (detail)
- Mexican 7% Puerto Rican 3% Cuban 6% Dominican 1%
- Common ancestry
- Lithuanian 6% Romanian 3% Hispanic 2%
- Foreign-born
- 30% · Canada, Jamaica, Dominican Republic
- Languages at home
- 66% English-only · Spanish 24% French/Haitian/Cajun 5% Russian/Polish/Slavic 1%
Political lean MEDSL · Collier
- 2024 margin
- Solid R (+33.1) · D 33.1% · R 66.2%
- 2008→2024 swing
- -10.6pp toward R · 2008: -22.5pp · 2024: -33.1pp
- All cycles
- 2024: R+33.1 2020: R+24.7 2016: R+26.0 2012: R+30.1 2008: R+22.5
Not yet ingested
- Civics
- —
Market trends
- HPI YoY
- ▼ -252.48%
- Current HPI
- 259.3498
- Rent YoY
- ▼ -1.10%
- Metro
- Naples-Marco Island, FL
- State GDP YoY
- ▲ 3.28%
- F500 in state
- 36
Industry mix (Fortune 500 HQ in FL)
| Industry | F500 HQs | Revenue |
|---|---|---|
| Industrial Technology | 2 | $29B |
|
||
| Insurance | 2 | $17B |
|
||
| Retail | 1 | $60B |
|
||
| Technology Distribution | 1 | $58B |
|
||
| Homebuilding | 1 | $35B |
|
||
| Technology Manufacturing | 1 | $35B |
|
||
Price history
-88.5% since first listed23 events — show timeline
- 2026-05-13 Pending — NAPLESMLS
- 2026-04-28 Price Changed $349,000 NAPLESMLS
- 2026-04-16 Listed $349,900 NAPLESMLS
- 2026-04-14 Listing Removed — NAPLESMLS
- 2026-03-31 Listed $355,000 NAPLESMLS
- 2026-03-26 Listing Removed — NAPLESMLS
- 2026-02-18 Relisted — NAPLESMLS
- 2026-02-16 Pending — NAPLESMLS
- 2026-01-30 Price Changed $359,999 NAPLESMLS
- 2026-01-05 Price Changed $366,000 NAPLESMLS
- 2026-01-02 Price Changed $366,900 NAPLESMLS
- 2025-12-15 Price Changed $367,000 NAPLESMLS
- 2025-12-15 Relisted — NAPLESMLS
- 2025-12-08 Pending — NAPLESMLS
- 2025-11-24 Price Changed $369,899 NAPLESMLS
- 2025-11-03 Price Changed $369,999 NAPLESMLS
- 2025-08-26 Listed $389,000 NAPLESMLS
- 2022-02-04 Sold (Public Records) $278,000 Public Records
- 2011-09-16 Sold (MLS) $89,500 NAPLESMLS
- 2011-08-26 Listed $92,500 NAPLESMLS
- 2003-03-24 Sold (Public Records) $154,000 Public Records
- 2001-07-03 Sold (Public Records) $3,750,000 Public Records
- 2000-03-14 Sold (Public Records) $3,033,000 Public Records
Property tax history
+8.8%/yrLatest (2025): $3,180 · -3.5% YoY. Source: county tax records.
Cash-flow waterfall
monthlySold comps — $/sqft
last 12 mo · ≤1 miLoading sold comps…