 Multi-family
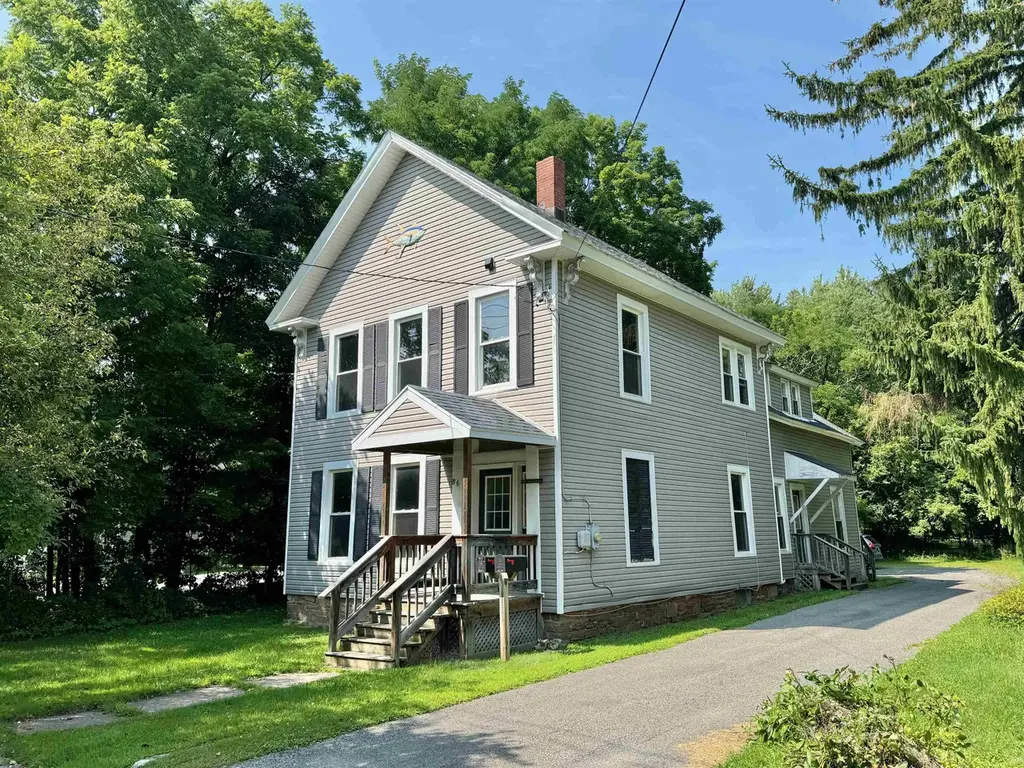
86 Main St · Potsdam, NY
Flood risk 1/10 · Minimal
- FEMA flood zone
- X
- Chance of flooding over 30 yrs
- 0.0%
- Est. flood insurance / yr
- $473 – $860
Fire risk 3/10 · Minor
- Est. fire insurance / yr
- $691 – $1,283
Heat risk 2/10 · Minimal
- Hot days now (above 92°F)
- 7 days/yr
- Hot days in 30 yrs
- 15 days/yr
Wind risk 1/10 · Minimal
- Chance of severe wind over 30 yrs
- —
Air-quality risk 1/10 · Minimal
- Unhealthy air days now
- 0 days/yr
- Unhealthy air days in 30 yrs
- 0 days/yr
Risk factors via First Street. Map © Google.
Why this score? — see what drove the A grade
The composite is a weighted blend of 9 inputs, each scored 0–100. Each bar is that input's sub-score; the figure is the points it added to the 100-point composite (weight × sub-score).
- Cash flow +30.0/30.0
- ARV discount +15.0/15.0
- 1% rule +10.0/10.0
- DSCR +10.0/10.0
- Appreciation +10.0/10.0
- Schools +5.0/10.0
- Livability +3.8/5.0
- Rent growth +2.5/5.0
- Condition / age +2.5/5.0
$175,000
🖨 Deal sheet 📄 Offer letter ✓ Due diligence
Multi-family units
County records classify this as Multi-Family (2-4 Unit). Listing-text estimate: 1 unit. estimate disagrees with records
Listing remarks MLS
Very well-maintained 5 BR 1.5 bath plus studio apartment with separate entrance has been a proven income-producer in a residential neighborhood! Continue its use as a student rental or live in one of the units and rent out the other. Spacious rooms, bay window, curved staircase, updated kitchen, first-floor bedroom and bath, laundry, plus plentiful parking. Originally built in 1882, updates have given it an effective date of 1960. As a rental, tenants pay all utilities. Walking distance to Clarkson, SUNY, co-op and downtown. The main house now has tenants through 5/31/2027.
Key facts
- First-floor bedroom
- Curved staircase
- Bay window
Tags
Neighborhood map
What this means for you Summary
Snapshot
- This is a 7-bed/3.0-bath multifamily listed at $175k.
Deal economics
- At list price, monthly cash flow is $1k ($13k/yr) — positive.
- The deal already cash-flows at list — no discount required.
- Meets the 1% rule at list price ($3k rent vs $175k).
- Recommended offer: $154k (12.0% below list) — sets the bar for market timing.
- Cap rate 13.8% vs local median 4.9% in Potsdam — top-decile yield for the area; either an underpriced asset or a hidden risk that comps aren't pricing in. Stress-test before assuming the spread holds.
Location & tenants
- Location reads 75/100 on livability (#249 in NY, #3,908 nationally) — a middle-class / working-renter tenant base. Strengths: amenities A+, cost of living A+, health & safety A+; Watch: crime F, commute F, employment F.
- Potsdam Central School District (town): math 53% / reading 66% proficiency, ranked #258 of 590 in NY (top 44%) — acceptable for families but not a draw, mixed tenant base, ~2y average lease.
- Market conditions: 117 active listings in the ZIP; 215 units permitted in St. Lawrence County in 2024 (0 in 5+ unit buildings).
Forward outlook
- In year one you build about $19k of equity ($1k loan paydown + $18k appreciation (10.0% local appreciation)).
- St. Lawrence County population projected at -14% by 2050 — secular population decline; favor cash flow + early exit over multi-decade hold.
- At projected returns (10.0% appreciation + 3.0% rent growth), your $49k cash investment doubles in ~2 years — after that, you're playing with house money.
- By year 2, paydown + projected appreciation supports a ~$30k cash-out refi (75% LTV) — recoverable capital for the next deal without selling this one.
Negotiation context
- It's been on market 649 days — a 12% lower offer ($154k) is reasonable based on typical stale-listing flexibility.
Risks & watch-outs
- Watch-outs: property tax is 2.6% of price; built in 1882 — expect roof / HVAC / electrical / plumbing capex.
Questions for the listing agent
- It's been on market 649 days. Have you received any prior offers? Is the seller open to a 12% concession, seller financing, or rate buy-down credit?
- Built in 1882 — when were the roof, HVAC, electrical panel, plumbing, and water heater last replaced?
- Property tax is high relative to price — has the assessment been appealed recently, and will the sale trigger a re-assessment?
- Why hasn't it sold? Are there any deal-killer items the seller is aware of (foundation, flood, title, zoning, code violations)?
- Is there a deadline driving the sale (1031 exchange, divorce, estate, relocation)? That informs how much negotiation room exists.
- Schools are A-rated — typically a magnet for longer-tenancy family renters. What's the average tenant stay here, and is there a school-zone premium baked into asking?
- Crime grade is F in this area — have there been break-ins, vandalism, or insurance claims at this property in the last 3 years? What carrier currently insures it and at what premium?
- What's the average days-on-market for RENTAL listings here right now (not sales)? A rising rental-DOM trend means longer vacancies and softer asking-rent achievability than the comps imply.
- What's the recent tenant-quality profile in this submarket — average credit score on applications, eviction rate, late-payment / NSF rate, and stable-employment percentage? A property-management company in the area should have these aggregated.
- How much new apartment / multifamily construction is in the pipeline within 1–3 miles? Heavy new supply (>2% of stock underway) typically softens rents 12–24 months out; light construction supports rent growth.
Investment metrics
- 1% rule
- 1.78% ✓
- Cap rate
- 13.77%
- Cash-on-cash
- 26.69%
- DSCR
- 2.19
- GRM
- 4.7
CMA / ARV
- ARV (median comp)
- $265,395
- List price
- $175,000
- Delta
- -34.06%
- Verdict
- UNDERPRICED
- Comps
- 11 within 1.0 mi
Projected returns pro-forma
10.0% appreciation · 3.0% rent growth · sell at horizon
- IRR
- 44.5%
- Equity multiple
- 4.36×
- Total profit
- $164,868
- Equity at exit
- $157,654
- IRR
- 38.5%
- Equity multiple
- 9.80×
- Total profit
- $431,222
- Equity at exit
- $339,987
Cash invested: $49,000 (down + closing). Projections, not guarantees.
Landlord ↔ Tenant lean methodology
- Overall (STATE)
- 15 Strongly Tenant-Friendly
- State New York
- 15 Strongly Tenant-Friendly · D+10
- County
- — inherits STATE
- City
- — inherits STATE
ZIP-level market 13676
- Home prices YoY
- 17.7%
- Active inventory
- 117
- Price-to-rent
- 14.0×
Monthly cashflow live
- Estimated rent
- $3,120 medium interval (Pro) →
- Mortgage (P&I)
- −$918
- Tax from tax record
- −$384 /mo · $4,612/yr
- Insurance
- −$73
- HOA
- −$0
- Vacancy / Maint / Mgmt
- −$655
- Net cashflow
- $1,090
Break-even live
3-unit breakdown (identical units grouped — click to expand)
| Units | Beds | Baths | Est. rent |
|---|---|---|---|
| 3× units | 1 | 1 | $3,120 |
| #1 | 1 | 1 | $1,040 |
| #2 | 1 | 1 | $1,040 |
| #3 | 1 | 1 | $1,040 |
| Total (3 units) | $3,120 | ||
UW: 25.0% down · 7.5% · 30yr · 1.5% tax · 5.0% vac · 8.0% maint · 8.0% mgmt
Financing live
Cash to close
- Down payment
- $43,750
- Closing costs
- $5,250
- Reserves months
- —
- Total cash needed
- —
Loan-product check · same deal, 3 products live
Conventional
25% down · 7.5% · 30yr
- Down + closing
- —
- Monthly P&I
- —
- Monthly cashflow
- —
- DSCR
- —
- Eligible?
- —
Personal DTI + credit; lowest rate.
DSCR
20% down · 8.5% · 30yr
- Down + closing
- —
- Monthly P&I
- —
- Monthly cashflow
- —
- DSCR
- —
- Eligible?
- —
No personal income docs; deal must DSCR.
Hard money
10% down · 12.0% · 12mo
- Down + closing
- —
- Monthly P&I
- —
- Monthly cashflow
- —
- DSCR
- —
- Eligible?
- —
Short-term bridge; refi at stabilization.
Listing history 16 events
-
2026-06-18days on market $175,000 Active 649 DOM
-
2026-06-17days on market $175,000 Active 648 DOM
-
2026-06-16days on market $175,000 Active 647 DOM
-
2026-06-15days on market $175,000 Active 646 DOM
-
2026-06-13days on market $175,000 Active 644 DOM
-
2026-06-12days on market $175,000 Active 643 DOM
-
2026-06-09days on market $175,000 Active 640 DOM
-
2026-06-08days on market $175,000 Active 639 DOM
-
2026-06-07days on market $175,000 Active 638 DOM
-
2026-06-07days on market $175,000 Active 637 DOM
-
2026-06-04days on market $175,000 Active 634 DOM
-
2026-06-02days on market $175,000 Active 633 DOM
-
2026-06-01days on market $175,000 Active 632 DOM
-
2026-05-31days on market $175,000 Active 631 DOM
-
2025-09-18price $175,000 582-char remark
Show marketing remark (582 chars)
Very well-maintained 5 BR 1.5 bath plus studio apartment with separate entrance has been a proven income-producer in a residential neighborhood! Continue its use as a student rental or live in one of the units and rent out the other. Spacious rooms, bay window, curved staircase, updated kitchen, first-floor bedroom and bath, laundry, plus plentiful parking. Originally built in 1882, updates have given it an effective date of 1960. As a rental, tenants pay all utilities. Walking distance to Clarkson, SUNY, co-op and downtown. The main house now has tenants through 5/31/2027.
-
2024-09-07$189,000 Active 582-char remark
Show marketing remark (582 chars)
Very well-maintained 5 BR 1.5 bath plus studio apartment with separate entrance has been a proven income-producer in a residential neighborhood! Continue its use as a student rental or live in one of the units and rent out the other. Spacious rooms, bay window, curved staircase, updated kitchen, first-floor bedroom and bath, laundry, plus plentiful parking. Originally built in 1882, updates have given it an effective date of 1960. As a rental, tenants pay all utilities. Walking distance to Clarkson, SUNY, co-op and downtown. The main house now has tenants through 5/31/2027.
ⓘ Source: listings_history table (triggers on properties + properties_extension) + one-shot
backfill from property_details.listing_events for pre-trigger history.
Tax reassessment forecast NY · Partial reset (capped growth)
- Current annual tax
- $4,612 · $384/mo
- Projected year-2 tax
- $4,612 · $384/mo
- Expected delta
- $0/yr ($0/mo · 0.0%)
ⓘ Screening estimate from a state-policy table — verify with the county assessor before closing.
Climate risk First Street
- Flood 1/10 Low FEMA zone X · 0% chance over 30 yrs
- Wildfire 3/10 Moderate
- Heat 2/10 Low 7 d/yr ≥92°F today · 15 d/yr by 30 yrs out
- Wind 1/10 Low
- Air quality 1/10 Low 0 unhealthy d/yr today · 0 by 30 yrs out
Nearby sold comps map
Loading sold comps map…
Walkable amenities ~0.75 mi
Loading nearby amenities…
Taxation est. · year 1
- Rental income
- $37,440
- − Mortgage interest
- −$9,803
- − Property taxes
- −$4,612
- − Insurance
- −$875
- − Repairs & maintenance
- −$2,995
- − Management
- −$2,995
- − Depreciation
- −$5,091
- Taxable income
- $11,069
- Est. tax owed @ 24.0%
- −$2,656
- After-tax cash flow
- $10,421/yr
For passive investors: Depreciation is non-cash, so a rental often shows a tax loss while cash-flowing — sheltering income. Rental losses are passive: they offset passive income freely, and up to $25,000/yr can offset ordinary (W-2) income if you actively participate and your MAGI is under $100k (phasing out to $0 by $150k); unused losses carry forward. On sale, claimed depreciation is recaptured at up to 25%, and gains may owe capital-gains tax (a 1031 exchange can defer both). Figures are a year-1 estimate at your 24.0% rate — not tax advice; consult a CPA.
Schools (NCES district)
- District
- Potsdam Central School District
- NCES district ID
- 3623670
- Math proficiency
- 53% ▼ -2.00%
- Reading proficiency
- 66% ▲ 12.00%
- Median HH income
- $44,144
- Composite
- 50.05/100
- National rank
- #1915
- State rank
- #258 of 590 in NY
Livability — Potsdam
- Score
- 75/100
- State rank
- #249
- US rank
- #3908
Category grades
Schools grade is shown separately in the Schools card above.
Census & demographics
- Census place
- Potsdam, NY
- City population
- 2,123
- Population (ZIP)
- 13,408
Population outlook (St. Lawrence County) Hauer SSP2
- Today (2025)
- 110,027 people
- By 2030
- 107,455 · -2.3%
- By 2040
- 100,492 · -8.7%
- By 2050
- 94,254 · -14.3%
- By 2075
- 80,175 · -27.1%
- By 2100
- 63,140 · -42.6%
Race, ethnicity, and origin ACS 2023
- Neighborhood character
- Predominantly White (90%)
- Race & ethnicity
- White 90% Two or more races 4% Asian 3% Hispanic / Latino 2% Black 2%
- Common ancestry
- Lithuanian 6% Romanian 4% Iranian 2%
- Foreign-born
- 7% · Canada, China
- Languages at home
- 94% English-only · Spanish 2% Other Indo-European 1% French/Haitian/Cajun 1%
Political lean MEDSL · St. Lawrence
- 2024 margin
- R (+18.0) · D 41.0% · R 59.0%
- 2008→2024 swing
- -34.3pp toward R · 2008: 16.3pp · 2024: -18.0pp
- All cycles
- 2024: R+18.0 2020: R+11.7 2016: R+10.8 2012: D+16.6 2008: D+16.3
Not yet ingested
- Civics
- —
Market trends
- HPI YoY
- ▲ 48.01%
- Current HPI
- 318.7704
- Rent YoY
- —
- Metro
- —
- State GDP YoY
- ▲ 2.60%
- F500 in state
- 92
Industry mix (Fortune 500 HQ in NY)
| Industry | F500 HQs | Revenue |
|---|---|---|
| Financial Services | 10 | $950B |
|
||
| Consumer Goods | 9 | $162B |
|
||
| Insurance | 4 | $225B |
|
||
| Telecommunications | 2 | $144B |
|
||
| Pharmaceuticals | 2 | $112B |
|
||
| Media / Entertainment | 2 | $69B |
|
||
Price history
-7.4% since first listed2 events — show timeline
- 2025-09-18 Price Changed $175,000 SLCMLS
- 2024-09-07 Listed $189,000 SLCMLS
Property tax history
+2.4%/yrLatest (2025): $4,612 · +5.4% YoY. Source: county tax records.
Cash-flow waterfall
monthlySold comps — $/sqft
last 12 mo · ≤1 miLoading sold comps…