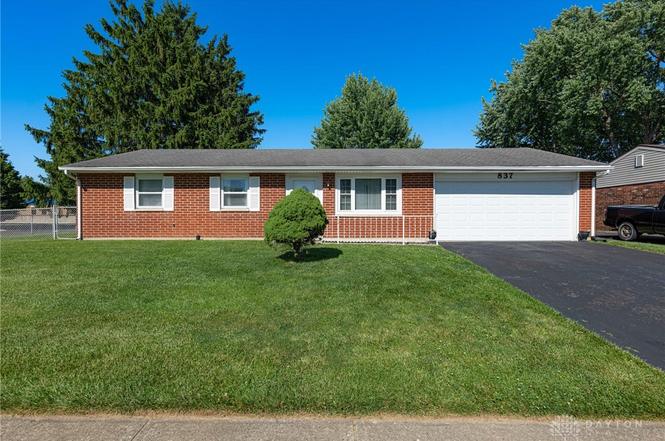
837 Colorado Dr · Xenia, OH
Flood risk 1/10 · Minimal
- FEMA flood zone
- X (unshaded)
- Chance of flooding over 30 yrs
- 0.0%
- Est. flood insurance / yr
- $507 – $1,088
Fire risk 1/10 · Minimal
- Est. fire insurance / yr
- $713 – $1,323
Heat risk 4/10 · Minor
- Hot days now (above 100°F)
- 7 days/yr
- Hot days in 30 yrs
- 18 days/yr
Wind risk 2/10 · Minimal
- Chance of severe wind over 30 yrs
- 1.0%
Air-quality risk 3/10 · Minor
- Unhealthy air days now
- 3 days/yr
- Unhealthy air days in 30 yrs
- 4 days/yr
Risk factors via First Street. Map © Google.
Why this score? — see what drove the D+ grade
The composite is a weighted blend of 9 inputs, each scored 0–100. Each bar is that input's sub-score; the figure is the points it added to the 100-point composite (weight × sub-score).
- Cash flow +14.2/30.0
- ARV discount +12.7/15.0
- DSCR +4.3/10.0
- Schools +4.0/10.0
- Rent growth +3.9/5.0
- Livability +3.8/5.0
- 1% rule +3.3/10.0
- Condition / age +2.5/5.0
- Appreciation +0.0/10.0
$219,900
🖨 Deal sheet 📄 Offer letter ✓ Due diligence
Listing remarks
Charming 3-bed, 1.5-bath home, lovingly maintained by the original owners and being sold by family. Bright, open interior with many newer windows, renovated baths (including a walk-in shower), updated neutral carpet. Generous-sized bedrooms and a lovely eat-in kitchen (appliances convey) open to the family room, which flows through a sliding door to the fenced backyard and patio, perfect for relaxing and entertaining. HVAC replaced in 2022. Storage barn too. .. Attractive entry door welcomes you in. Two car attached garage with insulated door. Excellent location near schools, parks, shopping, eateries, and quick access to I-35 for an easy commute. You will want to make 837 Colorado Dr. your
Key facts
- Renovated baths
- Storage barn
- Eat-in kitchen
Tags
Property features AI
Finance
- Other: Property is listed for sale
Exterior
- Parking: Attached two-car garage with garage door opener and additional storage
- Security: Smoke detectors
- Utilities: Natural gas available; Public water; Septic (septic tank)
- Home design: Single-story home; Brick and vinyl siding exterior; Slab foundation; Residential zoning
- Construction: Brick and vinyl siding construction; Slab foundation
- Exterior features: Fenced yard; Porch; Patio; Storage areas; Shed(s)
Interior
- Kitchen: Range; Microwave; Dishwasher; Garbage disposal; Refrigerator; Laminate countertops
- Bedrooms: Main level bedrooms (three bedrooms on main level)
- Flooring: Laminate (counters noted; specific floor materials not listed)
- Bathrooms: One full bathroom; One half bathroom
- Heating & cooling: Forced air heating (natural gas); Central air conditioning
- Interior features: Bay windows and insulated windows; Skylights; Ceiling fans; High-speed internet; Kitchen open to family room; Laminate counters; Walk-in closets
- Laundry & utility: Washer and dryer included; Electric water heater
Neighborhood map
What this means for you Summary
Snapshot
- This is a 3-bed/1.5-bath single-family listed at $220k.
Deal economics
- At list price, monthly cash flow is $36 ($428/yr) — positive.
- The deal already cash-flows at list — no discount required.
- To meet the 1% rule (rent ≥ 1% of price), the offer needs to be $182k (17.4% below list).
- Recommended offer: $182k (17.4% below list) — sets the bar for 1% rule.
- Cap rate 6.5% vs local median 3.6% in Xenia — top-decile yield for the area; either an underpriced asset or a hidden risk that comps aren't pricing in. Stress-test before assuming the spread holds.
Location & tenants
- Location reads 75/100 on livability (#244 in OH, #3,892 nationally) — a middle-class / working-renter tenant base. Strengths: cost of living A+, housing A+, health & safety B+; Watch: amenities D+, commute F, employment F.
- Xenia Community City (suburban): math 42% / reading 53% proficiency, ranked #478 of 656 in OH (top 73%) — families likely to look elsewhere, expect single-tenant / working-renter base with shorter leases.
- Market conditions: Rents rising fast (+5.5%/yr); 234 active listings in the ZIP; 2 comparable units currently listed for rent nearby; solid renter incomes; 797 units permitted in Greene County in 2024 (148 in 5+ unit buildings).
Forward outlook
- Local home prices are declining (-3.0%/yr); year-one equity from $2k of loan paydown is wiped out by about $7k of value loss. Plan a longer hold.
Negotiation context
- Only 3 days on market — expect competitive offers; lowballing is unlikely to land.
- Current owner paid $23k; list at $220k implies a 860% gain — meaningful room to come down on a strong offer.
Questions for the listing agent
- Built in 1974 — when were the roof, HVAC, electrical panel, plumbing, and water heater last replaced?
- Is there a deadline driving the sale (1031 exchange, divorce, estate, relocation)? That informs how much negotiation room exists.
- The area grade is low — what's the realistic commute time and amenity access for the typical tenant pool here? Any planned neighborhood developments (good or bad) we should know about?
- What's the average days-on-market for RENTAL listings here right now (not sales)? A rising rental-DOM trend means longer vacancies and softer asking-rent achievability than the comps imply.
- What's the recent tenant-quality profile in this submarket — average credit score on applications, eviction rate, late-payment / NSF rate, and stable-employment percentage? A property-management company in the area should have these aggregated.
- How much new for-sale + rental construction is in the pipeline within 1–3 miles? Heavy new supply typically softens prices + rents 12–24 months out; constrained supply supports both.
Investment metrics
- 1% rule
- 0.83% ✗
- Cap rate
- 6.49%
- Cash-on-cash
- 0.69%
- DSCR
- 1.03
- GRM
- 10.1
CMA / ARV
- ARV (on-the-fly)
- $248,452
- Comps found
- 12
Show comp detail 12 sales within ~0.75 mi
| Address | Dist | Beds/Ba | Sqft | Sold | Price | $/sf | Match |
|---|---|---|---|---|---|---|---|
| 664 Nevada Dr | 0.17mi | 3/1.5 | 1,312 (-6%) | 1mo | $237,000 | $181 | 82 |
| 2149 Cornwall Dr | 0.30mi | 3/1.5 | 1,409 (+2%) | 3mo | $215,000 | $153 | 81 |
| 1321 Massachusetts Dr | 0.39mi | 3/2.0 | 1,461 (+5%) | 1mo | $207,000 | $142 | 70 |
| 2265 Virginia Dr | 0.22mi | 4/1.5 (+1) | 1,501 (+8%) | 3mo | $220,000 | $147 | 68 |
| 624 Georgia Dr | 0.27mi | 4/2.0 (+1) | 1,299 (-6%) | 2mo | $210,000 | $162 | 68 |
| 1077 Glen Kegley Dr | 0.55mi | 3/1.5 | 1,433 (+3%) | 1mo | $279,000 | $195 | 68 |
| 1874 Pennsylvania Dr | 0.39mi | 3/1.0 | 1,501 (+8%) | 3mo | $213,500 | $142 | 63 |
| 2432 Harmony Dr | 0.48mi | 3/2.0 | 1,296 (-7%) | 2mo | $279,900 | $216 | 63 |
| 2352 Pembury Dr | 0.44mi | 3/1.5 | 1,246 (-10%) | 2mo | $224,000 | $180 | 61 |
| 1540 Crockett Ct | 0.71mi | 3/1.0 | 1,434 (+3%) | 2mo | $215,000 | $150 | 58 |
| 2632 Ketki Ct | 0.71mi | 3/2.5 | 1,476 (+6%) | 1mo | $299,900 | $203 | 51 |
| 1772 Pueblo Dr | 0.57mi | 3/1.5 | 1,186 (-15%) | 1mo | $212,000 | $179 | 48 |
Match score weights: distance 35% · size 25% · config 20% · recency 20%. Top-matched comps best support the ARV.
Projected returns pro-forma
-3.0% appreciation · 5.48% rent growth · sell at horizon
- IRR
- -12.7%
- Equity multiple
- 0.53×
- Total profit
- $-28,769
- Equity at exit
- $32,788
- IRR
- -0.5%
- Equity multiple
- 0.96×
- Total profit
- $-2,280
- Equity at exit
- $19,013
Cash invested: $61,572 (down + closing). Projections, not guarantees.
Landlord ↔ Tenant lean methodology
- Overall (STATE)
- 73 Landlord-Friendly
- State Ohio
- 73 Landlord-Friendly · R+6
- County
- — inherits STATE
- City
- — inherits STATE
ZIP-level market 45385
- Rents YoY
- 5.5%
- Active inventory
- 234
- Price-to-rent
- 10.1×
Monthly cashflow live
- Estimated rent
- $1,815 medium interval (Pro) →
- Mortgage (P&I)
- −$1,153
- Tax from tax record
- −$154 /mo · $1,844/yr
- Insurance
- −$92
- HOA
- −$0
- Vacancy / Maint / Mgmt
- −$381
- Net cashflow
- $36
Break-even live
UW: 25.0% down · 7.5% · 30yr · 1.5% tax · 5.0% vac · 8.0% maint · 8.0% mgmt
Financing live
Cash to close
- Down payment
- $54,975
- Closing costs
- $6,597
- Reserves months
- —
- Total cash needed
- —
Loan-product check · same deal, 3 products live
Conventional
25% down · 7.5% · 30yr
- Down + closing
- —
- Monthly P&I
- —
- Monthly cashflow
- —
- DSCR
- —
- Eligible?
- —
Personal DTI + credit; lowest rate.
DSCR
20% down · 8.5% · 30yr
- Down + closing
- —
- Monthly P&I
- —
- Monthly cashflow
- —
- DSCR
- —
- Eligible?
- —
No personal income docs; deal must DSCR.
Hard money
10% down · 12.0% · 12mo
- Down + closing
- —
- Monthly P&I
- —
- Monthly cashflow
- —
- DSCR
- —
- Eligible?
- —
Short-term bridge; refi at stabilization.
Rent comps 2 comps
| Address | Beds | Baths | Sqft | Rent | $/sqft | DOM | Units | Dist |
|---|---|---|---|---|---|---|---|---|
| 216 Kansas Dr Xenia, OH | 3.0 | 2.0 | 1100 | $1,600 | $1.45 | 2d | 1 | 0.63mi |
| 1414 Camden Ln Xenia, OH | 3.0 | 2.0 | 1498 | $2,250 | $1.50 | 43d | 1 | 1.15mi |
Listing history 4 events
-
2026-06-18days on market $219,900 Active 3 DOM
-
2026-06-17days on market $219,900 Active 2 DOM
-
2026-06-15remarks 699-char remark
-
2026-06-15$219,900 Active 1 DOM
ⓘ Source: listings_history table (triggers on properties + properties_extension) + one-shot
backfill from property_details.listing_events for pre-trigger history.
Tax reassessment forecast OH · Partial reset (capped growth)
- Current annual tax
- $1,844 · $154/mo
- Projected year-2 tax
- $2,637 · $220/mo
- Expected delta
- +$793/yr (+$66/mo · 43.0%)
ⓘ Screening estimate from a state-policy table — verify with the county assessor before closing.
Climate risk First Street
- Flood 1/10 Low FEMA zone X (unshaded) · 0% chance over 30 yrs
- Wildfire 1/10 Low
- Heat 4/10 Moderate 7 d/yr ≥100°F today · 18 d/yr by 30 yrs out
- Wind 2/10 Low 100% chance of damaging wind over 30 yrs
- Air quality 3/10 Moderate 3 unhealthy d/yr today · 4 by 30 yrs out
Nearby sold comps map
Loading sold comps map…
Walkable amenities ~0.75 mi
Loading nearby amenities…
Taxation est. · year 1
- Rental income
- $21,784
- − Mortgage interest
- −$12,318
- − Property taxes
- −$1,844
- − Insurance
- −$1,100
- − Repairs & maintenance
- −$1,743
- − Management
- −$1,743
- − Depreciation
- −$6,397
- Taxable loss
- −$3,360
- Est. tax savings @ 24.0%
- +$806
- After-tax cash flow
- $1,234/yr
For passive investors: Depreciation is non-cash, so a rental often shows a tax loss while cash-flowing — sheltering income. Rental losses are passive: they offset passive income freely, and up to $25,000/yr can offset ordinary (W-2) income if you actively participate and your MAGI is under $100k (phasing out to $0 by $150k); unused losses carry forward. On sale, claimed depreciation is recaptured at up to 25%, and gains may owe capital-gains tax (a 1031 exchange can defer both). Figures are a year-1 estimate at your 24.0% rate — not tax advice; consult a CPA.
Schools (NCES district)
- District
- Xenia Community City
- NCES district ID
- 3904515
- Math proficiency
- 42% ▼ -16.00%
- Reading proficiency
- 53% ▼ -5.00%
- Median HH income
- $46,206
- Composite
- 40.31/100
- National rank
- #3752
- State rank
- #478 of 656 in OH
Livability — Xenia
- Score
- 75/100
- State rank
- #244
- US rank
- #3892
Category grades
Schools grade is shown separately in the Schools card above.
Census & demographics
- Census place
- Xenia, OH
- County
- Greene County · 132,120 people
- City population
- 40,617
- Metro
- Dayton-Kettering, OH
- Population (ZIP)
- 40,617
- Household income
- $76,564
- Rent vs Own
- Severe rent burden
- 906.0
Population outlook (Greene County) Hauer SSP2
- Today (2025)
- 170,301 people
- By 2030
- 171,840 · +0.9%
- By 2040
- 171,408 · +0.7%
- By 2050
- 167,806 · -1.5%
- By 2075
- 154,430 · -9.3%
- By 2100
- 138,669 · -18.6%
Race, ethnicity, and origin ACS 2023
- Neighborhood character
- Predominantly White (83%)
- Race & ethnicity
- White 83% Two or more races 6% Black 6% Hispanic / Latino 2% Asian 2%
- Common ancestry
- Slovak 3% Italian 2% Serbian 1%
- Foreign-born
- 3% · Canada
- Languages at home
- 96% English-only · Other Indo-European 1% Spanish 1%
Political lean MEDSL · Greene
- 2024 margin
- R (+19.8) · D 39.5% · R 59.3% · Other 1.2%
- 2008→2024 swing
- -1.4pp toward R · 2008: -18.4pp · 2024: -19.8pp
- All cycles
- 2024: R+19.8 2020: R+19.5 2016: R+24.5 2012: R+21.8 2008: R+18.4
Not yet ingested
- Civics
- —
Market trends
- HPI YoY
- ▼ -158.15%
- Current HPI
- 239.0473
- Rent YoY
- ▲ 5.48%
- Metro
- Dayton-Kettering, OH
- State GDP YoY
- ▲ 1.98%
- F500 in state
- 48
Industry mix (Fortune 500 HQ in OH)
| Industry | F500 HQs | Revenue |
|---|---|---|
| Insurance | 3 | $145B |
|
||
| Industrial Machinery | 3 | $49B |
|
||
| Financial Services | 3 | $24B |
|
||
| Consumer Goods | 2 | $93B |
|
||
| Aerospace / Defense | 2 | $47B |
|
||
| Utilities | 2 | $33B |
|
||
Price history
+860.3% since first listed2 events — show timeline
- 2026-06-15 Listed $219,900 Dayton MLS
- 1974-12-06 Sold (Public Records) $22,900 Public Records
Property tax history
+4.3%/yrLatest (2025): $1,844 · +1.2% YoY. Source: county tax records.
Cash-flow waterfall
monthlySold comps — $/sqft
last 12 mo · ≤1 miLoading sold comps…