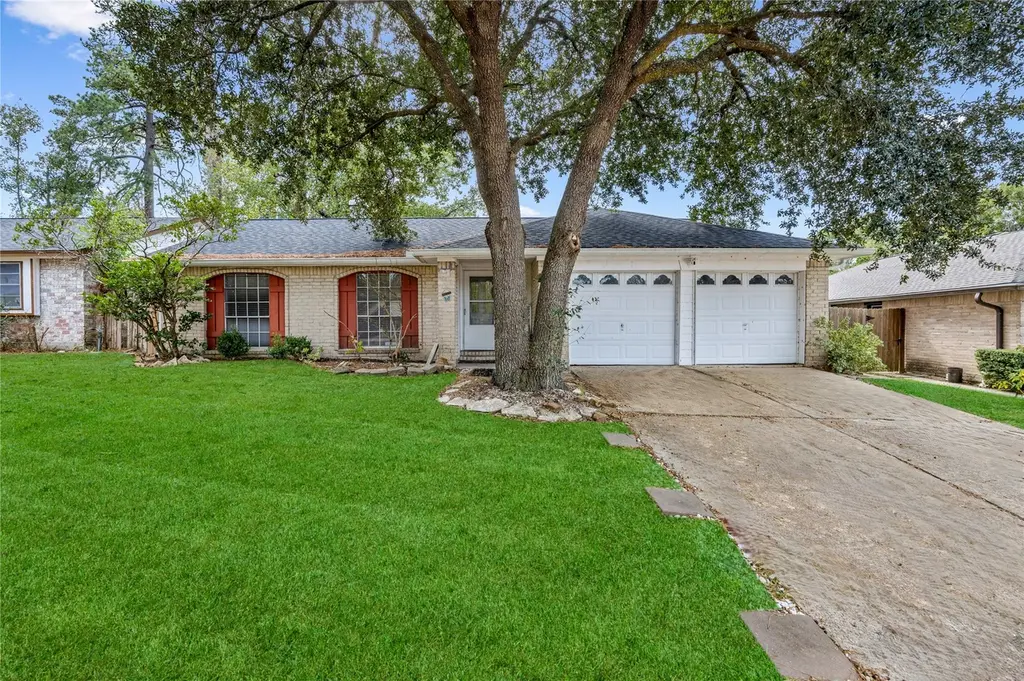
5306 Atascocita West Trl · Atascocita, TX
Flood risk 3/10 · Minor
- FEMA flood zone
- X (unshaded)
- Chance of flooding over 30 yrs
- 0.1%
- Est. flood insurance / yr
- $507 – $1,088
Fire risk 2/10 · Minimal
- Est. fire insurance / yr
- $1,222 – $2,270
Heat risk 9/10 · Severe
- Hot days now (above 110°F)
- 7 days/yr
- Hot days in 30 yrs
- 24 days/yr
Wind risk 9/10 · Severe
- Chance of severe wind over 30 yrs
- 99.0%
Air-quality risk 3/10 · Minor
- Unhealthy air days now
- 3 days/yr
- Unhealthy air days in 30 yrs
- 3 days/yr
Risk factors via First Street. Map © Google.
Why this score? — see what drove the D+ grade
The composite is a weighted blend of 9 inputs, each scored 0–100. Each bar is that input's sub-score; the figure is the points it added to the 100-point composite (weight × sub-score).
- Cash flow +12.6/30.0
- ARV discount +11.4/15.0
- 1% rule +4.8/10.0
- Appreciation +4.5/10.0
- Schools +3.9/10.0
- DSCR +3.8/10.0
- Livability +3.5/5.0
- Rent growth +2.5/5.0
- Condition / age +2.5/5.0
$209,000
🖨 Deal sheet 📄 Offer letter ✓ Due diligence
Listing remarks MLS
Charming 4 bedrooms, 2 baths home with backyard porch. Located in a well established neighborhood. The property features a functional floor plan and kitchen ready for your personal touch. Home needs some TLC presenting an excellent opportunity for investors or buyers looking to customize and add value. Conveniently located near shopping, dining and major highways.
Key facts
- Backyard porch
- 6,499 sq ft lot
- 2 garage spots
Tags
Neighborhood map
What this means for you Summary
Snapshot
- This is a 4-bed/2.0-bath single-family listed at $209k.
Deal economics
- At list price, monthly cash flow is $-26 ($-313/yr) — negative.
- To cash-flow at today's rent, offer at most $204k (2.2% below list).
- To meet the 1% rule (rent ≥ 1% of price), the offer needs to be $205k (1.9% below list).
- Recommended offer: $184k (12.0% below list) — sets the bar for market timing.
- Cap rate 6.1% vs local median 4.1% in Atascocita — top-decile yield for the area; either an underpriced asset or a hidden risk that comps aren't pricing in. Stress-test before assuming the spread holds.
Location & tenants
- Location reads 70/100 on livability (#346 in TX) — a middle-class / working-renter tenant base. Strengths: employment A+, cost of living A+, housing A+; Watch: amenities F, commute F, health & safety F.
- Humble ISD (urban): math 38% / reading 44% proficiency, ranked #262 of 826 in TX (top 32%) — families likely to look elsewhere, expect single-tenant / working-renter base with shorter leases.
- Market conditions: Rents flat; 669 active listings in the ZIP; 11 comparable units currently listed for rent nearby; rentals at typical pace (median 22d on market — plan ~3-4 weeks tenant-placement turnaround); 45% of comp listings sitting > 30 days — soft ceiling on asking rent; high-income renter base; 29,883 units permitted in Harris County in 2024 (8,621 in 5+ unit buildings).
Forward outlook
- Local home prices are declining (-0.9%/yr); year-one equity from $1k of loan paydown is wiped out by about $2k of value loss. Plan a longer hold.
- Harris County population projected at +47% by 2050 — long-run rental-demand tailwind backs the buy-and-hold thesis.
Negotiation context
- It's been on market 224 days — a 12% lower offer ($184k) is reasonable based on typical stale-listing flexibility.
Risks & watch-outs
- Climate carrying-cost: severe wind risk, 99% chance of damaging wind over 30y; extreme-heat days projected 7→24/yr by 2055 (HVAC capex compounding) — expect insurance premiums to compound above CPI over the hold.
Questions for the listing agent
- What do current leases actually rent for vs. the listed asking? Can we see a recent rent roll and the last 12 months of T-12 income?
- It's been on market 224 days. Have you received any prior offers? Is the seller open to a 12% concession, seller financing, or rate buy-down credit?
- Built in 1977 — when were the roof, HVAC, electrical panel, plumbing, and water heater last replaced?
- What does the HOA fee cover, when was the last increase, and are there any pending special assessments or reserve-fund shortfalls?
- Why hasn't it sold? Are there any deal-killer items the seller is aware of (foundation, flood, title, zoning, code violations)?
- Is there a deadline driving the sale (1031 exchange, divorce, estate, relocation)? That informs how much negotiation room exists.
- The area grade is low — what's the realistic commute time and amenity access for the typical tenant pool here? Any planned neighborhood developments (good or bad) we should know about?
- What's the average days-on-market for RENTAL listings here right now (not sales)? A rising rental-DOM trend means longer vacancies and softer asking-rent achievability than the comps imply.
- What's the recent tenant-quality profile in this submarket — average credit score on applications, eviction rate, late-payment / NSF rate, and stable-employment percentage? A property-management company in the area should have these aggregated.
- How much new for-sale + rental construction is in the pipeline within 1–3 miles? Heavy new supply typically softens prices + rents 12–24 months out; constrained supply supports both.
Investment metrics
- 1% rule
- 0.98% ✗
- Cap rate
- 6.14%
- Cash-on-cash
- -0.53%
- DSCR
- 0.98
- GRM
- 8.5
CMA / ARV
- ARV (median comp)
- $229,003
- List price
- $209,000
- Delta
- -8.73%
- Verdict
- FAIR
- Comps
- 20 within 1.0 mi
Show comp detail 12 sales within ~0.75 mi
| Address | Dist | Beds/Ba | Sqft | Sold | Price | $/sf | Match |
|---|---|---|---|---|---|---|---|
| 5219 Forest Timbers Dr | 0.13mi | 4/2.0 | 1,669 (+1%) | 1mo | $239,000 | $143 | 92 |
| 19302 Flaxwood Dr | 0.27mi | 4/2.0 | 1,658 (-0%) | 2mo | $225,000 | $136 | 86 |
| 5619 Fawn Trail Ln | 0.58mi | 3/2.0 (-1) | 1,664 (+0%) | 1mo | $214,990 | $129 | 66 |
| 5534 Deer Timbers Trl | 0.45mi | 3/2.0 (-1) | 1,570 (-5%) | 1mo | $235,000 | $150 | 64 |
| 5102 Enchanted Timbers Dr | 0.37mi | 3/2.0 (-1) | 1,564 (-6%) | 6mo | $202,000 | $129 | 63 |
| 5415 Fawn Trail Ln | 0.34mi | 3/2.0 (-1) | 1,467 (-12%) | 2mo | $175,000 | $119 | 58 |
| 19914 Big Timber Dr | 0.61mi | 3/2.0 (-1) | 1,610 (-3%) | 5mo | $198,000 | $123 | 57 |
| 20035 Dawn Mist Dr | 0.54mi | 3/2.0 (-1) | 1,534 (-8%) | 0mo | $177,000 | $115 | 57 |
| 5514 Fawn Trail Ln | 0.44mi | 4/2.0 | 1,863 (+12%) | 3mo | $250,000 | $134 | 57 |
| 20018 Big Timber Dr | 0.69mi | 3/2.0 (-1) | 1,755 (+6%) | 3mo | $219,800 | $125 | 50 |
| 20022 River Brook Dr | 0.57mi | 4/2.5 | 1,904 (+15%) | 4mo | $314,995 | $165 | 44 |
| 20207 Misty Pines Dr | 0.69mi | 3/2.0 (-1) | 1,906 (+15%) | 2mo | $199,900 | $105 | 37 |
Match score weights: distance 35% · size 25% · config 20% · recency 20%. Top-matched comps best support the ARV.
Projected returns pro-forma
-0.95% appreciation · 0.09% rent growth · sell at horizon
- IRR
- -9.1%
- Equity multiple
- 0.61×
- Total profit
- $-22,644
- Equity at exit
- $50,910
- IRR
- -5.4%
- Equity multiple
- 0.55×
- Total profit
- $-26,345
- Equity at exit
- $53,852
Cash invested: $58,520 (down + closing). Projections, not guarantees.
Landlord ↔ Tenant lean methodology
- Overall (STATE)
- 87 Strongly Landlord-Friendly
- State Texas
- 87 Strongly Landlord-Friendly · R+5
- County
- — inherits STATE
- City
- — inherits STATE
ZIP-level market 77346
- Home prices YoY
- -0.4%
- Rents YoY
- 0.1%
- Active inventory
- 669
- Price-to-rent
- 8.5×
Monthly cashflow live
- Estimated rent
- $2,051 high interval (Pro) →
- Mortgage (P&I)
- −$1,096
- Tax from tax record
- −$434 /mo · $5,210/yr
- Insurance
- −$87
- HOA
- −$29
- Vacancy / Maint / Mgmt
- −$431
- Net cashflow
- $-26
Break-even live
UW: 25.0% down · 7.5% · 30yr · 1.5% tax · 5.0% vac · 8.0% maint · 8.0% mgmt
Financing live
Cash to close
- Down payment
- $52,250
- Closing costs
- $6,270
- Reserves months
- —
- Total cash needed
- —
Loan-product check · same deal, 3 products live
Conventional
25% down · 7.5% · 30yr
- Down + closing
- —
- Monthly P&I
- —
- Monthly cashflow
- —
- DSCR
- —
- Eligible?
- —
Personal DTI + credit; lowest rate.
DSCR
20% down · 8.5% · 30yr
- Down + closing
- —
- Monthly P&I
- —
- Monthly cashflow
- —
- DSCR
- —
- Eligible?
- —
No personal income docs; deal must DSCR.
Hard money
10% down · 12.0% · 12mo
- Down + closing
- —
- Monthly P&I
- —
- Monthly cashflow
- —
- DSCR
- —
- Eligible?
- —
Short-term bridge; refi at stabilization.
Rent comps 11 comps
| Address | Beds | Baths | Sqft | Rent | $/sqft | DOM | Units | Dist |
|---|---|---|---|---|---|---|---|---|
| 5419 Deer Timbers Trl Humble, TX | 3.0 | 2.0 | 1313 | $1,705 | $1.30 | 22d | 1 | 0.33mi |
| 19902 Burle Oak Dr Humble, TX | 3.0 | 2.5 | 1532 | $1,699 | $1.11 | 43d | 1 | 0.44mi |
| 20143 Dawn Mist Dr Humble, TX | 3.0 | 2.5 | 1617 | $1,659 | $1.03 | 43d | 1 | 0.69mi |
| 5303 Hill Timbers Dr Humble, TX | 3.0 | 2.0 | 1884 | $2,050 | $1.09 | 43d | 1 | 0.81mi |
| 5231 Flax Bourton St Humble, TX | 3.0 | 2.0 | 1513 | $1,856 | $1.23 | 2d | 1 | 0.86mi |
| 18551 Timber Forest Dr Humble, TX | 2.0–3.0 | 1.0–2.0 | 1080 | $1,609 | $1.49 | 2d | 7 | 0.97mi |
| 6227 Spruce Bough Ct Humble, TX | 3.0 | 2.0 | 1432 | $1,800 | $1.26 | 43d | 1 | 1.23mi |
| 6519 Kings Glen Dr Humble, TX | 1.0–3.0 | 1.0–2.5 | 1255 | $2,813 | $2.24 | 1d | 16 | 1.28mi |
| 18835 Atasca Oaks Dr Humble, TX | 3.0 | 2.0 | 1432 | $1,829 | $1.28 | 5d | 1 | 1.29mi |
| 20618 Carmine Oak Ct Humble, TX | 3.0 | 2.0 | 2087 | $2,195 | $1.05 | 43d | 1 | 1.44mi |
| 20707 Redbud Trl Humble, TX | 3.0 | 2.5 | 1965 | $2,450 | $1.25 | 22d | 1 | 1.48mi |
HOA detail
- Monthly dues
- $29 · $348/yr
Listing history 19 events
-
2026-06-18days on market $209,000 Active 224 DOM
-
2026-06-17days on market $209,000 Active 223 DOM
-
2026-06-16days on market $209,000 Active 222 DOM
-
2026-06-15days on market $209,000 Active 221 DOM
-
2026-06-13days on market $209,000 Active 219 DOM
-
2026-06-13days on market $209,000 Active 218 DOM
-
2026-06-09days on market $209,000 Active 215 DOM
-
2026-06-08days on market $209,000 Active 214 DOM
-
2026-06-07days on market $209,000 Active 213 DOM
-
2026-06-04days on market $209,000 Active 210 DOM
-
2026-06-03days on market $209,000 Active 209 DOM
-
2026-06-02days on market $209,000 Active 208 DOM
-
2026-06-01days on market $209,000 Active 207 DOM
-
2026-05-31days on market $209,000 Active 206 DOM
-
2026-02-01price $209,000 368-char remark
Show marketing remark (368 chars)
Charming 4 bedrooms, 2 baths home with backyard porch. Located in a well established neighborhood. The property features a functional floor plan and kitchen ready for your personal touch. Home needs some TLC presenting an excellent opportunity for investors or buyers looking to customize and add value. Conveniently located near shopping, dining and major highways.
-
2026-01-07price $225,000 368-char remark
Show marketing remark (368 chars)
Charming 4 bedrooms, 2 baths home with backyard porch. Located in a well established neighborhood. The property features a functional floor plan and kitchen ready for your personal touch. Home needs some TLC presenting an excellent opportunity for investors or buyers looking to customize and add value. Conveniently located near shopping, dining and major highways.
-
2025-11-06$235,000 Active 368-char remark
Show marketing remark (368 chars)
Charming 4 bedrooms, 2 baths home with backyard porch. Located in a well established neighborhood. The property features a functional floor plan and kitchen ready for your personal touch. Home needs some TLC presenting an excellent opportunity for investors or buyers looking to customize and add value. Conveniently located near shopping, dining and major highways.
-
2019-05-15soldstatus
-
2001-07-09soldstatus
ⓘ Source: listings_history table (triggers on properties + properties_extension) + one-shot
backfill from property_details.listing_events for pre-trigger history.
Tax reassessment forecast TX · Resets to sale price
- Current annual tax
- $5,210 · $434/mo
- Projected year-2 tax
- $5,210 · $434/mo
- Expected delta
- $0/yr ($0/mo · 0.0%)
ⓘ Screening estimate from a state-policy table — verify with the county assessor before closing.
Climate risk First Street
- Flood 3/10 Moderate FEMA zone X (unshaded) · 10% chance over 30 yrs
- Wildfire 2/10 Low
- Heat 9/10 Extreme 7 d/yr ≥110°F today · 24 d/yr by 30 yrs out
- Wind 9/10 Extreme 99% chance of damaging wind over 30 yrs
- Air quality 3/10 Moderate 3 unhealthy d/yr today · 3 by 30 yrs out
Nearby sold comps map
Loading sold comps map…
Walkable amenities ~0.75 mi
Loading nearby amenities…
Taxation est. · year 1
- Rental income
- $24,611
- − Mortgage interest
- −$11,707
- − Property taxes
- −$5,210
- − Insurance
- −$1,045
- − Repairs & maintenance
- −$1,969
- − Management
- −$1,969
- − HOA
- −$348
- − Depreciation
- −$6,080
- Taxable loss
- −$3,717
- Est. tax savings @ 24.0%
- +$892
- After-tax cash flow
- $579/yr
For passive investors: Depreciation is non-cash, so a rental often shows a tax loss while cash-flowing — sheltering income. Rental losses are passive: they offset passive income freely, and up to $25,000/yr can offset ordinary (W-2) income if you actively participate and your MAGI is under $100k (phasing out to $0 by $150k); unused losses carry forward. On sale, claimed depreciation is recaptured at up to 25%, and gains may owe capital-gains tax (a 1031 exchange can defer both). Figures are a year-1 estimate at your 24.0% rate — not tax advice; consult a CPA.
Schools (NCES district)
- District
- Humble ISD
- NCES district ID
- 4823910
- Math proficiency
- 38% ▼ -11.00%
- Reading proficiency
- 44% ▼ -7.00%
- Median HH income
- $83,946
- Composite
- 38.55/100
- National rank
- #4171
- State rank
- #262 of 826 in TX
Livability — Atascocita
- Score
- 70/100
- State rank
- #346
- US rank
- #7586
Category grades
Schools grade is shown separately in the Schools card above.
Census & demographics
- Census place
- Atascocita, TX
- County
- Harris County · 4,702,590 people
- City population
- 79,538
- Metro
- Houston-The Woodlands-Sugar Land, TX
- Population (ZIP)
- 79,538
- Household income
- $122,241
- Rent vs Own
- Severe rent burden
- 1072.0
Population outlook (Harris County) Hauer SSP2
- Today (2025)
- 5,571,493 people
- By 2030
- 6,089,821 · +9.3%
- By 2040
- 7,142,806 · +28.2%
- By 2050
- 8,185,864 · +46.9%
- By 2075
- 10,574,329 · +89.8%
- By 2100
- 12,109,958 · +117.4%
Race, ethnicity, and origin ACS 2023
- Neighborhood character
- Diverse neighborhood (Simpson 0.70)
- Race & ethnicity
- White 42% Hispanic / Latino 28% Black 21% Two or more races 18% Asian 4%
- Hispanic origin (detail)
- Mexican 20% Puerto Rican 2%
- Common ancestry
- Lithuanian 4% Slovak 1% Italian 1%
- Foreign-born
- 10% · Canada, Vietnam, China
- Languages at home
- 78% English-only · Spanish 17% Other Indo-European 1% German/W. Germanic 1%
Political lean MEDSL · Harris
- 2024 margin
- Lean D (+5.5) · D 52.0% · R 46.4% · Other 1.6%
- 2008→2024 swing
- +3.9pp toward D · 2008: 1.6pp · 2024: 5.5pp
- All cycles
- 2024: D+5.5 2020: D+13.3 2016: D+12.4 2012: D+0.1 2008: D+1.6
Not yet ingested
- Civics
- —
Market trends
- HPI YoY
- ▼ -0.95%
- Current HPI
- 218.0478
- Rent YoY
- ▲ 0.09%
- Metro
- Houston-The Woodlands-Sugar Land, TX
- State GDP YoY
- ▲ 3.95%
- F500 in state
- 110
Industry mix (Fortune 500 HQ in TX)
| Industry | F500 HQs | Revenue |
|---|---|---|
| Energy | 16 | $1,198B |
|
||
| Technology | 5 | $198B |
|
||
| Engineering / Construction | 4 | $72B |
|
||
| Energy Services | 3 | $60B |
|
||
| Utilities | 3 | $41B |
|
||
| Healthcare | 2 | $330B |
|
||
Price history
-11.1% since first listed5 events — show timeline
- 2026-02-01 Price Changed $209,000 HARMLS
- 2026-01-07 Price Changed $225,000 HARMLS
- 2025-11-06 Listed $235,000 HARMLS
- 2019-05-15 Sold (Public Records) — Public Records
- 2001-07-09 Sold (Public Records) — Public Records
Property tax history
+7.5%/yrLatest (2025): $5,210 · +8.2% YoY. Source: county tax records.
Cash-flow waterfall
monthlySold comps — $/sqft
last 12 mo · ≤1 miLoading sold comps…