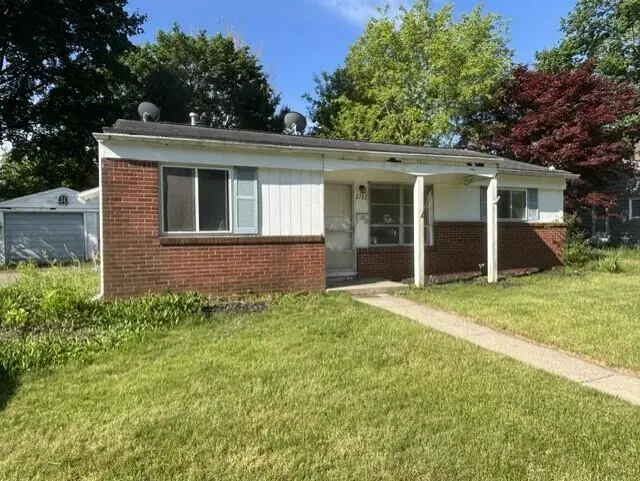
2722 Beacon Hl · Ann Arbor, MI
Flood risk 1/10 · Minimal
- FEMA flood zone
- X (unshaded)
- Chance of flooding over 30 yrs
- 0.0%
- Est. flood insurance / yr
- $473 – $860
Fire risk 1/10 · Minimal
- Est. fire insurance / yr
- $784 – $1,456
Heat risk 3/10 · Minor
- Hot days now (above 100°F)
- 7 days/yr
- Hot days in 30 yrs
- 15 days/yr
Wind risk 2/10 · Minimal
- Chance of severe wind over 30 yrs
- —
Air-quality risk 2/10 · Minimal
- Unhealthy air days now
- 1 days/yr
- Unhealthy air days in 30 yrs
- 2 days/yr
Risk factors via First Street. Map © Google.
Why this score? — see what drove the C+ grade
The composite is a weighted blend of 9 inputs, each scored 0–100. Each bar is that input's sub-score; the figure is the points it added to the 100-point composite (weight × sub-score).
- Cash flow +19.0/30.0
- ARV discount +15.0/15.0
- Schools +6.5/10.0
- DSCR +6.0/10.0
- 1% rule +5.3/10.0
- Livability +4.4/5.0
- Rent growth +2.8/5.0
- Condition / age +2.5/5.0
- Appreciation +0.0/10.0
$200,000
🖨 Deal sheet 📄 Offer letter ✓ Due diligence
Listing remarks MLS
Rare opportunity in Kensington Farms neighborhood, just a couple of blocks from Allen Elementary. Solid 3 bedroom, 1 bath classic ranch. The home has all of its original 1958 charm still intact and is ready for its new chapter. Detached garage needs a new roof, but seems structurally ok otherwise. Wonderful lot size is a bonus! This is a great opportunity to get into a fabulous neighborhood well below market value. The home is being sold as is and is exempt from seller's disclosure. BATVAI
Key facts
- Original 1958 charm
- Lot size
- Detached garage
Tags
Property features AI
Exterior
- Parking: Detached garage; 1.5 garage spaces
- Utilities: Public water; Natural gas water heater
- Home design: Ranch-style single family home; One story
- Construction: Built in 1958; Brick and wood siding exterior; Shingle roof
- Exterior features: Paved road access; Lot of approximately 0.17 acres
Interior
- Kitchen: Kitchen (9 x 8); Disposal
- Bedrooms: Primary bedroom (13 x 12); Bedroom 2 (9 x 10); Bedroom 3 (10 x 11)
- Bathrooms: 1 full bathroom (7 x 6)
- Heating & cooling: Forced air heating; Cooling present
- Interior features: 7 total rooms; Storm windows and window screens; Slab foundation basement
- Laundry & utility: Laundry room (8 x 10); Washer and dryer included
Neighborhood map
What this means for you Summary
Snapshot
- This is a 3-bed/1.0-bath single-family listed at $200k.
Deal economics
- At list price, monthly cash flow is $210 ($3k/yr) — positive.
- The deal already cash-flows at list — no discount required.
- Meets the 1% rule at list price ($2k rent vs $200k).
- Cap rate 7.6% vs local median 2.5% in Ann Arbor — top-decile yield for the area; either an underpriced asset or a hidden risk that comps aren't pricing in. Stress-test before assuming the spread holds.
Location & tenants
- Location reads 88/100 on livability (#10 in MI, #155 nationally) — a professional / high-income tenant draw. Strengths: schools A+, amenities A+, commute A+; Watch: cost of living D.
- Ann Arbor Public Schools (urban): math 71% / reading 81% proficiency, ranked #6 of 540 in MI (top 1%) — strong family-tenant draw, lease renewals of 3-5y typical.
- Market conditions: Rents rising (+1.3%/yr); 149 active listings in the ZIP; 14 comparable units currently listed for rent nearby; rentals at typical pace (median 21d on market — plan ~3-4 weeks tenant-placement turnaround); 43% of comp listings sitting > 30 days — soft ceiling on asking rent; 996 units permitted in Washtenaw County in 2024 (492 in 5+ unit buildings).
- This rent runs 39% of the median local income ($64k/yr) — at the standard rent-burdened threshold; future hikes will face affordability resistance.
Forward outlook
- Local home prices are declining (-3.0%/yr); year-one equity from $1k of loan paydown is wiped out by about $6k of value loss. Plan a longer hold.
- Washtenaw County population projected at +25% by 2050 — long-run rental-demand tailwind backs the buy-and-hold thesis.
Negotiation context
- Only 7 days on market — expect competitive offers; lowballing is unlikely to land.
- 3 sale attempts with the ask held roughly flat each time — persistent listings suggest the price (not the market) is what's stuck; bring a comps-based counter.
- Current owner paid $53k; list at $200k implies a 277% gain — meaningful room to come down on a strong offer.
Risks & watch-outs
- Watch-outs: built in 1958 — expect roof / HVAC / electrical / plumbing capex.
Questions for the listing agent
- Built in 1958 — when were the roof, HVAC, electrical panel, plumbing, and water heater last replaced?
- Is there a deadline driving the sale (1031 exchange, divorce, estate, relocation)? That informs how much negotiation room exists.
- Schools are A-rated — typically a magnet for longer-tenancy family renters. What's the average tenant stay here, and is there a school-zone premium baked into asking?
- What's the average days-on-market for RENTAL listings here right now (not sales)? A rising rental-DOM trend means longer vacancies and softer asking-rent achievability than the comps imply.
- What's the recent tenant-quality profile in this submarket — average credit score on applications, eviction rate, late-payment / NSF rate, and stable-employment percentage? A property-management company in the area should have these aggregated.
- How much new for-sale + rental construction is in the pipeline within 1–3 miles? Heavy new supply typically softens prices + rents 12–24 months out; constrained supply supports both.
Investment metrics
- 1% rule
- 1.03% ✓
- Cap rate
- 7.55%
- Cash-on-cash
- 4.50%
- DSCR
- 1.20
- GRM
- 8.1
CMA / ARV
- ARV (on-the-fly)
- $355,946
- Comps found
- 12
Show comp detail 12 sales within ~0.75 mi
| Address | Dist | Beds/Ba | Sqft | Sold | Price | $/sf | Match |
|---|---|---|---|---|---|---|---|
| 2711 Canterbury Rd | 0.09mi | 3/1.0 | 990 (+0%) | 4mo | $357,500 | $361 | 92 |
| 2731 Canterbury Rd | 0.07mi | 3/1.0 | 990 (+0%) | 6mo | $235,000 | $237 | 91 |
| 2831 Canterbury Rd | 0.13mi | 3/1.0 | 990 (+0%) | 6mo | $384,000 | $388 | 88 |
| 2529 Hampshire Rd | 0.16mi | 2/1.0 (-1) | 986 (0%) | 0mo | $332,000 | $337 | 87 |
| 3159 Edgewood Dr | 0.37mi | 3/1.0 | 960 (-3%) | 1mo | $362,260 | $377 | 78 |
| 2723 Radcliffe Ave | 0.24mi | 3/2.0 | 1,062 (+8%) | 3mo | $383,000 | $361 | 69 |
| 2753 Cumberland Ave | 0.06mi | 3/1.0 | 1,093 (+11%) | 12mo | $385,000 | $352 | 69 |
| 3195 Nordman Rd | 0.60mi | 3/1.0 | 988 (+0%) | 11mo | $320,000 | $324 | 62 |
| 2672 Maplewood Ave | 0.37mi | 3/1.0 | 901 (-9%) | 8mo | $349,000 | $387 | 62 |
| 3141 Mc Comb St | 0.55mi | 3/1.0 | 1,044 (+6%) | 3mo | $310,000 | $297 | 62 |
| 2562 Fernwood Ave | 0.52mi | 3/1.0 | 1,133 (+15%) | 8mo | $329,000 | $290 | 44 |
| 2650 Kimberley Rd | 0.65mi | 2/1.0 (-1) | 864 (-12%) | 2mo | $380,000 | $440 | 42 |
Match score weights: distance 35% · size 25% · config 20% · recency 20%. Top-matched comps best support the ARV.
Projected returns pro-forma
-3.0% appreciation · 1.28% rent growth · sell at horizon
- IRR
- -11.3%
- Equity multiple
- 0.60×
- Total profit
- $-22,497
- Equity at exit
- $29,821
- IRR
- -4.7%
- Equity multiple
- 0.71×
- Total profit
- $-16,064
- Equity at exit
- $17,292
Cash invested: $56,000 (down + closing). Projections, not guarantees.
Landlord ↔ Tenant lean methodology
- Overall (STATE)
- 62 Landlord-Friendly
- State Michigan
- 62 Landlord-Friendly · EVEN
- County
- — inherits STATE
- City
- — inherits STATE
ZIP-level market 48104
- Rents YoY
- 1.3%
- Active inventory
- 149
- Price-to-rent
- 8.1×
Monthly cashflow live
- Estimated rent
- $2,061 high interval (Pro) →
- Mortgage (P&I)
- −$1,049
- Tax from tax record
- −$286 /mo · $3,433/yr
- Insurance
- −$83
- HOA
- −$0
- Vacancy / Maint / Mgmt
- −$433
- Net cashflow
- $210
Break-even live
UW: 25.0% down · 7.5% · 30yr · 1.5% tax · 5.0% vac · 8.0% maint · 8.0% mgmt
Financing live
Cash to close
- Down payment
- $50,000
- Closing costs
- $6,000
- Reserves months
- —
- Total cash needed
- —
Loan-product check · same deal, 3 products live
Conventional
25% down · 7.5% · 30yr
- Down + closing
- —
- Monthly P&I
- —
- Monthly cashflow
- —
- DSCR
- —
- Eligible?
- —
Personal DTI + credit; lowest rate.
DSCR
20% down · 8.5% · 30yr
- Down + closing
- —
- Monthly P&I
- —
- Monthly cashflow
- —
- DSCR
- —
- Eligible?
- —
No personal income docs; deal must DSCR.
Hard money
10% down · 12.0% · 12mo
- Down + closing
- —
- Monthly P&I
- —
- Monthly cashflow
- —
- DSCR
- —
- Eligible?
- —
Short-term bridge; refi at stabilization.
Rent comps 14 comps
| Address | Beds | Baths | Sqft | Rent | $/sqft | DOM | Units | Dist |
|---|---|---|---|---|---|---|---|---|
| 2225 S Huron Pkwy #2 Ann Arbor, MI | 2.0 | 2.0 | 1053 | $2,100 | $1.99 | 43d | 1 | 0.49mi |
| 2221 S Huron Pkwy #4 Ann Arbor, MI | 2.0 | 2.0 | 1053 | $2,000 | $1.90 | 13d | 1 | 0.51mi |
| 2716 Packard St Ann Arbor, MI | 1.0–2.0 | 1.0 | 862 | $1,350 | $1.57 | 43d | 1 | 0.71mi |
| 2001 Huron Pkwy Ann Arbor, MI | 1.0–2.0 | 1.0 | 688 | $1,700 | $2.47 | 21d | 24 | 0.71mi |
| 2021 Medford Rd Ann Arbor, MI | 1.0–3.0 | 1.0–2.0 | 937 | $1,760 | $1.88 | 21d | 5 | 0.73mi |
| 2511 Packard St Ann Arbor, MI | 2.0–3.0 | 2.0 | 1200 | $2,539 | $2.12 | 13d | 7 | 0.82mi |
| 2315 Packard St Ann Arbor, MI | 2.0 | 1.0 | 848 | $1,500 | $1.77 | 13d | 1 | 1.02mi |
| 1533 Pine Valley Blvd Ann Arbor, MI | 1.0–2.0 | 1.0–1.5 | 827 | $1,725 | $2.09 | 43d | 1 | 1.02mi |
| 2315 Packard St Ann Arbor, MI | 2.0 | 1.0 | 869 | $1,500 | $1.73 | 43d | 2 | 1.03mi |
| 3032 Forest Creek Ct Ann Arbor, MI | 2.0 | 2.0 | 966 | $1,750 | $1.81 | 43d | 1 | 1.07mi |
| 2572 Carpenter Rd Ann Arbor, MI | 1.0–2.0 | 1.0 | 786 | $1,799 | $2.29 | 21d | 9 | 1.17mi |
| 2960 Birch Hollow Dr Ann Arbor, MI | 1.0–2.0 | 1.0 | 718 | $1,299 | $1.81 | 13d | 3 | 1.26mi |
| 3510 Pheasant Run Cir Ann Arbor, MI | 1.0–2.0 | 1.0 | 825 | $1,405 | $1.70 | 13d | 10 | 1.29mi |
| 3510 Pheasant Run Cir Ann Arbor, MI | 1.0–2.0 | 1.0 | 825 | $1,445 | $1.75 | 43d | 13 | 1.29mi |
Listing history 9 events
-
2026-06-03status $200,000 Pending 7 DOM
-
2026-06-02days on market $200,000 Active 7 DOM
-
2026-06-01days on market $200,000 Active 6 DOM
-
2026-05-31days on market $200,000 Active 5 DOM
-
2026-05-30days on market $200,000 Active 4 DOM
-
2026-05-26$200,000 Active 494-char remark
Show marketing remark (494 chars)
Rare opportunity in Kensington Farms neighborhood, just a couple of blocks from Allen Elementary. Solid 3 bedroom, 1 bath classic ranch. The home has all of its original 1958 charm still intact and is ready for its new chapter. Detached garage needs a new roof, but seems structurally ok otherwise. Wonderful lot size is a bonus! This is a great opportunity to get into a fabulous neighborhood well below market value. The home is being sold as is and is exempt from seller's disclosure. BATVAI
-
2026-05-26$200,000 Active
Show marketing remark (494 chars)
Rare opportunity in Kensington Farms neighborhood, just a couple of blocks from Allen Elementary. Solid 3 bedroom, 1 bath classic ranch. The home has all of its original 1958 charm still intact and is ready for its new chapter. Detached garage needs a new roof, but seems structurally ok otherwise. Wonderful lot size is a bonus! This is a great opportunity to get into a fabulous neighborhood well below market value. The home is being sold as is and is exempt from seller's disclosure. BATVAI
-
2026-05-26$200,000 Active 494-char remark
Show marketing remark (494 chars)
Rare opportunity in Kensington Farms neighborhood, just a couple of blocks from Allen Elementary. Solid 3 bedroom, 1 bath classic ranch. The home has all of its original 1958 charm still intact and is ready for its new chapter. Detached garage needs a new roof, but seems structurally ok otherwise. Wonderful lot size is a bonus! This is a great opportunity to get into a fabulous neighborhood well below market value. The home is being sold as is and is exempt from seller's disclosure. BATVAI
-
1987-01-01soldstatus $53,000
ⓘ Source: listings_history table (triggers on properties + properties_extension) + one-shot
backfill from property_details.listing_events for pre-trigger history.
Tax reassessment forecast MI · Partial reset (capped growth)
- Current annual tax
- $3,433 · $286/mo
- Projected year-2 tax
- $3,433 · $286/mo
- Expected delta
- $0/yr ($0/mo · -0.0%)
ⓘ Screening estimate from a state-policy table — verify with the county assessor before closing.
Climate risk First Street
- Flood 1/10 Low FEMA zone X (unshaded) · 0% chance over 30 yrs
- Wildfire 1/10 Low
- Heat 3/10 Moderate 7 d/yr ≥100°F today · 15 d/yr by 30 yrs out
- Wind 2/10 Low
- Air quality 2/10 Low 1 unhealthy d/yr today · 2 by 30 yrs out
Nearby sold comps map
Loading sold comps map…
Walkable amenities ~0.75 mi
Loading nearby amenities…
Taxation est. · year 1
- Rental income
- $24,730
- − Mortgage interest
- −$11,203
- − Property taxes
- −$3,433
- − Insurance
- −$1,000
- − Repairs & maintenance
- −$1,978
- − Management
- −$1,978
- − Depreciation
- −$5,818
- Taxable loss
- −$681
- Est. tax savings @ 24.0%
- +$163
- After-tax cash flow
- $2,682/yr
For passive investors: Depreciation is non-cash, so a rental often shows a tax loss while cash-flowing — sheltering income. Rental losses are passive: they offset passive income freely, and up to $25,000/yr can offset ordinary (W-2) income if you actively participate and your MAGI is under $100k (phasing out to $0 by $150k); unused losses carry forward. On sale, claimed depreciation is recaptured at up to 25%, and gains may owe capital-gains tax (a 1031 exchange can defer both). Figures are a year-1 estimate at your 24.0% rate — not tax advice; consult a CPA.
Schools (NCES district)
- District
- Ann Arbor Public Schools
- NCES district ID
- 2602820
- Math proficiency
- 71% ▲ 5.00%
- Reading proficiency
- 81% ▲ 11.00%
- Median HH income
- $60,768
- Composite
- 65.34/100
- National rank
- #487
- State rank
- #6 of 540 in MI
Livability — Ann Arbor
- Score
- 88/100
- State rank
- #10
- US rank
- #155
Category grades
Schools grade is shown separately in the Schools card above.
Census & demographics
- Census place
- Ann Arbor, MI
- County
- Washtenaw County · 306,860 people
- City population
- 163,747
- Metro
- Ann Arbor, MI
- Population (ZIP)
- 43,979
- Household income
- $64,231
- Rent vs Own
- Severe rent burden
- 5044.0
Population outlook (Washtenaw County) Hauer SSP2
- Today (2025)
- 402,878 people
- By 2030
- 424,104 · +5.3%
- By 2040
- 464,633 · +15.3%
- By 2050
- 504,728 · +25.3%
- By 2075
- 614,463 · +52.5%
- By 2100
- 676,181 · +67.8%
Race, ethnicity, and origin ACS 2023
- Neighborhood character
- Predominantly White (74%)
- Race & ethnicity
- White 74% Asian 12% Two or more races 6% Hispanic / Latino 5% Black 5%
- Common ancestry
- Romanian 7% Italian 3% Lithuanian 3%
- Foreign-born
- 13% · China, Canada, South Korea
- Languages at home
- 83% English-only · Chinese 4% Other Indo-European 3% Spanish 3%
Political lean MEDSL · Washtenaw
- 2024 margin
- Solid D (+44.4) · D 71.0% · R 26.6% · Other 2.4%
- 2008→2024 swing
- +3.5pp toward D · 2008: 41.0pp · 2024: 44.4pp
- All cycles
- 2024: D+44.4 2020: D+46.6 2016: D+41.5 2012: D+36.0 2008: D+41.0
Not yet ingested
- Civics
- —
Market trends
- HPI YoY
- ▼ -489.48%
- Current HPI
- 246.6752
- Rent YoY
- ▲ 1.28%
- Metro
- Ann Arbor, MI
- State GDP YoY
- ▲ 1.37%
- F500 in state
- 28
Industry mix (Fortune 500 HQ in MI)
| Industry | F500 HQs | Revenue |
|---|---|---|
| Automotive Parts | 3 | $48B |
|
||
| Automotive | 2 | $372B |
|
||
| Chemicals | 1 | $45B |
|
||
| Automotive Retail | 1 | $29B |
|
||
| Healthcare / Medical Devices | 1 | $23B |
|
||
| Automotive Technology | 1 | $20B |
|
||
Price history
+277.4% since first listed4 events — show timeline
- 2026-05-26 Listed $200,000 REALCOMP
- 2026-05-26 Listed $200,000 MiRealSource-MiMLS
- 2026-05-26 Listed $200,000 SW Michigan MLS
- 1987-01-01 Sold (Public Records) $53,000 Public Records
Property tax history
+2.4%/yrLatest (2025): $3,433 · -12.1% YoY. Source: county tax records.
Cash-flow waterfall
monthlySold comps — $/sqft
last 12 mo · ≤1 miLoading sold comps…