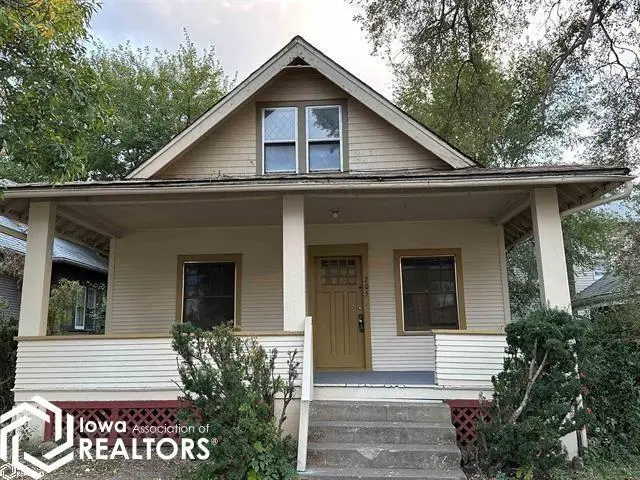
205 N 7th St · Keokuk, IA
Flood risk 9/10 · Severe
- FEMA flood zone
- X (shaded)
- Chance of flooding over 30 yrs
- 0.99%
- Est. flood insurance / yr
- $473 – $860
Fire risk 3/10 · Minor
- Est. fire insurance / yr
- $902 – $1,676
Heat risk 3/10 · Minor
- Hot days now (above 106°F)
- 7 days/yr
- Hot days in 30 yrs
- 16 days/yr
Wind risk 2/10 · Minimal
- Chance of severe wind over 30 yrs
- —
Air-quality risk 2/10 · Minimal
- Unhealthy air days now
- 0 days/yr
- Unhealthy air days in 30 yrs
- 1 days/yr
Risk factors via First Street. Map © Google.
Why this score? — see what drove the B+ grade
The composite is a weighted blend of 9 inputs, each scored 0–100. Each bar is that input's sub-score; the figure is the points it added to the 100-point composite (weight × sub-score).
- Cash flow +30.0/30.0
- ARV discount +15.0/15.0
- 1% rule +10.0/10.0
- DSCR +10.0/10.0
- Schools +4.2/10.0
- Livability +3.9/5.0
- Rent growth +2.5/5.0
- Condition / age +2.5/5.0
- Appreciation +0.0/10.0
$41,500
🖨 Deal sheet (PDF) 📄 Offer letter ✓ Due diligence
Listing remarks
This two story home is nestled just two blocks from Main Street for easy shopping convenience. New heating system in 2019. One bedroom on main floor two bedrooms upstairs. Bathroom on each floor. Large living room and formal dining room or more living room space off kitchen. Stove and refrigerator stay. Great investment opportunity as a rental! Call your favorite agent today for a tour!
Key facts
- Formal dining room
- Large living room
- New heating system
Tags
Property features AI
Exterior
- Parking: On-street parking
- Utilities: Public sewer
- Home design: Two-story single-family residence; Residential property
- Construction: Wood siding construction
- Exterior features: Wood siding
Interior
- Bathrooms: 2 full bathrooms
- Heating & cooling: Gravity heating; No central cooling
- Interior features: Basement present; Gravity heating system
Neighborhood map
What this means for you Summary
Snapshot
- This is a 2-bed/1.0-bath single-family listed at $42k.
Deal economics
- At list price, monthly cash flow is $220 ($3k/yr) — positive.
- The deal already cash-flows at list — no discount required.
- Meets the 1% rule at list price ($765 rent vs $42k).
- Recommended offer: $41k (1.5% below list) — sets the bar for market timing.
- Cap rate 14.3% vs local median 8.2% in Keokuk — top-decile yield for the area; either an underpriced asset or a hidden risk that comps aren't pricing in. Stress-test before assuming the spread holds.
Location & tenants
- Location reads 77/100 on livability (#166 in IA, #3,002 nationally) — a middle-class / working-renter tenant base. Strengths: cost of living A+, housing A+, health & safety A+; Watch: amenities C-, commute F, employment F.
- Keokuk Community School District (town): math 48% / reading 54% proficiency, ranked #282 of 289 in IA (top 98%) — acceptable for families but not a draw, mixed tenant base, ~2y average lease.
- Market conditions: 74 active listings in the ZIP; 2 comparable units currently listed for rent nearby; 15 units permitted in Lee County in 2024 (0 in 5+ unit buildings).
Forward outlook
- Local home prices are declining (-3.0%/yr); year-one equity from $287 of loan paydown is wiped out by about $1k of value loss. Plan a longer hold.
- Lee County population projected at -15% by 2050 — secular population decline; favor cash flow + early exit over multi-decade hold.
- At projected returns (-3.0% appreciation + 3.0% rent growth), your $12k cash investment doubles in ~6 years — after that, you're playing with house money.
Negotiation context
- It's been on market 25 days — a 2% lower offer ($41k) is reasonable based on typical stale-listing flexibility.
- 2 sale attempts since 3y ago; this cycle's ask has dropped $2k (5%) from the opening price — seller is motivated, your offer sets the floor, not the list.
Risks & watch-outs
- Watch-outs: property tax is 2.7% of price; flood insurance adds $56/mo; built in 1910 — expect roof / HVAC / electrical / plumbing capex.
- Climate carrying-cost: severe flood risk — expect insurance premiums to compound above CPI over the hold.
Questions for the listing agent
- Built in 1910 — when were the roof, HVAC, electrical panel, plumbing, and water heater last replaced?
- Property tax is high relative to price — has the assessment been appealed recently, and will the sale trigger a re-assessment?
- What's the actual annual flood-insurance premium (NFIP or private), and is the property in a SFHA with mandatory coverage?
- Is there a deadline driving the sale (1031 exchange, divorce, estate, relocation)? That informs how much negotiation room exists.
- What's the average days-on-market for RENTAL listings here right now (not sales)? A rising rental-DOM trend means longer vacancies and softer asking-rent achievability than the comps imply.
- What's the recent tenant-quality profile in this submarket — average credit score on applications, eviction rate, late-payment / NSF rate, and stable-employment percentage? A property-management company in the area should have these aggregated.
- How much new for-sale + rental construction is in the pipeline within 1–3 miles? Heavy new supply typically softens prices + rents 12–24 months out; constrained supply supports both.
Investment metrics
- 1% rule
- 1.84% ✓
- Cap rate
- 14.26%
- Cash-on-cash
- 28.46%
- DSCR
- 2.27
- GRM
- 4.5
CMA / ARV
- ARV (on-the-fly)
- $55,980
- Comps found
- 12
Show comp detail 12 sales within ~0.75 mi
| Address | Dist | Beds/Ba | Sqft | Sold | Price | $/sf | Match |
|---|---|---|---|---|---|---|---|
| 617 Concert St | 0.02mi | 1/1.0 (-1) | 1,248 (+0%) | 13mo | $35,000 | $28 | 83 |
| 116 S 9th St | 0.32mi | 2/2.5 | 1,332 (+7%) | 3mo | $20,000 | $15 | 65 |
| 18 N 1st St St | 0.41mi | 2/1.0 | 1,335 (+7%) | 6mo | $60,000 | $45 | 64 |
| 1000 Franklin St | 0.33mi | 2/1.5 | 1,338 (+8%) | 8mo | $12,500 | $9 | 63 |
| 508 N 9th St | 0.26mi | 2/2.0 | 1,112 (-11%) | 4mo | $88,000 | $79 | 62 |
| 1025 Leighton St | 0.49mi | 2/1.0 | 1,124 (-10%) | 7mo | $105,500 | $94 | 55 |
| 1218 Fulton St | 0.44mi | 2/2.0 | 1,084 (-13%) | 4mo | $8,000 | $7 | 51 |
| 1027 Exchange St | 0.40mi | 2/1.0 | 1,070 (-14%) | 12mo | $83,000 | $78 | 47 |
| 911 N 13th St | 0.65mi | 3/1.5 (+1) | 1,331 (+7%) | 5mo | $84,500 | $63 | 47 |
| 1307 Timea St | 0.63mi | 3/1.0 (+1) | 1,126 (-10%) | 5mo | $6,000 | $5 | 46 |
| 1528 Franklin St | 0.67mi | 3/1.5 (+1) | 1,140 (-8%) | 4mo | $131,000 | $115 | 45 |
| 1620 Johnson St | 0.73mi | 2/1.0 | 1,082 (-13%) | 1mo | $20,000 | $18 | 44 |
Match score weights: distance 35% · size 25% · config 20% · recency 20%. Top-matched comps best support the ARV.
Projected returns pro-forma
-3.0% appreciation · 3.0% rent growth · sell at horizon
- IRR
- 15.7%
- Equity multiple
- 1.63×
- Total profit
- $7,363
- Equity at exit
- $6,188
- IRR
- 24.5%
- Equity multiple
- 3.13×
- Total profit
- $24,750
- Equity at exit
- $3,588
Cash invested: $11,620 (down + closing). Projections, not guarantees.
Landlord ↔ Tenant lean methodology
- Overall (STATE)
- 83 Strongly Landlord-Friendly
- State Iowa
- 83 Strongly Landlord-Friendly · R+6
- County
- — inherits STATE
- City
- — inherits STATE
ZIP-level market 52632
- Home prices YoY
- -25.5%
- Active inventory
- 74
- Price-to-rent
- 4.5×
Monthly cashflow live
- Estimated rent
- $765 medium interval (Pro) →
- Mortgage (P&I)
- −$218
- Tax from tax record
- −$94 /mo · $1,130/yr
- Insurance
- −$17
- Flood insurance flood zone
- −$56 /mo · $666/yr
- HOA
- −$0
- Vacancy / Maint / Mgmt
- −$161
- Net cashflow
- $220
Break-even live
Sensitivity live
| Price | -10% $244 | -5% $232 | +0% $220 | +5% $208 | +10% $197 |
|---|---|---|---|---|---|
| Rent | -10% $160 | -5% $190 | +0% $220 | +5% $250 | +10% $281 |
| Rate | -1.0pp $241 | -0.5pp $231 | base $220 | +0.5pp $209 | +1.0pp $198 |
UW: 25.0% down · 7.5% · 30yr · 1.5% tax · 5.0% vac · 8.0% maint · 8.0% mgmt
Financing live
Cash to close
- Down payment
- $10,375
- Closing costs
- $1,245
- Reserves months
- —
- Total cash needed
- —
Loan-product check · same deal, 3 products live
Conventional
25% down · 7.5% · 30yr
- Down + closing
- —
- Monthly P&I
- —
- Monthly cashflow
- —
- DSCR
- —
- Eligible?
- —
Personal DTI + credit; lowest rate.
DSCR
20% down · 8.5% · 30yr
- Down + closing
- —
- Monthly P&I
- —
- Monthly cashflow
- —
- DSCR
- —
- Eligible?
- —
No personal income docs; deal must DSCR.
Hard money
10% down · 12.0% · 12mo
- Down + closing
- —
- Monthly P&I
- —
- Monthly cashflow
- —
- DSCR
- —
- Eligible?
- —
Short-term bridge; refi at stabilization.
Rent comps 2 comps
| Address | Beds | Baths | Sqft | Rent | $/sqft | DOM | Units | Dist |
|---|---|---|---|---|---|---|---|---|
| 1 Richards Dr Unit 1-8 Keokuk, IA | 2.0 | 1.0 | 725 | $795 | $1.10 | 45d | 1 | 0.94mi |
| 212 Washington St Keokuk, IA | 1.0–2.0 | 1.0 | 632 | $715 | $1.13 | 45d | 1 | 1.40mi |
Listing history 20 events
-
2026-06-21days on market $41,500 Active 25 DOM
-
2026-06-21days on market $41,500 Active 24 DOM
-
2026-06-18days on market $41,500 Active 22 DOM
-
2026-06-17days on market $41,500 Active 21 DOM
-
2026-06-16days on market $41,500 Active 20 DOM
-
2026-06-15days on market $41,500 Active 19 DOM
-
2026-06-13pricedays on market $41,500 Active 17 DOM
-
2026-06-12days on market $43,900 Active 16 DOM
-
2026-06-09days on market $43,900 Active 13 DOM
-
2026-06-08days on market $43,900 Active 12 DOM
-
2026-06-07days on market $43,900 Active 11 DOM
-
2026-06-07days on market $43,900 Active 10 DOM
-
2026-06-04days on market $43,900 Active 7 DOM
-
2026-06-02days on market $43,900 Active 6 DOM
-
2026-06-01days on market $43,900 Active 5 DOM
-
2026-05-31days on market $43,900 Active 4 DOM
-
2026-05-31days on market $43,900 Active 3 DOM
-
2026-05-28$43,900 Active
-
2023-11-01price $55,000
-
2023-10-05$59,000 Active
ⓘ Source: listings_history table (triggers on properties + properties_extension) + one-shot
backfill from property_details.listing_events for pre-trigger history.
Tax reassessment forecast IA · Partial reset (capped growth)
- Current annual tax
- $1,130 · $94/mo
- Projected year-2 tax
- $1,130 · $94/mo
- Expected delta
- $0/yr ($0/mo · 0.0%)
ⓘ Screening estimate from a state-policy table — verify with the county assessor before closing.
Climate risk First Street
- Flood 9/10 Extreme FEMA zone X (shaded) · 99% chance over 30 yrs
- Wildfire 3/10 Moderate
- Heat 3/10 Moderate 7 d/yr ≥106°F today · 16 d/yr by 30 yrs out
- Wind 2/10 Low
- Air quality 2/10 Low 0 unhealthy d/yr today · 1 by 30 yrs out
Nearby sold comps map
Loading sold comps map…
Walkable amenities ~0.75 mi
Loading nearby amenities…
Taxation est. · year 1
- Rental income
- $9,185
- − Mortgage interest
- −$2,325
- − Property taxes
- −$1,130
- − Insurance
- −$874
- − Repairs & maintenance
- −$735
- − Management
- −$735
- − Depreciation
- −$1,207
- Taxable income
- $2,180
- Est. tax owed @ 24.0%
- −$523
- After-tax cash flow
- $2,118/yr
For passive investors: Depreciation is non-cash, so a rental often shows a tax loss while cash-flowing — sheltering income. Rental losses are passive: they offset passive income freely, and up to $25,000/yr can offset ordinary (W-2) income if you actively participate and your MAGI is under $100k (phasing out to $0 by $150k); unused losses carry forward. On sale, claimed depreciation is recaptured at up to 25%, and gains may owe capital-gains tax (a 1031 exchange can defer both). Figures are a year-1 estimate at your 24.0% rate — not tax advice; consult a CPA.
Schools (NCES district)
- District
- Keokuk Community School District
- NCES district ID
- 1915630
- Math proficiency
- 48% ▼ -9.00%
- Reading proficiency
- 54% ▼ -2.00%
- Median HH income
- $36,973
- Composite
- 42.35/100
- National rank
- #3249
- State rank
- #282 of 289 in IA
Livability — Keokuk
- Score
- 77/100
- State rank
- #166
- US rank
- #3002
Category grades
Schools grade is shown separately in the Schools card above.
Census & demographics
- Census place
- Keokuk, IA
- Population (ZIP)
- 11,904
Population outlook (Lee County) Hauer SSP2
- Today (2025)
- 33,813 people
- By 2030
- 32,835 · -2.9%
- By 2040
- 30,690 · -9.2%
- By 2050
- 28,777 · -14.9%
- By 2075
- 25,568 · -24.4%
- By 2100
- 21,983 · -35.0%
Race, ethnicity, and origin ACS 2023
- Neighborhood character
- Predominantly White (91%)
- Race & ethnicity
- White 91% Two or more races 6% Hispanic / Latino 3% Black 3%
- Common ancestry
- Portuguese 3% Italian 2% Lithuanian 2%
- Foreign-born
- 1%
- Languages at home
- 99% English-only · Spanish 1%
Political lean MEDSL · Lee
- 2024 margin
- Strong R (+27.8) · D 35.0% · R 62.9% · Other 2.1%
- 2008→2024 swing
- -43.8pp toward R · 2008: 16.0pp · 2024: -27.8pp
- All cycles
- 2024: R+27.8 2020: R+19.3 2016: R+16.1 2012: D+16.0 2008: D+16.0
Not yet ingested
- Civics
- —
Market trends
- HPI YoY
- ▼ -41.80%
- Current HPI
- 122.2866
- Rent YoY
- —
- Metro
- —
- State GDP YoY
- ▲ 2.48%
- F500 in state
- 4
Industry mix (Fortune 500 HQ in IA)
| Industry | F500 HQs | Revenue |
|---|---|---|
| Financial Services | 1 | $16B |
|
||
| Retail / Convenience | 1 | $15B |
|
||
Price history
-25.6% since first listed3 events — show timeline
- 2026-05-28 Listed $43,900 IAR
- 2023-11-01 Price Changed $55,000 IAR
- 2023-10-05 Listed $59,000 IAR
Property tax history
+3.3%/yrLatest (2025): $1,130 · +5.2% YoY. Source: county tax records.
Cash-flow waterfall
monthlySold comps — $/sqft
last 12 mo · ≤1 miLoading sold comps…