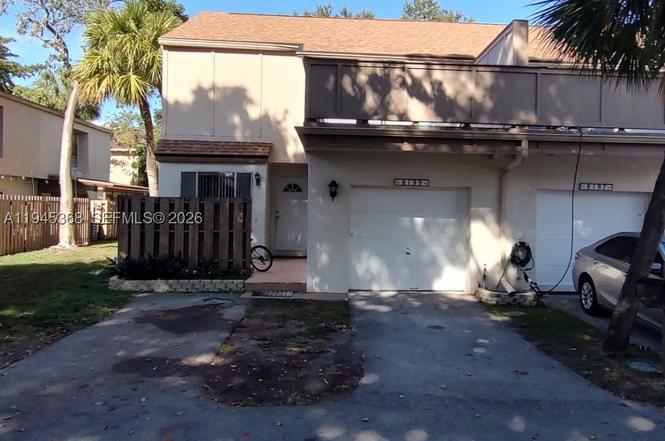
8199 NW 8th Mnr #1 · Plantation, FL
Flood risk 1/10 · Minimal
- FEMA flood zone
- X (shaded)
- Chance of flooding over 30 yrs
- 0.0%
- Est. flood insurance / yr
- $507 – $1,088
Fire risk 1/10 · Minimal
- Est. fire insurance / yr
- $947 – $1,759
Heat risk 10/10 · Severe
- Hot days now (above 105°F)
- 7 days/yr
- Hot days in 30 yrs
- 28 days/yr
Wind risk 10/10 · Severe
- Chance of severe wind over 30 yrs
- 99.0%
Air-quality risk 3/10 · Minor
- Unhealthy air days now
- 2 days/yr
- Unhealthy air days in 30 yrs
- 3 days/yr
Risk factors via First Street. Map © Google.
Why this score? — see what drove the D grade
The composite is a weighted blend of 9 inputs, each scored 0–100. Each bar is that input's sub-score; the figure is the points it added to the 100-point composite (weight × sub-score).
- Cash flow +11.9/30.0
- ARV discount +7.5/15.0
- 1% rule +7.3/10.0
- Schools +4.1/10.0
- Livability +4.1/5.0
- DSCR +3.5/10.0
- Rent growth +2.8/5.0
- Condition / age +2.5/5.0
- Appreciation +0.0/10.0
$260,000
🖨 Deal sheet (PDF) 📄 Offer letter ✓ Due diligence
Listing remarks
NEW ROOF! Spacious 3-bedroom, 2.5-bath townhouse in the heart of Plantation, with the option for a 4th room in the garage. All bedrooms are located upstairs and feature large closets. The primary suite offers a walk-in closet, full bathroom, and a private balcony. Enjoy multiple outdoor living spaces including a fenced back patio, open front patio, and balcony. The home also includes a dedicated laundry closet, garage, and a fenced patio ideal for relaxing or entertaining. Conveniently located just minutes from shopping, dining, and major highways. Community amenities include two swimming pools, a tennis court, and a playground. current rental $3447/M till Dec 31,2026
Key facts
- Private balcony
- Community amenities
- Open front patio
Tags
Property features AI
Finance
- Financial info: Lease considered; Pets allowed with conditions and possible restrictions
- HOA & community: Monthly association fee of $800; Association covers common areas, grounds maintenance, structure maintenance, pool(s) and roof; Community amenities include clubhouse, barbecue, picnic area, pool, tennis courts and trails
Exterior
- Parking: Garage (1 space); Two or more parking spaces total; 1 covered parking space
- Home design: Block construction; 2 stories; Resale property; Entry level: 1
- Construction: Block construction
- Exterior features: Association pool
Interior
- Kitchen: Dryer; Dishwasher; Electric range; Disposal; Microwave; Refrigerator; Washer
- Flooring: Hardwood; Tile; Vinyl; Wood
- Bathrooms: 2 full bathrooms; 1 half bathroom
- Heating & cooling: Central heating (electric); Central air (electric)
- Interior features: First-floor entry; Other interior features
Neighborhood map
What this means for you Summary
Snapshot
- This is a 3-bed/3.0-bath condo listed at $260k.
Deal economics
- At list price, monthly cash flow is $-67 ($-810/yr) — negative.
- To cash-flow at today's rent, offer at most $248k (4.6% below list).
- Meets the 1% rule at list price ($3k rent vs $260k).
- Recommended offer: $229k (12.0% below list) — sets the bar for market timing.
- Cap rate 6.0% vs local median 3.4% in Plantation — top-decile yield for the area; either an underpriced asset or a hidden risk that comps aren't pricing in. Stress-test before assuming the spread holds.
Location & tenants
- Location reads 82/100 on livability (#70 in FL, #1,174 nationally) — a professional / high-income tenant draw. Strengths: commute A+, housing A+, health & safety A+; Watch: amenities C-, cost of living D-.
- Broward (suburban): math 42% / reading 53% proficiency, ranked #46 of 73 in FL (top 63%) — families likely to look elsewhere, expect single-tenant / working-renter base with shorter leases.
- Market conditions: Rents rising (+1.2%/yr); 408 active listings in the ZIP; 40 comparable units currently listed for rent nearby; rentals at typical pace (median 22d on market — plan ~3-4 weeks tenant-placement turnaround); solid renter incomes; 2,111 units permitted in Broward County in 2024 (1,265 in 5+ unit buildings).
- At $3,192/mo this rent would consume 45% of the median local household income ($85k/yr) (locally 2923% of renters already pay >50% of income on rent) — very limited rent-growth headroom before tenants either downsize or default.
Forward outlook
- Local home prices are declining (-3.0%/yr); year-one equity from $2k of loan paydown is wiped out by about $8k of value loss. Plan a longer hold.
- Broward County population projected at +34% by 2050 — long-run rental-demand tailwind backs the buy-and-hold thesis.
Negotiation context
- It's been on market 158 days — a 12% lower offer ($229k) is reasonable based on typical stale-listing flexibility.
- Current owner paid $66k; list at $260k implies a 296% gain — meaningful room to come down on a strong offer.
Risks & watch-outs
- Watch-outs: HOA is 25% of rent.
- Climate carrying-cost: severe wind risk, 99% chance of damaging wind over 30y; extreme-heat days projected 7→28/yr by 2055 (HVAC capex compounding) — expect insurance premiums to compound above CPI over the hold.
Questions for the listing agent
- What do current leases actually rent for vs. the listed asking? Can we see a recent rent roll and the last 12 months of T-12 income?
- It's been on market 158 days. Have you received any prior offers? Is the seller open to a 12% concession, seller financing, or rate buy-down credit?
- What does the HOA fee cover, when was the last increase, and are there any pending special assessments or reserve-fund shortfalls?
- Any open or pending special assessments — roof, HVAC, plumbing, elevator, façade? What's the per-unit balance and payoff schedule, and is the seller paying it off at close or rolling it to the buyer?
- Why hasn't it sold? Are there any deal-killer items the seller is aware of (foundation, flood, title, zoning, code violations)?
- Is there a deadline driving the sale (1031 exchange, divorce, estate, relocation)? That informs how much negotiation room exists.
- Schools are B-rated — typically a magnet for longer-tenancy family renters. What's the average tenant stay here, and is there a school-zone premium baked into asking?
- The area grade is low — what's the realistic commute time and amenity access for the typical tenant pool here? Any planned neighborhood developments (good or bad) we should know about?
- What's the average days-on-market for RENTAL listings here right now (not sales)? A rising rental-DOM trend means longer vacancies and softer asking-rent achievability than the comps imply.
- What's the recent tenant-quality profile in this submarket — average credit score on applications, eviction rate, late-payment / NSF rate, and stable-employment percentage? A property-management company in the area should have these aggregated.
- How much new apartment / multifamily construction is in the pipeline within 1–3 miles? Heavy new supply (>2% of stock underway) typically softens rents 12–24 months out; light construction supports rent growth.
Investment metrics
- 1% rule
- 1.23% ✓
- Cap rate
- 5.98%
- Cash-on-cash
- -1.11%
- DSCR
- 0.95
- GRM
- 6.8
CMA / ARV
No comps found within radius.
Projected returns pro-forma
-3.0% appreciation · 1.23% rent growth · sell at horizon
- IRR
- -20.8%
- Equity multiple
- 0.29×
- Total profit
- $-51,481
- Equity at exit
- $38,767
- IRR
- -20.7%
- Equity multiple
- 0.03×
- Total profit
- $-70,314
- Equity at exit
- $22,480
Cash invested: $72,800 (down + closing). Projections, not guarantees.
Landlord ↔ Tenant lean methodology
- Overall (STATE)
- 87 Strongly Landlord-Friendly
- State Florida
- 87 Strongly Landlord-Friendly · R+3
- County
- — inherits STATE
- City
- — inherits STATE
ZIP-level market 33324
- Home prices YoY
- -33.5%
- Rents YoY
- 1.2%
- Active inventory
- 408
- Price-to-rent
- 6.8×
Monthly cashflow live
- Estimated rent
- $3,192 high interval (Pro) →
- Mortgage (P&I)
- −$1,363
- Tax from tax record
- −$318 /mo · $3,811/yr
- Insurance
- −$108
- HOA
- −$800
- Vacancy / Maint / Mgmt
- −$670
- Net cashflow
- $-67
Break-even live
Sensitivity live
| Price | -10% $80 | -5% $6 | +0% $-67 | +5% $-141 | +10% $-215 |
|---|---|---|---|---|---|
| Rent | -10% $-320 | -5% $-194 | +0% $-67 | +5% $59 | +10% $185 |
| Rate | -1.0pp $63 | -0.5pp $-1 | base $-67 | +0.5pp $-135 | +1.0pp $-203 |
UW: 25.0% down · 7.5% · 30yr · 1.5% tax · 5.0% vac · 8.0% maint · 8.0% mgmt
Financing live
Cash to close
- Down payment
- $65,000
- Closing costs
- $7,800
- Reserves months
- —
- Total cash needed
- —
Loan-product check · same deal, 3 products live
Conventional
25% down · 7.5% · 30yr
- Down + closing
- —
- Monthly P&I
- —
- Monthly cashflow
- —
- DSCR
- —
- Eligible?
- —
Personal DTI + credit; lowest rate.
DSCR
20% down · 8.5% · 30yr
- Down + closing
- —
- Monthly P&I
- —
- Monthly cashflow
- —
- DSCR
- —
- Eligible?
- —
No personal income docs; deal must DSCR.
Hard money
10% down · 12.0% · 12mo
- Down + closing
- —
- Monthly P&I
- —
- Monthly cashflow
- —
- DSCR
- —
- Eligible?
- —
Short-term bridge; refi at stabilization.
Rent comps 40 comps
| Address | Beds | Baths | Sqft | Rent | $/sqft | DOM | Units | Dist |
|---|---|---|---|---|---|---|---|---|
| 8231 NW 8th Pl #3 Plantation, FL | 3.0 | 2.5 | 1654 | $2,850 | $1.72 | 15d | 1 | 0.05mi |
| 8231 NW 8th Pl #3 Plantation, FL | 3.0 | 2.5 | 1770 | $2,850 | $1.61 | 25d | 1 | 0.05mi |
| 8208 NW 8th Pl Plantation, FL | 3.0 | 2.5 | 1770 | $2,950 | $1.67 | 19d | 1 | 0.06mi |
| 8244 NW 9th St #5 Plantation, FL | 4.0 | 2.5 | 2020 | $3,150 | $1.56 | 25d | 1 | 0.08mi |
| 835 NW 81st Way #5 Plantation, FL | 3.0 | 2.5 | 1770 | $2,600 | $1.47 | 9d | 1 | 0.09mi |
| 8244 NW 9th Ct #8 Fort Lauderdale, FL | 4.0 | 2.5 | 2080 | $3,500 | $1.68 | 25d | 1 | 0.09mi |
| 8253 NW 9th St #3 Plantation, FL | 3.0 | 2.5 | 1770 | $2,800 | $1.58 | 9d | 1 | 0.11mi |
| 833 NW 81st Ter #8 Plantation, FL | 4.0 | 2.5 | 1770 | $2,900 | $1.64 | 22d | 1 | 0.11mi |
| 843 NW 81st Ave #7 Plantation, FL | 3.0 | 2.5 | 1770 | $2,980 | $1.68 | 9d | 1 | 0.14mi |
| 843 NW 81st Ave #7 Plantation, FL | 3.0 | 2.5 | 1770 | $2,980 | $1.68 | 0d | 1 | 0.14mi |
| 833 NW 81st Ave Plantation, FL | 4.0 | 2.5 | 1770 | $3,250 | $1.84 | 15d | 1 | 0.15mi |
| 833 NW 81st Ave #4 Plantation, FL | 4.0 | 2.5 | 1770 | $3,250 | $1.84 | 23d | 1 | 0.15mi |
| 833 NW 81st Ave #4 Plantation, FL | 3.0 | 2.5 | 1770 | $3,600 | $2.03 | 20d | 1 | 0.15mi |
| 8344 NW 7th Pl Unit 8344 Plantation, FL | 3.0 | 2.5 | 1627 | $4,199 | $2.58 | 25d | 1 | 0.19mi |
| 8000 Cleary Blvd Plantation, FL | 2.0–3.0 | 2.0–3.0 | 1357 | $3,292 | $2.43 | 0d | 21 | 0.30mi |
| 962 NW 79th Ter Plantation, FL | 2.0 | 2.0 | 1432 | $2,997 | $2.09 | 25d | 1 | 0.39mi |
| 1114 NW 79th Dr Plantation, FL | 3.0 | 2.5 | 1624 | $3,000 | $1.85 | 9d | 1 | 0.41mi |
| 576 Westree Ln Plantation, FL | 3.0 | 2.5 | 1651 | $3,250 | $1.97 | 25d | 1 | 0.44mi |
| 568 N University Dr #568 Plantation, FL | 3.0 | 2.5 | 1589 | $3,250 | $2.05 | 9d | 1 | 0.47mi |
| 568 N University Dr #568 Plantation, FL | 3.0 | 2.5 | 1589 | $3,500 | $2.20 | 23d | 1 | 0.47mi |
| 537 N University Dr #71 Plantation, FL | 3.0 | 2.5 | 1830 | $3,000 | $1.64 | 6d | 1 | 0.48mi |
| 537 N University Dr #71 Plantation, FL | 3.0 | 2.5 | 1830 | $3,250 | $1.78 | 25d | 1 | 0.48mi |
| 510 NW 84th Ave Plantation, FL | 1.0–3.0 | 1.0–2.0 | 1124 | $3,600 | $3.20 | 0d | 6 | 0.51mi |
| 510 NW 84th Ave Plantation, FL | 2.0–3.0 | 2.0 | 1303 | $3,200 | $2.46 | 16d | 5 | 0.51mi |
| 510 NW 84th Ave Plantation, FL | 1.0–3.0 | 1.0–2.0 | 1137 | $3,600 | $3.17 | 12d | 7 | 0.51mi |
| 510 NW 84th Ave Plantation, FL | 1.0–3.0 | 1.0–2.0 | 1124 | $3,200 | $2.85 | 18d | 6 | 0.51mi |
| 9161 Vineyard Lake Dr Unit 9161 Plantation, FL | 3.0 | 2.5 | 1765 | $4,000 | $2.27 | 25d | 1 | 0.51mi |
| 1125 NW 78th Ave Plantation, FL | 4.0 | 2.5 | 2364 | $3,500 | $1.48 | 25d | 1 | 0.53mi |
| 9023 Vineyard Lake Dr Plantation, FL | 3.0 | 2.5 | 1739 | $3,500 | $2.01 | 9d | 1 | 0.58mi |
| 9023 Vineyard Lake Dr Plantation, FL | 3.0 | 2.5 | 1739 | $3,500 | $2.01 | 2d | 1 | 0.58mi |
| 9087 Vineyard Lake Dr Plantation, FL | 3.0 | 2.5 | 1590 | $3,350 | $2.11 | 25d | 1 | 0.65mi |
| 7738 NW 5th St Unit 7746 Plantation, FL | 4.0 | 3.5 | 3000 | $3,500 | $1.17 | 25d | 1 | 0.70mi |
| 845 NW 91st Ter Unit 845 Plantation, FL | 3.0 | 2.5 | 1515 | $3,500 | $2.31 | 25d | 1 | 0.72mi |
| 333 N University Dr Plantation, FL | 3.0 | 1.0–2.0 | 1065 | $4,283 | $4.02 | 0d | 15 | 0.74mi |
| 992 NW 93rd Ave Plantation, FL | 3.0 | 2.0 | 1504 | $3,350 | $2.23 | 25d | 1 | 0.77mi |
| 301 NW 78th Ave Plantation, FL | 3.0 | 2.0 | 1403 | $3,950 | $2.82 | 25d | 1 | 0.78mi |
| 9090 NW 11th Ct Plantation, FL | 3.0 | 2.0 | 2112 | $5,000 | $2.37 | 22d | 1 | 0.78mi |
| 1230 NW 74th Ave Unit 1230 Plantation, FL | 4.0 | 2.0 | 1774 | $4,550 | $2.56 | 25d | 1 | 0.96mi |
| 7421-7425 NW 15th St Unit 2 Plantation, FL | 3.0 | 2.0 | 1750 | $3,100 | $1.77 | 25d | 1 | 1.00mi |
| 9581 NW 9th Ct Plantation, FL | 4.0 | 2.5 | 2005 | $5,400 | $2.69 | 25d | 1 | 1.02mi |
HOA detail condo
- Monthly dues
- $800 · $9,600/yr
- Likely covers
- pool
- Assessments
- None detected in remarks — confirm with the listing agent.
Listing history 15 events
-
2026-06-21days on market $260,000 Active 158 DOM
-
2026-06-18days on market $260,000 Active 155 DOM
-
2026-06-17days on market $260,000 Active 154 DOM
-
2026-06-16days on market $260,000 Active 153 DOM
-
2026-06-15days on market $260,000 Active 152 DOM
-
2026-06-13days on market $260,000 Active 150 DOM
-
2026-06-09days on market $260,000 Active 146 DOM
-
2026-06-07days on market $260,000 Active 144 DOM
-
2026-06-04days on market $260,000 Active 141 DOM
-
2026-06-03days on market $260,000 Active 140 DOM
-
2026-06-02days on market $260,000 Active 139 DOM
-
2026-06-01days on market $260,000 Active 138 DOM
-
2026-05-31days on market $260,000 Active 137 DOM
-
2026-01-14$260,000 Active
-
1979-04-01soldstatus $65,700
ⓘ Source: listings_history table (triggers on properties + properties_extension) + one-shot
backfill from property_details.listing_events for pre-trigger history.
Tax reassessment forecast FL · Resets to sale price
- Current annual tax
- $3,811 · $318/mo
- Projected year-2 tax
- $3,811 · $318/mo
- Expected delta
- $0/yr ($0/mo · 0.0%)
ⓘ Screening estimate from a state-policy table — verify with the county assessor before closing.
Climate risk First Street
- Flood 1/10 Low FEMA zone X (shaded) · 0% chance over 30 yrs
- Wildfire 1/10 Low
- Heat 10/10 Extreme 7 d/yr ≥105°F today · 28 d/yr by 30 yrs out
- Wind 10/10 Extreme 99% chance of damaging wind over 30 yrs
- Air quality 3/10 Moderate 2 unhealthy d/yr today · 3 by 30 yrs out
Nearby sold comps map
Loading sold comps map…
Walkable amenities ~0.75 mi
Loading nearby amenities…
Taxation est. · year 1
- Rental income
- $38,307
- − Mortgage interest
- −$14,564
- − Property taxes
- −$3,811
- − Insurance
- −$1,300
- − Repairs & maintenance
- −$3,065
- − Management
- −$3,065
- − HOA
- −$9,600
- − Depreciation
- −$7,564
- Taxable loss
- −$4,661
- Est. tax savings @ 24.0%
- +$1,119
- After-tax cash flow
- $309/yr
For passive investors: Depreciation is non-cash, so a rental often shows a tax loss while cash-flowing — sheltering income. Rental losses are passive: they offset passive income freely, and up to $25,000/yr can offset ordinary (W-2) income if you actively participate and your MAGI is under $100k (phasing out to $0 by $150k); unused losses carry forward. On sale, claimed depreciation is recaptured at up to 25%, and gains may owe capital-gains tax (a 1031 exchange can defer both). Figures are a year-1 estimate at your 24.0% rate — not tax advice; consult a CPA.
Schools (NCES district)
- District
- Broward
- NCES district ID
- 1200180
- Math proficiency
- 42% ▼ -18.00%
- Reading proficiency
- 53% ▼ -5.00%
- Median HH income
- $52,139
- Composite
- 40.88/100
- National rank
- #3621
- State rank
- #46 of 73 in FL
Livability — Plantation
- Score
- 82/100
- State rank
- #70
- US rank
- #1174
Category grades
Schools grade is shown separately in the Schools card above.
Census & demographics
- Census place
- Plantation, FL
- County
- Broward County · 1,963,430 people
- City population
- 111,690
- Metro
- Miami-Fort Lauderdale-Pompano Beach, FL
- Population (ZIP)
- 50,151
- Household income
- $85,000
- Rent vs Own
- Severe rent burden
- 2923.0
Population outlook (Broward County) Hauer SSP2
- Today (2025)
- 2,207,033 people
- By 2030
- 2,360,704 · +7.0%
- By 2040
- 2,661,208 · +20.6%
- By 2050
- 2,946,698 · +33.5%
- By 2075
- 3,602,273 · +63.2%
- By 2100
- 3,970,984 · +79.9%
Race, ethnicity, and origin ACS 2023
- Neighborhood character
- Diverse neighborhood (Simpson 0.69)
- Race & ethnicity
- White 42% Hispanic / Latino 31% Two or more races 20% Black 16% Asian 6%
- Hispanic origin (detail)
- Mexican 2% Puerto Rican 5% Cuban 4% Dominican 2%
- Common ancestry
- Romanian 3% Italian 3% Hispanic 3%
- Foreign-born
- 31% · Canada, Jamaica, China
- Languages at home
- 60% English-only · Spanish 26% Other Indo-European 4% French/Haitian/Cajun 3%
Political lean MEDSL · Broward
- 2024 margin
- D (+17.0) · D 58.0% · R 41.0%
- 2008→2024 swing
- -17.8pp toward R · 2008: 34.7pp · 2024: 17.0pp
- All cycles
- 2024: D+17.0 2020: D+29.8 2016: D+35.0 2012: D+34.9 2008: D+34.7
Not yet ingested
- Civics
- —
Market trends
- HPI YoY
- ▼ -160.16%
- Current HPI
- 317.8685
- Rent YoY
- ▲ 1.23%
- Metro
- Miami-Fort Lauderdale-Pompano Beach, FL
- State GDP YoY
- ▲ 3.28%
- F500 in state
- 36
Industry mix (Fortune 500 HQ in FL)
| Industry | F500 HQs | Revenue |
|---|---|---|
| Industrial Technology | 2 | $29B |
|
||
| Insurance | 2 | $17B |
|
||
| Retail | 1 | $60B |
|
||
| Technology Distribution | 1 | $58B |
|
||
| Homebuilding | 1 | $35B |
|
||
| Technology Manufacturing | 1 | $35B |
|
||
Price history
+295.7% since first listed2 events — show timeline
- 2026-01-14 Listed $260,000 MARMLS
- 1979-04-01 Sold (Public Records) $65,700 Public Records
Property tax history
+6.7%/yrLatest (2025): $3,811 · -15.5% YoY. Source: county tax records.
Cash-flow waterfall
monthlySold comps — $/sqft
last 12 mo · ≤1 miLoading sold comps…