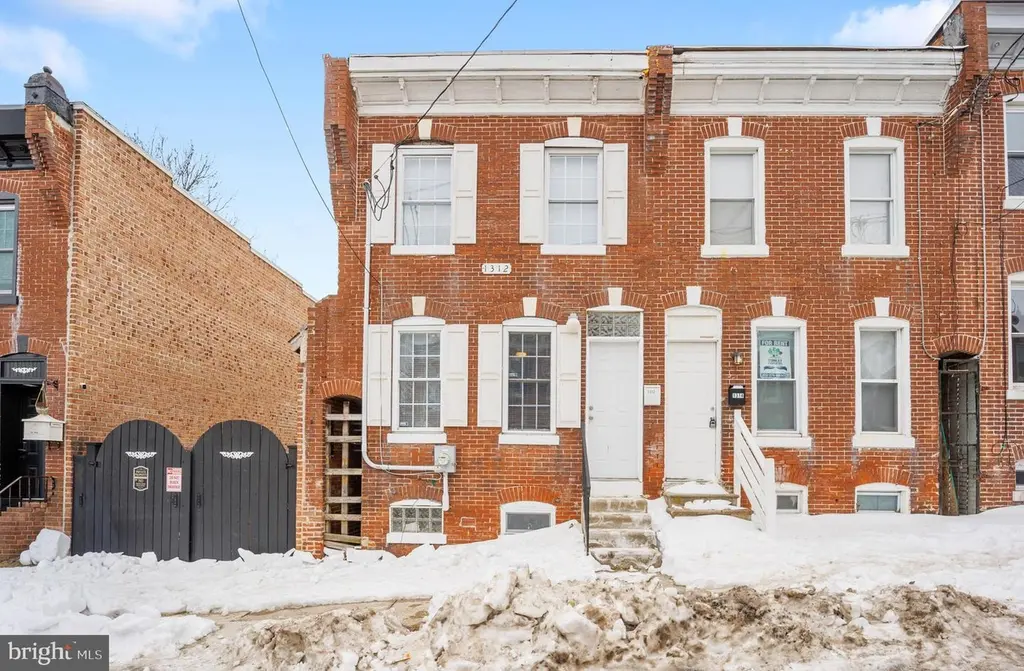
1312 W Third St · Wilmington, DE
Flood risk 1/10 · Minimal
- FEMA flood zone
- X (unshaded)
- Chance of flooding over 30 yrs
- 0.0%
- Est. flood insurance / yr
- $473 – $860
Fire risk 1/10 · Minimal
- Est. fire insurance / yr
- $476 – $884
Heat risk 8/10 · Major
- Hot days now (above 103°F)
- 7 days/yr
- Hot days in 30 yrs
- 16 days/yr
Wind risk 6/10 · Moderate
- Chance of severe wind over 30 yrs
- 27.0%
Air-quality risk 3/10 · Minor
- Unhealthy air days now
- 3 days/yr
- Unhealthy air days in 30 yrs
- 4 days/yr
Risk factors via First Street. Map © Google.
Why this score? — see what drove the B grade
The composite is a weighted blend of 9 inputs, each scored 0–100. Each bar is that input's sub-score; the figure is the points it added to the 100-point composite (weight × sub-score).
- Cash flow +29.9/30.0
- ARV discount +13.4/15.0
- DSCR +10.0/10.0
- 1% rule +7.2/10.0
- Rent growth +4.1/5.0
- Livability +3.2/5.0
- Schools +3.1/10.0
- Condition / age +2.5/5.0
- Appreciation +0.0/10.0
$155,000
🖨 Deal sheet 📄 Offer letter ✓ Due diligence
Listing remarks MLS
Charming well maintained rowhome in Wilmington’s desirable West Side. Bright open living areas, modern kitchen with stainless appliances, hardwood floors, and nice sized backyard — easy commuter access and close to parks, dining, and transit. Move-in ready!
Key facts
- Hardwoods
- Basement ready
- Built 1889
Tags
Neighborhood map
What this means for you Summary
Snapshot
- This is a 3-bed/1.0-bath townhouse listed at $155k.
Deal economics
- At list price, monthly cash flow is $576 ($7k/yr) — positive.
- The deal already cash-flows at list — no discount required.
- Meets the 1% rule at list price ($2k rent vs $155k).
- Recommended offer: $136k (12.0% below list) — sets the bar for market timing.
- Cap rate 10.8% vs local median 5.6% in Wilmington — top-decile yield for the area; either an underpriced asset or a hidden risk that comps aren't pricing in. Stress-test before assuming the spread holds.
Location & tenants
- Location reads 64/100 on livability (#52 in DE) — a middle-class / working-renter tenant base. Strengths: cost of living A+, housing A; Watch: employment D+, schools D, commute D.
- Red Clay Consolidated School District (suburban): math 27% / reading 42% proficiency, ranked #12 of 26 in DE (top 46%) — families likely to look elsewhere, expect single-tenant / working-renter base with shorter leases.
- Market conditions: Rents rising fast (+6.3%/yr); 167 active listings in the ZIP; 40 comparable units currently listed for rent nearby; rentals at typical pace (median 21d on market — plan ~3-4 weeks tenant-placement turnaround); 1,367 units permitted in New Castle County in 2024 (201 in 5+ unit buildings).
- This rent runs 38% of the median local income ($60k/yr) — at the standard rent-burdened threshold; future hikes will face affordability resistance.
Forward outlook
- Local home prices are declining (-3.0%/yr); year-one equity from $1k of loan paydown is wiped out by about $5k of value loss. Plan a longer hold.
- New Castle County population projected at +9% by 2050 — modest demand growth; plan on rents tracking national, not racing it.
- At projected returns (-3.0% appreciation + 6.3% rent growth), your $43k cash investment doubles in ~7 years — after that, you're playing with house money.
Negotiation context
- It's been on market 325 days — a 12% lower offer ($136k) is reasonable based on typical stale-listing flexibility.
- 4 sale attempts since 16y ago; this cycle's ask has dropped $15k (9%) from the opening price — seller is motivated, your offer sets the floor, not the list.
- Current owner paid $45k; list at $155k implies a 244% gain — meaningful room to come down on a strong offer.
Risks & watch-outs
- Watch-outs: built in 1889 — expect roof / HVAC / electrical / plumbing capex.
- Climate carrying-cost: major wind risk, 27% chance of damaging wind over 30y; extreme-heat days projected 7→16/yr by 2055 (HVAC capex compounding) — expect insurance premiums to compound above CPI over the hold.
Questions for the listing agent
- It's been on market 325 days. Have you received any prior offers? Is the seller open to a 12% concession, seller financing, or rate buy-down credit?
- Built in 1889 — when were the roof, HVAC, electrical panel, plumbing, and water heater last replaced?
- Why hasn't it sold? Are there any deal-killer items the seller is aware of (foundation, flood, title, zoning, code violations)?
- Is there a deadline driving the sale (1031 exchange, divorce, estate, relocation)? That informs how much negotiation room exists.
- Schools are D-rated, which usually means shorter tenancies and higher turnover. Who's the typical renter profile here, and what's been the actual vacancy rate?
- Crime grade is F in this area — have there been break-ins, vandalism, or insurance claims at this property in the last 3 years? What carrier currently insures it and at what premium?
- What's the average days-on-market for RENTAL listings here right now (not sales)? A rising rental-DOM trend means longer vacancies and softer asking-rent achievability than the comps imply.
- What's the recent tenant-quality profile in this submarket — average credit score on applications, eviction rate, late-payment / NSF rate, and stable-employment percentage? A property-management company in the area should have these aggregated.
- How much new for-sale + rental construction is in the pipeline within 1–3 miles? Heavy new supply typically softens prices + rents 12–24 months out; constrained supply supports both.
Investment metrics
- 1% rule
- 1.22% ✓
- Cap rate
- 10.75%
- Cash-on-cash
- 15.92%
- DSCR
- 1.71
- GRM
- 6.9
CMA / ARV
- ARV (median comp)
- $178,227
- List price
- $155,000
- Delta
- -13.03%
- Verdict
- UNDERPRICED
- Comps
- 20 within 1.0 mi
Show comp detail 12 sales within ~0.75 mi
| Address | Dist | Beds/Ba | Sqft | Sold | Price | $/sf | Match |
|---|---|---|---|---|---|---|---|
| 1213 W 3rd St | 0.07mi | 3/1.5 | 1,250 (-2%) | 1mo | $215,000 | $172 | 91 |
| 1210 Elm St | 0.27mi | 3/2.0 | 1,300 (+2%) | 1mo | $200,000 | $154 | 80 |
| 1301 Lancaster Ave | 0.12mi | 4/2.0 (+1) | 1,200 (-6%) | 1mo | $250,000 | $208 | 75 |
| 1715 Sycamore St | 0.52mi | 3/1.0 | 1,260 (-1%) | 1mo | $241,000 | $191 | 73 |
| 302 S Franklin St | 0.27mi | 3/1.0 | 1,150 (-10%) | 1mo | $117,000 | $102 | 70 |
| 519 S Jackson St | 0.45mi | 3/1.0 | 1,200 (-6%) | 1mo | $186,000 | $155 | 68 |
| 519 Lafayette Blvd | 0.53mi | 2/1.5 (-1) | 1,250 (-2%) | 0mo | $235,000 | $188 | 65 |
| 1911 W 9th St | 0.61mi | 3/1.0 | 1,325 (+4%) | 1mo | $275,000 | $208 | 64 |
| 400 Geddes St | 0.63mi | 3/1.5 | 1,225 (-4%) | 0mo | $337,500 | $276 | 62 |
| 25 6th Ave | 0.73mi | 3/1.0 | 1,325 (+4%) | 1mo | $115,000 | $87 | 59 |
| 1018 Trenton Pl | 0.60mi | 3/1.5 | 1,400 (+10%) | 1mo | $274,000 | $196 | 53 |
| 1016 Clayton Rd | 0.74mi | 3/1.0 | 1,150 (-10%) | 1mo | $219,000 | $190 | 48 |
Match score weights: distance 35% · size 25% · config 20% · recency 20%. Top-matched comps best support the ARV.
Projected returns pro-forma
-3.0% appreciation · 6.35% rent growth · sell at horizon
- IRR
- 10.2%
- Equity multiple
- 1.42×
- Total profit
- $18,056
- Equity at exit
- $23,111
- IRR
- 21.6%
- Equity multiple
- 3.11×
- Total profit
- $91,543
- Equity at exit
- $13,402
Cash invested: $43,400 (down + closing). Projections, not guarantees.
Landlord ↔ Tenant lean methodology
- Overall (STATE)
- 70 Landlord-Friendly
- State Delaware
- 70 Landlord-Friendly · D+7
- County
- — inherits STATE
- City
- — inherits STATE
ZIP-level market 19805
- Rents YoY
- 6.3%
- Active inventory
- 167
- Price-to-rent
- 6.9×
Monthly cashflow live
- Estimated rent
- $1,885 high interval (Pro) →
- Mortgage (P&I)
- −$813
- Tax from tax record
- −$36 /mo · $434/yr
- Insurance
- −$65
- HOA
- −$0
- Vacancy / Maint / Mgmt
- −$396
- Net cashflow
- $576
Break-even live
UW: 25.0% down · 7.5% · 30yr · 1.5% tax · 5.0% vac · 8.0% maint · 8.0% mgmt
Financing live
Cash to close
- Down payment
- $38,750
- Closing costs
- $4,650
- Reserves months
- —
- Total cash needed
- —
Loan-product check · same deal, 3 products live
Conventional
25% down · 7.5% · 30yr
- Down + closing
- —
- Monthly P&I
- —
- Monthly cashflow
- —
- DSCR
- —
- Eligible?
- —
Personal DTI + credit; lowest rate.
DSCR
20% down · 8.5% · 30yr
- Down + closing
- —
- Monthly P&I
- —
- Monthly cashflow
- —
- DSCR
- —
- Eligible?
- —
No personal income docs; deal must DSCR.
Hard money
10% down · 12.0% · 12mo
- Down + closing
- —
- Monthly P&I
- —
- Monthly cashflow
- —
- DSCR
- —
- Eligible?
- —
Short-term bridge; refi at stabilization.
Rent comps 40 comps
| Address | Beds | Baths | Sqft | Rent | $/sqft | DOM | Units | Dist |
|---|---|---|---|---|---|---|---|---|
| 232 N Franklin St Wilmington, DE | 3.0 | 2.0 | 1150 | $1,795 | $1.56 | 43d | 1 | 0.04mi |
| 1301 Lancaster Ave Wilmington, DE | 4.0 | 2.0 | 1200 | $1,800 | $1.50 | 11d | 1 | 0.11mi |
| 521 N Franklin St Wilmington, DE | 3.0 | 2.0 | 1500 | $1,850 | $1.23 | 3d | 1 | 0.16mi |
| 307 N Rodney St Wilmington, DE | 3.0 | 1.5 | 1425 | $2,000 | $1.40 | 43d | 1 | 0.16mi |
| 1110 Read St Wilmington, DE | 2.0 | 1.0 | 1100 | $1,250 | $1.14 | 20d | 1 | 0.21mi |
| 1029 Lancaster Ave Wilmington, DE | 4.0 | 1.5 | 1375 | $1,900 | $1.38 | 24d | 1 | 0.21mi |
| 115 N Clayton St Unit 115 Wilmington, DE | 3.0 | 1.5 | 1200 | $1,725 | $1.44 | 11d | 1 | 0.25mi |
| 205 Porter St Wilmington, DE | 2.0 | 1.5 | 1200 | $1,700 | $1.42 | 15d | 1 | 0.29mi |
| 1227 Linden St Wilmington, DE | 3.0 | 2.0 | 950 | $1,850 | $1.95 | 3d | 1 | 0.29mi |
| 1522 W 7th St Unit 1 Wilmington, DE | 2.0 | 1.0 | 900 | $1,800 | $2.00 | 4d | 1 | 0.30mi |
| 414 S Franklin St Wilmington, DE | 3.0 | 2.0 | 1195 | $1,895 | $1.59 | 43d | 1 | 0.34mi |
| 1000 W 8th St Unit 3 Wilmington, DE | 2.0 | 1.0 | 1050 | $1,695 | $1.61 | 24d | 1 | 0.35mi |
| 1110 Maple St Wilmington, DE | 3.0 | 1.0 | 1525 | $1,600 | $1.05 | 43d | 1 | 0.38mi |
| 820 W 7th St Wilmington, DE | 3.0 | 1.0 | 1000 | $1,650 | $1.65 | 43d | 1 | 0.39mi |
| 618 N Scott St Wilmington, DE | 3.0 | 1.5 | 1400 | $1,850 | $1.32 | 43d | 1 | 0.43mi |
| 1607 Howland St Wilmington, DE | 3.0 | 1.0 | 1075 | $1,900 | $1.77 | 3d | 1 | 0.44mi |
| 1525 Beech St Wilmington, DE | 3.0 | 2.5 | 1850 | $2,400 | $1.30 | 5d | 1 | 0.48mi |
| 1624 W 9th St Wilmington, DE | 3.0 | 2.5 | 1780 | $2,500 | $1.40 | 18d | 1 | 0.48mi |
| 617 W 6th St Unit 617 B Wilmington, DE | 3.0 | 1.0 | 1000 | $1,600 | $1.60 | 5d | 1 | 0.49mi |
| 507 W 4th St Wilmington, DE | 3.0 | 1.5 | 1075 | $1,800 | $1.67 | 12d | 1 | 0.52mi |
| 709 Windsor St Unit 3 Wilmington, DE | 2.0 | 1.0 | 980 | $1,500 | $1.53 | 43d | 1 | 0.52mi |
| 711 Windsor St Wilmington, DE | 2.0 | 1.0 | 980 | $1,460 | $1.49 | 43d | 1 | 0.53mi |
| 1802 Maple St Wilmington, DE | 3.0 | 1.5 | 1250 | $2,500 | $2.00 | 24d | 1 | 0.54mi |
| 1815 Maple St Wilmington, DE | 3.0 | 1.5 | 1100 | $1,995 | $1.81 | 18d | 1 | 0.54mi |
| 1010 Trenton Pl Wilmington, DE | 3.0 | 1.5 | 1475 | $2,350 | $1.59 | 16d | 1 | 0.59mi |
| 21 Stroud St Unit 1 Wilmington, DE | 3.0 | 1.5 | 1875 | $1,900 | $1.01 | 43d | 1 | 0.60mi |
| 25 Stroud St Wilmington, DE | 3.0 | 1.0 | 1200 | $1,795 | $1.50 | 3d | 1 | 0.61mi |
| 613 W 10th St Wilmington, DE | 2.0 | 1.0 | 1100 | $1,745 | $1.59 | 43d | 1 | 0.64mi |
| 331 Justison St Wilmington, DE | 1.0–2.0 | 1.0–2.0 | 859 | $2,205 | $2.57 | 1d | 9 | 0.64mi |
| 225 W 4th St Unit 2 Wilmington, DE | 2.0 | 1.0 | 1000 | $1,599 | $1.60 | 43d | 1 | 0.67mi |
| 530 Harlan Blvd #519 Wilmington, DE | 2.0 | 2.0 | 1192 | $2,250 | $1.89 | 24d | 1 | 0.69mi |
| 1210 Delaware Ave Unit 3 Wilmington, DE | 2.0 | 1.0 | 1200 | $2,395 | $2.00 | 43d | 1 | 0.70mi |
| 1212 Delaware Ave Wilmington, DE | 2.0 | 1.0–2.0 | 700 | $2,495 | $3.56 | 43d | 4 | 0.70mi |
| 1212 Delaware Ave Wilmington, DE | 2.0 | 1.0–2.0 | 925 | $2,695 | $2.91 | 12d | 4 | 0.70mi |
| 7 6th Ave Wilmington, DE | 3.0 | 2.0 | 1325 | $1,800 | $1.36 | 43d | 1 | 0.71mi |
| 1207 Delaware Ave Wilmington, DE | 2.0 | 1.0 | 1200 | $1,700 | $1.42 | 11d | 1 | 0.73mi |
| 1016 Clayton Rd Wilmington, DE | 3.0 | 1.0 | 1150 | $1,850 | $1.61 | 5d | 1 | 0.73mi |
| 839 N Tatnall St Unit 303 Wilmington, DE | 2.0 | 2.0 | 876 | $1,475 | $1.68 | 5d | 1 | 0.74mi |
| 839 N Tatnall St Unit 101 Wilmington, DE | 2.0 | 2.0 | 1211 | $1,750 | $1.45 | 5d | 1 | 0.74mi |
| 703 Orange St Wilmington, DE | 1.0–2.0 | 1.0 | 800 | $1,475 | $1.84 | 43d | 1 | 0.75mi |
Listing history 24 events
-
2026-06-18days on market $155,000 Active 325 DOM
-
2026-06-17days on market $155,000 Active 324 DOM
-
2026-06-16days on market $155,000 Active 323 DOM
-
2026-06-15days on market $155,000 Active 322 DOM
-
2026-06-13days on market $155,000 Active 320 DOM
-
2026-06-13days on market $155,000 Active 319 DOM
-
2026-06-09days on market $155,000 Active 316 DOM
-
2026-06-08days on market $155,000 Active 315 DOM
-
2026-06-07days on market $155,000 Active 314 DOM
-
2026-06-04days on market $155,000 Active 311 DOM
-
2026-06-03days on market $155,000 Active 310 DOM
-
2026-06-02days on market $155,000 Active 309 DOM
-
2026-06-01days on market $155,000 Active 308 DOM
-
2026-05-31days on market $155,000 Active 307 DOM
-
2026-02-13price $165,000 269-char remark
Show marketing remark (269 chars)
Charming well maintained rowhome in Wilmington’s desirable West Side. Bright open living areas, modern kitchen with stainless appliances, hardwood floors, and nice sized backyard — easy commuter access and close to parks, dining, and transit. Move-in ready!
-
2026-01-26status Active 269-char remark
Show marketing remark (269 chars)
Charming well maintained rowhome in Wilmington’s desirable West Side. Bright open living areas, modern kitchen with stainless appliances, hardwood floors, and nice sized backyard — easy commuter access and close to parks, dining, and transit. Move-in ready!
-
2026-01-21historical 269-char remark
Show marketing remark (269 chars)
Charming well maintained rowhome in Wilmington’s desirable West Side. Bright open living areas, modern kitchen with stainless appliances, hardwood floors, and nice sized backyard — easy commuter access and close to parks, dining, and transit. Move-in ready!
-
2025-07-23$170,000 Active 269-char remark
Show marketing remark (269 chars)
Charming well maintained rowhome in Wilmington’s desirable West Side. Bright open living areas, modern kitchen with stainless appliances, hardwood floors, and nice sized backyard — easy commuter access and close to parks, dining, and transit. Move-in ready!
-
2011-03-02historical
-
2010-12-08$19,900
-
2010-08-05historical
-
2010-06-28$19,900
-
2000-07-11soldstatus $45,000
-
1997-10-16soldstatus $1
ⓘ Source: listings_history table (triggers on properties + properties_extension) + one-shot
backfill from property_details.listing_events for pre-trigger history.
Tax reassessment forecast DE · Partial reset (capped growth)
- Current annual tax
- $434 · $36/mo
- Projected year-2 tax
- $666 · $56/mo
- Expected delta
- +$233/yr (+$19/mo · 53.6%)
ⓘ Screening estimate from a state-policy table — verify with the county assessor before closing.
Climate risk First Street
- Flood 1/10 Low FEMA zone X (unshaded) · 0% chance over 30 yrs
- Wildfire 1/10 Low
- Heat 8/10 Severe 7 d/yr ≥103°F today · 16 d/yr by 30 yrs out
- Wind 6/10 Major 27% chance of damaging wind over 30 yrs
- Air quality 3/10 Moderate 3 unhealthy d/yr today · 4 by 30 yrs out
Nearby sold comps map
Loading sold comps map…
Walkable amenities ~0.75 mi
Loading nearby amenities…
Taxation est. · year 1
- Rental income
- $22,623
- − Mortgage interest
- −$8,682
- − Property taxes
- −$434
- − Insurance
- −$775
- − Repairs & maintenance
- −$1,810
- − Management
- −$1,810
- − Depreciation
- −$4,509
- Taxable income
- $4,603
- Est. tax owed @ 24.0%
- −$1,105
- After-tax cash flow
- $5,805/yr
For passive investors: Depreciation is non-cash, so a rental often shows a tax loss while cash-flowing — sheltering income. Rental losses are passive: they offset passive income freely, and up to $25,000/yr can offset ordinary (W-2) income if you actively participate and your MAGI is under $100k (phasing out to $0 by $150k); unused losses carry forward. On sale, claimed depreciation is recaptured at up to 25%, and gains may owe capital-gains tax (a 1031 exchange can defer both). Figures are a year-1 estimate at your 24.0% rate — not tax advice; consult a CPA.
Schools (NCES district)
- District
- Red Clay Consolidated School District
- NCES district ID
- 1001300
- Math proficiency
- 27% ▼ -11.00%
- Reading proficiency
- 42% ▼ -7.00%
- Median HH income
- $64,298
- Composite
- 31.25/100
- National rank
- #6027
- State rank
- #12 of 26 in DE
Livability — Wilmington
- Score
- 64/100
- State rank
- #52
- US rank
- #14251
Category grades
Schools grade is shown separately in the Schools card above.
Census & demographics
- Census place
- Wilmington, DE
- County
- New Castle County · 483,412 people
- City population
- 173,480
- Metro
- Philadelphia-Camden-Wilmington, PA-NJ-DE-MD
- Population (ZIP)
- 41,402
- Household income
- $60,221
- Rent vs Own
- Severe rent burden
- 1730.0
Population outlook (New Castle County) Hauer SSP2
- Today (2025)
- 594,686 people
- By 2030
- 609,164 · +2.4%
- By 2040
- 632,154 · +6.3%
- By 2050
- 649,068 · +9.1%
- By 2075
- 687,771 · +15.7%
- By 2100
- 694,961 · +16.9%
Race, ethnicity, and origin ACS 2023
- Neighborhood character
- Diverse neighborhood (Simpson 0.70)
- Race & ethnicity
- White 37% Black 32% Hispanic / Latino 25% Two or more races 10%
- Hispanic origin (detail)
- Mexican 10% Puerto Rican 10% Dominican 2%
- Common ancestry
- Romanian 4% Slovak 1% Italian 1%
- Foreign-born
- 9% · Canada
- Languages at home
- 79% English-only · Spanish 18% French/Haitian/Cajun 1% Arabic 1%
Political lean MEDSL · New Castle
- 2024 margin
- Solid D (+32.6) · D 65.5% · R 32.9% · Other 1.6%
- 2008→2024 swing
- -8.1pp toward R · 2008: 40.6pp · 2024: 32.6pp
- All cycles
- 2024: D+32.6 2020: D+37.1 2016: D+29.6 2012: D+34.1 2008: D+40.6
Not yet ingested
- Civics
- —
Market trends
- HPI YoY
- ▼ -291.16%
- Current HPI
- 259.1455
- Rent YoY
- ▲ 6.35%
- Metro
- Philadelphia-Camden-Wilmington, PA-NJ-DE-MD
- State GDP YoY
- —
- F500 in state
- 0
Price history
+266.7% since first listed10 events — show timeline
- 2026-02-13 Price Changed $165,000 BRIGHT MLS
- 2026-01-26 Relisted — BRIGHT MLS
- 2026-01-21 Listing Removed — BRIGHT MLS
- 2025-07-23 Listed $170,000 BRIGHT MLS
- 2011-03-02 Listing Removed — BRIGHT MLS
- 2010-12-08 Listed $19,900 BRIGHT MLS
- 2010-08-05 Listing Removed — BRIGHT MLS
- 2010-06-28 Listed $19,900 BRIGHT MLS
- 2000-07-11 Sold (Public Records) $45,000 Public Records
- 1997-10-16 Sold (Public Records) $1 Public Records
Property tax history
-2.5%/yrLatest (2024): $434 · +15.1% YoY. Source: county tax records.
Cash-flow waterfall
monthlySold comps — $/sqft
last 12 mo · ≤1 miLoading sold comps…