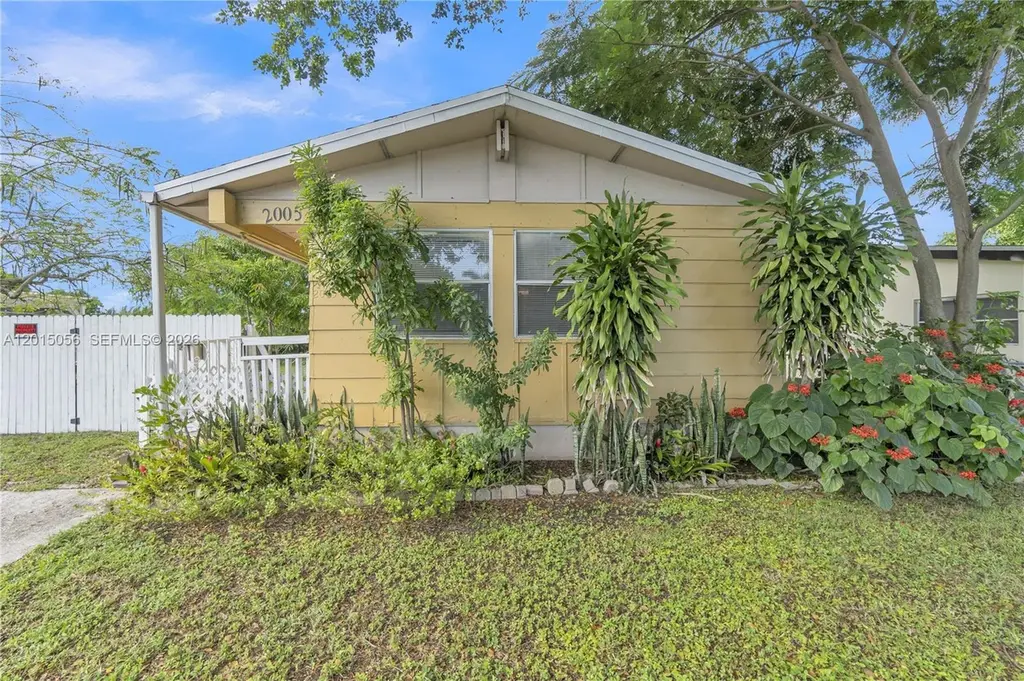
2005 NW 11th Ave · Fort Lauderdale, FL
Flood risk 3/10 · Minor
- FEMA flood zone
- X (shaded)
- Chance of flooding over 30 yrs
- 0.1%
- Est. flood insurance / yr
- $507 – $1,088
Fire risk 1/10 · Minimal
- Est. fire insurance / yr
- $947 – $1,759
Heat risk 10/10 · Severe
- Hot days now (above 106°F)
- 7 days/yr
- Hot days in 30 yrs
- 25 days/yr
Wind risk 10/10 · Severe
- Chance of severe wind over 30 yrs
- 99.0%
Air-quality risk 3/10 · Minor
- Unhealthy air days now
- 3 days/yr
- Unhealthy air days in 30 yrs
- 3 days/yr
Risk factors via First Street. Map © Google.
Why this score? — see what drove the D+ grade
The composite is a weighted blend of 9 inputs, each scored 0–100. Each bar is that input's sub-score; the figure is the points it added to the 100-point composite (weight × sub-score).
- ARV discount +15.0/15.0
- Cash flow +12.1/30.0
- Schools +4.1/10.0
- Livability +4.1/5.0
- DSCR +3.6/10.0
- 1% rule +3.5/10.0
- Rent growth +3.2/5.0
- Condition / age +2.5/5.0
- Appreciation +0.0/10.0
$369,000
🖨 Deal sheet 📄 Offer letter ✓ Due diligence
Listing remarks
* * INVESTOR GREAT OPPORTUNITY * * LOCATED IN OPPORTUNITY ZONE * LOCATED ON A DOUBLE LOT * AFFORDABLE LOCATION IN FORT LAUDERDALE * FRAME CONSTRUCTION * 4 BEDROOM 2 BATH, SINGLE FAMILY WITH NO GARAGE * FFENCED IN YARD * INSIDE UTILITY ROOM * BUS STOP CLOSE BY * 2 MILES TO DOWNTOWN * 3 MILES TO THE BEACH * SOUGHT AFTER LOCATION * HUGE SIDE YARD FOR ENDLESS OPPORTUNIYTIES TO SEE * KNOCKDOWN AND/OR EXPAND
Key facts
- 6,825 sq ft lot
- Parking
- Built 1971
Property features AI
Finance
- Financial info: Pets allowed with restrictions or possible restrictions (conditional)
Exterior
- Parking: Driveway; On-street parking
- Utilities: Public water; Cable available
- Home design: Single-story; Resale property
- Construction: Frame construction; Shingle roof
- Exterior features: Patio; Lot less than quarter acre; Faces east; Zoned RS-8
Interior
- Kitchen: Dishwasher; Electric range
- Bedrooms: Bedroom on main level
- Flooring: Tile
- Bathrooms: 2 full bathrooms
- Heating & cooling: Central heating (electric); Central air conditioning (electric); Ceiling fans
- Interior features: First-floor entry; Bedroom on main level; Living/dining room
- Laundry & utility: Washer; Dryer; Laundry / utility room
Neighborhood map
What this means for you Summary
Snapshot
- This is a 4-bed/2.0-bath single-family listed at $369k.
Deal economics
- At list price, monthly cash flow is $-83 ($-995/yr) — negative.
- To cash-flow at today's rent, offer at most $354k (4.0% below list).
- To meet the 1% rule (rent ≥ 1% of price), the offer needs to be $313k (15.1% below list).
- Recommended offer: $313k (15.1% below list) — sets the bar for 1% rule.
- Cap rate 6.0% vs local median 2.2% in Fort Lauderdale — top-decile yield for the area; either an underpriced asset or a hidden risk that comps aren't pricing in. Stress-test before assuming the spread holds.
Location & tenants
- Location reads 82/100 on livability (#78 in FL, #1,293 nationally) — a professional / high-income tenant draw. Strengths: crime A+, amenities A+, health & safety A+; Watch: cost of living D-.
- Broward (suburban): math 42% / reading 53% proficiency, ranked #46 of 73 in FL (top 63%) — families likely to look elsewhere, expect single-tenant / working-renter base with shorter leases.
- Market conditions: Rents rising (+2.8%/yr); 585 active listings in the ZIP; 40 comparable units currently listed for rent nearby; rentals at typical pace (median 18d on market — plan ~3-4 weeks tenant-placement turnaround); 2,111 units permitted in Broward County in 2024 (1,265 in 5+ unit buildings).
- At $3,131/mo this rent would consume 70% of the median local household income ($54k/yr) (locally 5068% of renters already pay >50% of income on rent) — very limited rent-growth headroom before tenants either downsize or default.
Forward outlook
- Local home prices are declining (-3.0%/yr); year-one equity from $3k of loan paydown is wiped out by about $11k of value loss. Plan a longer hold.
- Broward County population projected at +34% by 2050 — long-run rental-demand tailwind backs the buy-and-hold thesis.
Negotiation context
- It's been on market 42 days — a 3% lower offer ($358k) is reasonable based on typical stale-listing flexibility.
- 5 sale attempts with the ask held roughly flat each time — persistent listings suggest the price (not the market) is what's stuck; bring a comps-based counter.
- Current owner paid $46k; list at $369k implies a 702% gain — meaningful room to come down on a strong offer.
Risks & watch-outs
- Climate carrying-cost: severe wind risk, 99% chance of damaging wind over 30y; extreme-heat days projected 7→25/yr by 2055 (HVAC capex compounding) — expect insurance premiums to compound above CPI over the hold.
Questions for the listing agent
- What do current leases actually rent for vs. the listed asking? Can we see a recent rent roll and the last 12 months of T-12 income?
- It's been on market 42 days. Have you received any prior offers? Is the seller open to a 15% concession, seller financing, or rate buy-down credit?
- Built in 1971 — when were the roof, HVAC, electrical panel, plumbing, and water heater last replaced?
- Is there a deadline driving the sale (1031 exchange, divorce, estate, relocation)? That informs how much negotiation room exists.
- Schools are B-rated — typically a magnet for longer-tenancy family renters. What's the average tenant stay here, and is there a school-zone premium baked into asking?
- The area grade is low — what's the realistic commute time and amenity access for the typical tenant pool here? Any planned neighborhood developments (good or bad) we should know about?
- What's the average days-on-market for RENTAL listings here right now (not sales)? A rising rental-DOM trend means longer vacancies and softer asking-rent achievability than the comps imply.
- What's the recent tenant-quality profile in this submarket — average credit score on applications, eviction rate, late-payment / NSF rate, and stable-employment percentage? A property-management company in the area should have these aggregated.
- How much new for-sale + rental construction is in the pipeline within 1–3 miles? Heavy new supply typically softens prices + rents 12–24 months out; constrained supply supports both.
Investment metrics
- 1% rule
- 0.85% ✗
- Cap rate
- 6.02%
- Cash-on-cash
- -0.96%
- DSCR
- 0.96
- GRM
- 9.8
CMA / ARV
- ARV (on-the-fly)
- $567,056
- Comps found
- 2
Show comp detail 2 sales within ~0.75 mi
| Address | Dist | Beds/Ba | Sqft | Sold | Price | $/sf | Match |
|---|---|---|---|---|---|---|---|
| 1440 NW 7th Ter | 0.67mi | 3/2.0 (-1) | 1,128 (-3%) | 3mo | $550,000 | $488 | 56 |
| 1608 NW 7th Ave | 0.57mi | 3/2.0 (-1) | 1,000 (-14%) | 2mo | $401,000 | $401 | 44 |
Match score weights: distance 35% · size 25% · config 20% · recency 20%. Top-matched comps best support the ARV.
Projected returns pro-forma
-3.0% appreciation · 2.78% rent growth · sell at horizon
- IRR
- -18.1%
- Equity multiple
- 0.36×
- Total profit
- $-65,717
- Equity at exit
- $55,019
- IRR
- -10.8%
- Equity multiple
- 0.35×
- Total profit
- $-66,646
- Equity at exit
- $31,904
Cash invested: $103,320 (down + closing). Projections, not guarantees.
Landlord ↔ Tenant lean methodology
- Overall (STATE)
- 87 Strongly Landlord-Friendly
- State Florida
- 87 Strongly Landlord-Friendly · R+3
- County
- — inherits STATE
- City
- — inherits STATE
ZIP-level market 33311
- Rents YoY
- 2.8%
- Active inventory
- 585
- Price-to-rent
- 9.8×
Monthly cashflow live
- Estimated rent
- $3,131 high interval (Pro) →
- Mortgage (P&I)
- −$1,935
- Tax from tax record
- −$468 /mo · $5,611/yr
- Insurance
- −$154
- HOA
- −$0
- Vacancy / Maint / Mgmt
- −$658
- Net cashflow
- $-83
Break-even live
UW: 25.0% down · 7.5% · 30yr · 1.5% tax · 5.0% vac · 8.0% maint · 8.0% mgmt
Financing live
Cash to close
- Down payment
- $92,250
- Closing costs
- $11,070
- Reserves months
- —
- Total cash needed
- —
Loan-product check · same deal, 3 products live
Conventional
25% down · 7.5% · 30yr
- Down + closing
- —
- Monthly P&I
- —
- Monthly cashflow
- —
- DSCR
- —
- Eligible?
- —
Personal DTI + credit; lowest rate.
DSCR
20% down · 8.5% · 30yr
- Down + closing
- —
- Monthly P&I
- —
- Monthly cashflow
- —
- DSCR
- —
- Eligible?
- —
No personal income docs; deal must DSCR.
Hard money
10% down · 12.0% · 12mo
- Down + closing
- —
- Monthly P&I
- —
- Monthly cashflow
- —
- DSCR
- —
- Eligible?
- —
Short-term bridge; refi at stabilization.
Rent comps 40 comps
| Address | Beds | Baths | Sqft | Rent | $/sqft | DOM | Units | Dist |
|---|---|---|---|---|---|---|---|---|
| 700 NW 18th St Unit 1-2 Fort Lauderdale, FL | 3.0 | 2.0 | 1012 | $3,000 | $2.96 | 22d | 1 | 0.42mi |
| 680 Tennis Club Dr Fort Lauderdale, FL | 3.0 | 2.5–3.0 | 1342 | $2,400 | $1.79 | 17d | 2 | 0.47mi |
| 1608 NW 16th St Fort Lauderdale, FL | 4.0 | 2.0 | 1382 | $2,830 | $2.05 | 3d | 1 | 0.56mi |
| 1531 NW 15th Ave Fort Lauderdale, FL | 3.0 | 1.0 | 960 | $3,500 | $3.65 | 4d | 1 | 0.56mi |
| 650 Tennis Club Dr #110 Fort Lauderdale, FL | 3.0 | 2.5 | 1496 | $2,700 | $1.80 | 10d | 1 | 0.58mi |
| 650 Tennis Club Dr Fort Lauderdale, FL | 2.0–3.0 | 1.5–2.5 | 1276 | $2,700 | $2.12 | 24d | 2 | 0.58mi |
| 1859 Lauderdale Manor Dr Fort Lauderdale, FL | 4.0 | 2.0 | 1178 | $2,965 | $2.52 | 24d | 1 | 0.63mi |
| 2825 NW 9th Ave Wilton Manors, FL | 3.0 | 2.0 | 1205 | $5,500 | $4.56 | 24d | 1 | 0.63mi |
| 1414 NW 8th Ave Unit 1 Fort Lauderdale, FL | 3.0 | 2.0 | 1300 | $2,300 | $1.77 | 24d | 1 | 0.68mi |
| 2809 NW 7th Ave Wilton Manors, FL | 3.0 | 2.0 | 1145 | $7,000 | $6.11 | 5d | 1 | 0.68mi |
| 2632 NW 18th Ter Unit 2638 Oakland Park, FL | 3.0 | 1.0 | 1000 | $2,290 | $2.29 | 24d | 1 | 0.73mi |
| 1329 NW 8th Ave Unit A Fort Lauderdale, FL | 3.0 | 2.0 | 1134 | $2,350 | $2.07 | 11d | 1 | 0.74mi |
| 1335 NW 7th Ter Fort Lauderdale, FL | 3.0 | 1.5 | 1200 | $2,550 | $2.12 | 2d | 1 | 0.75mi |
| 2701 NW 18th Ter Unit A Oakland Park, FL | 3.0 | 2.0 | 1399 | $2,850 | $2.04 | 24d | 1 | 0.78mi |
| 1600 NW 13th Ct Unit 1 Fort Lauderdale, FL | 3.0 | 1.0 | 1308 | $2,550 | $1.95 | 2d | 1 | 0.83mi |
| 1500 NW 3rd Ave Fort Lauderdale, FL | 3.0 | 1.0 | 1072 | $2,725 | $2.54 | 24d | 1 | 0.84mi |
| 1432 NW 3rd Ave Fort Lauderdale, FL | 3.0 | 2.0 | 1047 | $3,200 | $3.06 | 24d | 1 | 0.87mi |
| 1533 NW 1st Ave Unit A Fort Lauderdale, FL | 3.0 | 2.0 | 1185 | $2,520 | $2.13 | 7d | 1 | 0.87mi |
| 1528 NW 1st Ave Fort Lauderdale, FL | 3.0 | 1.0 | 1022 | $2,550 | $2.50 | 17d | 1 | 0.90mi |
| 1528 NW 1st Ave Fort Lauderdale, FL | 3.0 | 1.0 | 1022 | $2,550 | $2.50 | 15d | 1 | 0.90mi |
| 1508 NW 1st Ave Fort Lauderdale, FL | 3.0 | 1.0 | 1325 | $2,550 | $1.92 | 20d | 1 | 0.93mi |
| 1508 NW 1st Ave Fort Lauderdale, FL | 3.0 | 1.0 | 1202 | $2,600 | $2.16 | 24d | 1 | 0.93mi |
| 1329 NW 3rd Ave Fort Lauderdale, FL | 3.0 | 2.0 | 1400 | $3,000 | $2.14 | 7d | 1 | 0.94mi |
| 1532 N Andrews Ave Fort Lauderdale, FL | 3.0 | 2.0 | 1311 | $4,900 | $3.74 | 24d | 1 | 0.95mi |
| 1532 N Andrews Ave Fort Lauderdale, FL | 3.0 | 2.0 | 1311 | $4,900 | $3.74 | 7d | 1 | 0.95mi |
| 1332 NW 3rd Ave Fort Lauderdale, FL | 4.0 | 2.0 | 1250 | $3,450 | $2.76 | 5d | 1 | 0.95mi |
| 1520 N Andrews Ave Fort Lauderdale, FL | 3.0 | 2.0 | 1110 | $3,100 | $2.79 | 24d | 1 | 0.96mi |
| 1213 NW 6th Ave Fort Lauderdale, FL | 4.0 | 2.0 | 1323 | $3,500 | $2.65 | 24d | 1 | 0.96mi |
| 2736 NW 21st Ave Fort Lauderdale, FL | 4.0 | 2.0 | 1180 | $3,350 | $2.84 | 7d | 1 | 0.97mi |
| 2736 NW 21st Ave Fort Lauderdale, FL | 4.0 | 2.0 | 1180 | $3,350 | $2.84 | 11d | 1 | 0.97mi |
| 1325 NW 11th Ct Fort Lauderdale, FL | 3.0 | 2.0 | 1084 | $3,000 | $2.77 | 24d | 1 | 0.98mi |
| 1129 NW 7th Ter Fort Lauderdale, FL | 4.0 | 1.0 | 1213 | $2,550 | $2.10 | 7d | 1 | 0.99mi |
| 2121 NW 28th St Oakland Park, FL | 3.0 | 1.0 | 1047 | $2,295 | $2.19 | 22d | 1 | 1.03mi |
| 1325 NW 11th St Unit 1325 Fort Lauderdale, FL | 3.0 | 2.0 | 1084 | $3,000 | $2.77 | 24d | 1 | 1.03mi |
| 1418 NW 11th St Fort Lauderdale, FL | 3.0 | 2.0 | 1417 | $4,300 | $3.03 | 24d | 1 | 1.07mi |
| 1418 NW 11th St Fort Lauderdale, FL | 3.0 | 2.0 | 1417 | $3,750 | $2.65 | 5d | 1 | 1.07mi |
| 1517 NE 3rd Ave Fort Lauderdale, FL | 3.0 | 2.0 | 1499 | $3,250 | $2.17 | 7d | 1 | 1.09mi |
| 1517 NE 3rd Ave Fort Lauderdale, FL | 3.0 | 2.0 | 1499 | $3,250 | $2.17 | 17d | 1 | 1.09mi |
| 1244 NW 1st Ave Fort Lauderdale, FL | 3.0 | 2.0 | 1316 | $3,100 | $2.36 | 24d | 1 | 1.10mi |
| 1218 NW 2nd Ave Fort Lauderdale, FL | 3.0 | 2.0 | 1209 | $3,199 | $2.65 | 4d | 1 | 1.11mi |
Listing history 26 events
-
2026-06-18days on market $369,000 Active 42 DOM
-
2026-06-17days on market $369,000 Active 41 DOM
-
2026-06-16days on market $369,000 Active 40 DOM
-
2026-06-15days on market $369,000 Active 39 DOM
-
2026-06-13days on market $369,000 Active 37 DOM
-
2026-06-09days on market $369,000 Active 33 DOM
-
2026-06-08days on market $369,000 Active 32 DOM
-
2026-06-07days on market $369,000 Active 31 DOM
-
2026-06-04days on market $369,000 Active 28 DOM
-
2026-06-03days on market $369,000 Active 27 DOM
-
2026-06-02days on market $369,000 Active 26 DOM
-
2026-06-01days on market $369,000 Active 25 DOM
-
2026-05-31days on market $369,000 Active 24 DOM
-
2026-05-07$369,000 Active
-
2026-05-06historical
-
2026-04-06historical Active Under Contract
-
2026-02-10historical $3,000
-
2026-01-28price $369,900
-
2026-01-08status Active
-
2026-01-08historical Active Under Contract
-
2025-12-09$3,000
-
2025-11-20price $378,000
-
2025-11-10historical $3,000
-
2025-10-18$3,000
-
2025-10-17$379,000 Active
-
1984-07-01soldstatus $46,000
ⓘ Source: listings_history table (triggers on properties + properties_extension) + one-shot
backfill from property_details.listing_events for pre-trigger history.
Tax reassessment forecast FL · Resets to sale price
- Current annual tax
- $5,611 · $468/mo
- Projected year-2 tax
- $5,611 · $468/mo
- Expected delta
- $0/yr ($0/mo · 0.0%)
ⓘ Screening estimate from a state-policy table — verify with the county assessor before closing.
Climate risk First Street
- Flood 3/10 Moderate FEMA zone X (shaded) · 10% chance over 30 yrs
- Wildfire 1/10 Low
- Heat 10/10 Extreme 7 d/yr ≥106°F today · 25 d/yr by 30 yrs out
- Wind 10/10 Extreme 99% chance of damaging wind over 30 yrs
- Air quality 3/10 Moderate 3 unhealthy d/yr today · 3 by 30 yrs out
Nearby sold comps map
Loading sold comps map…
Walkable amenities ~0.75 mi
Loading nearby amenities…
Taxation est. · year 1
- Rental income
- $37,572
- − Mortgage interest
- −$20,670
- − Property taxes
- −$5,611
- − Insurance
- −$1,845
- − Repairs & maintenance
- −$3,006
- − Management
- −$3,006
- − Depreciation
- −$10,735
- Taxable loss
- −$7,300
- Est. tax savings @ 24.0%
- +$1,752
- After-tax cash flow
- $757/yr
For passive investors: Depreciation is non-cash, so a rental often shows a tax loss while cash-flowing — sheltering income. Rental losses are passive: they offset passive income freely, and up to $25,000/yr can offset ordinary (W-2) income if you actively participate and your MAGI is under $100k (phasing out to $0 by $150k); unused losses carry forward. On sale, claimed depreciation is recaptured at up to 25%, and gains may owe capital-gains tax (a 1031 exchange can defer both). Figures are a year-1 estimate at your 24.0% rate — not tax advice; consult a CPA.
Schools (NCES district)
- District
- Broward
- NCES district ID
- 1200180
- Math proficiency
- 42% ▼ -18.00%
- Reading proficiency
- 53% ▼ -5.00%
- Median HH income
- $52,139
- Composite
- 40.88/100
- National rank
- #3621
- State rank
- #46 of 73 in FL
Livability — Fort Lauderdale
- Score
- 82/100
- State rank
- #78
- US rank
- #1293
Category grades
Schools grade is shown separately in the Schools card above.
Census & demographics
- Census place
- Fort Lauderdale, FL
- County
- Broward County · 1,963,430 people
- City population
- 235,769
- Metro
- Miami-Fort Lauderdale-Pompano Beach, FL
- Population (ZIP)
- 74,898
- Household income
- $53,973
- Rent vs Own
- Severe rent burden
- 5068.0
Population outlook (Broward County) Hauer SSP2
- Today (2025)
- 2,207,033 people
- By 2030
- 2,360,704 · +7.0%
- By 2040
- 2,661,208 · +20.6%
- By 2050
- 2,946,698 · +33.5%
- By 2075
- 3,602,273 · +63.2%
- By 2100
- 3,970,984 · +79.9%
Race, ethnicity, and origin ACS 2023
- Neighborhood character
- Predominantly Black (77%)
- Race & ethnicity
- Black 77% Two or more races 9% White 9% Hispanic / Latino 9%
- Hispanic origin (detail)
- Mexican 1% Puerto Rican 2% Cuban 1%
- Common ancestry
- Hispanic 15% Lithuanian 1% Romanian 0%
- Foreign-born
- 24% · Canada, Jamaica
- Languages at home
- 78% English-only · French/Haitian/Cajun 14% Spanish 6% Other Indo-European 1%
Political lean MEDSL · Broward
- 2024 margin
- D (+17.0) · D 58.0% · R 41.0%
- 2008→2024 swing
- -17.8pp toward R · 2008: 34.7pp · 2024: 17.0pp
- All cycles
- 2024: D+17.0 2020: D+29.8 2016: D+35.0 2012: D+34.9 2008: D+34.7
Not yet ingested
- Civics
- —
Market trends
- HPI YoY
- ▼ -300.68%
- Current HPI
- 535.2504
- Rent YoY
- ▲ 2.78%
- Metro
- Miami-Fort Lauderdale-Pompano Beach, FL
- State GDP YoY
- ▲ 3.28%
- F500 in state
- 36
Industry mix (Fortune 500 HQ in FL)
| Industry | F500 HQs | Revenue |
|---|---|---|
| Industrial Technology | 2 | $29B |
|
||
| Insurance | 2 | $17B |
|
||
| Retail | 1 | $60B |
|
||
| Technology Distribution | 1 | $58B |
|
||
| Homebuilding | 1 | $35B |
|
||
| Technology Manufacturing | 1 | $35B |
|
||
Price history
+702.2% since first listed13 events — show timeline
- 2026-05-07 Listed $369,000 MARMLS
- 2026-05-06 Listing Removed — MARMLS
- 2026-04-06 Contingent — MARMLS
- 2026-02-10 Rental Removed $3,000 MARMLS
- 2026-01-28 Price Changed $369,900 MARMLS
- 2026-01-08 Relisted — MARMLS
- 2026-01-08 Contingent — MARMLS
- 2025-12-09 Listed for Rent $3,000 MARMLS
- 2025-11-20 Price Changed $378,000 MARMLS
- 2025-11-10 Rental Removed $3,000 MARMLS
- 2025-10-18 Listed for Rent $3,000 MARMLS
- 2025-10-17 Listed $379,000 MARMLS
- 1984-07-01 Sold (Public Records) $46,000 Public Records
Property tax history
+9.1%/yrLatest (2025): $5,611 · +8.5% YoY. Source: county tax records.
Cash-flow waterfall
monthlySold comps — $/sqft
last 12 mo · ≤1 miLoading sold comps…