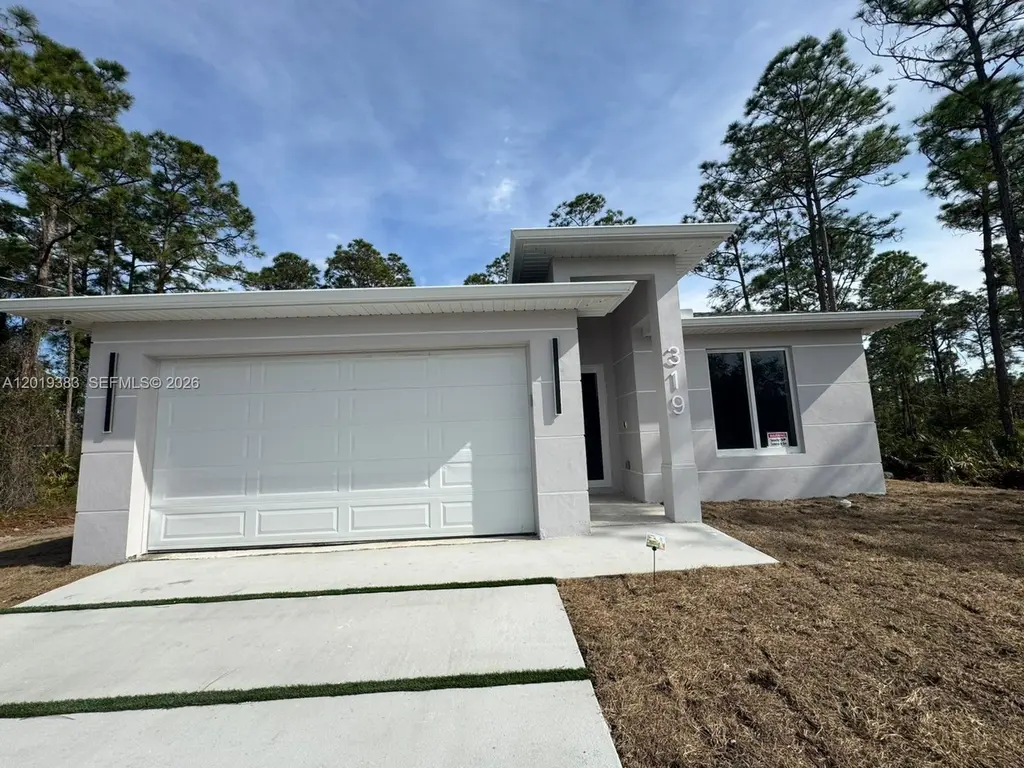
319 Lorena Ave S · Lehigh Acres, FL
Flood risk 3/10 · Minor
- FEMA flood zone
- X (unshaded)
- Chance of flooding over 30 yrs
- 0.2%
- Est. flood insurance / yr
- $507 – $1,088
Fire risk 3/10 · Minor
- Est. fire insurance / yr
- $947 – $1,759
Heat risk 9/10 · Severe
- Hot days now (above 108°F)
- 5 days/yr
- Hot days in 30 yrs
- 20 days/yr
Wind risk 10/10 · Severe
- Chance of severe wind over 30 yrs
- 99.0%
Air-quality risk 2/10 · Minimal
- Unhealthy air days now
- 1 days/yr
- Unhealthy air days in 30 yrs
- 2 days/yr
Risk factors via First Street. Map © Google.
Why this score? — see what drove the D+ grade
The composite is a weighted blend of 9 inputs, each scored 0–100. Each bar is that input's sub-score; the figure is the points it added to the 100-point composite (weight × sub-score).
- Cash flow +13.3/30.0
- Appreciation +10.0/10.0
- ARV discount +7.5/15.0
- Schools +4.1/10.0
- DSCR +4.0/10.0
- Livability +3.0/5.0
- 1% rule +2.5/10.0
- Condition / age +2.5/5.0
- Rent growth +1.3/5.0
$270,000
🖨 Deal sheet 📄 Offer letter ✓ Due diligence
Listing remarks MLS
One or more photo(s) has been virtually staged, AI generated or rendered. Excellent opportunity! Brand-new construction featuring 3 bedrooms and 2 bathrooms in a central Lehigh Acres location. This property is strategically located near major roads including SR-82, Lee Blvd, and Bell Blvd, providing easy access to different parts of the city. It is also just minutes away from supermarkets, schools, restaurants, and shopping centers such as Walmart and Dollar General. Ideal for those seeking comfort, convenience, and an excellent location.
Key facts
- 2 garage spots
- Built 2025
- Listed 21 days
Tags
Property features AI
Finance
- Other: Zoned R1; City street frontage; Lot smaller than a quarter acre
Exterior
- Parking: Attached garage with 2 covered spaces; Driveway; Garage door opener
- Security: Smoke detector(s); High-impact doors
- Utilities: Well water; Septic tank; Cable available
- Home design: Single-story; New construction; Faces east
- Construction: Block construction; Shingle roof
- Exterior features: Security/high-impact doors; Smoke detectors
Interior
- Kitchen: Dishwasher; Microwave; Refrigerator; Garbage disposal; Electric water heater
- Bedrooms: At least one bedroom on the main level
- Flooring: Tile
- Bathrooms: 2 full bathrooms
- Heating & cooling: Central heating; Central air conditioning; Ceiling fans
- Interior features: First-floor entry; Bedroom on the main level; Split bedroom layout; Pantry; Custom mirrors; Unfurnished; Double-hung, single-hung and sliding windows with impact glass and metal frames; Tile flooring
- Laundry & utility: Laundry area located in the garage
Neighborhood map
What this means for you Summary
Snapshot
- This is a 3-bed/2.0-bath land listed at $270k.
Deal economics
- At list price, monthly cash flow is $-1 ($-11/yr) — negative.
- To cash-flow at today's rent, offer at most $270k (0.1% below list).
- To meet the 1% rule (rent ≥ 1% of price), the offer needs to be $202k (25.2% below list).
- Recommended offer: $202k (25.2% below list) — sets the bar for 1% rule.
- Cap rate 6.3% vs local median 4.7% in Lehigh Acres — top-decile yield for the area; either an underpriced asset or a hidden risk that comps aren't pricing in. Stress-test before assuming the spread holds.
Location & tenants
- Location reads 59/100 on livability (#826 in FL) — a working-class tenant base; expect higher turnover. Strengths: cost of living A+, housing A+; Watch: crime C-, employment D+, schools D-.
- Lee (suburban): math 47% / reading 50% proficiency, ranked #42 of 73 in FL (top 58%) — families likely to look elsewhere, expect single-tenant / working-renter base with shorter leases.
- Market conditions: Rents falling (-4.7%/yr); 2460 active listings in the ZIP; 40 comparable units currently listed for rent nearby; rentals at typical pace (median 21d on market — plan ~3-4 weeks tenant-placement turnaround); 15,411 units permitted in Lee County in 2024 (4,686 in 5+ unit buildings).
- This rent runs 34% of the median local income ($72k/yr) — at the standard rent-burdened threshold; future hikes will face affordability resistance.
Forward outlook
- In year one you build about $29k of equity ($2k loan paydown + $27k appreciation (10.0% local appreciation)).
- Lee County population projected at +44% by 2050 — long-run rental-demand tailwind backs the buy-and-hold thesis.
- At projected returns (10.0% appreciation + 0.0% rent growth), your $76k cash investment doubles in ~3 years — after that, you're playing with house money.
- By year 2, paydown + projected appreciation supports a ~$46k cash-out refi (75% LTV) — recoverable capital for the next deal without selling this one.
Negotiation context
- It's been on market 21 days — a 2% lower offer ($266k) is reasonable based on typical stale-listing flexibility.
- 6 sale attempts since 2y ago with the ask held roughly flat each time — persistent listings suggest the price (not the market) is what's stuck; bring a comps-based counter.
- Current owner paid $14k; list at $270k implies a 1829% gain — meaningful room to come down on a strong offer.
Risks & watch-outs
- Climate carrying-cost: severe wind risk, 99% chance of damaging wind over 30y; extreme-heat days projected 5→20/yr by 2055 (HVAC capex compounding) — expect insurance premiums to compound above CPI over the hold.
Questions for the listing agent
- What do current leases actually rent for vs. the listed asking? Can we see a recent rent roll and the last 12 months of T-12 income?
- Is there a deadline driving the sale (1031 exchange, divorce, estate, relocation)? That informs how much negotiation room exists.
- Schools are D-rated, which usually means shorter tenancies and higher turnover. Who's the typical renter profile here, and what's been the actual vacancy rate?
- The area grade is low — what's the realistic commute time and amenity access for the typical tenant pool here? Any planned neighborhood developments (good or bad) we should know about?
- What's the average days-on-market for RENTAL listings here right now (not sales)? A rising rental-DOM trend means longer vacancies and softer asking-rent achievability than the comps imply.
- What's the recent tenant-quality profile in this submarket — average credit score on applications, eviction rate, late-payment / NSF rate, and stable-employment percentage? A property-management company in the area should have these aggregated.
- How much new for-sale + rental construction is in the pipeline within 1–3 miles? Heavy new supply typically softens prices + rents 12–24 months out; constrained supply supports both.
Investment metrics
- 1% rule
- 0.75% ✗
- Cap rate
- 6.29%
- Cash-on-cash
- -0.01%
- DSCR
- 1.00
- GRM
- 11.1
CMA / ARV
No comps found within radius.
Projected returns pro-forma
10.0% appreciation · 0.0% rent growth · sell at horizon
- IRR
- 23.4%
- Equity multiple
- 2.86×
- Total profit
- $140,939
- Equity at exit
- $243,237
- IRR
- 20.2%
- Equity multiple
- 6.35×
- Total profit
- $404,224
- Equity at exit
- $524,551
Cash invested: $75,600 (down + closing). Projections, not guarantees.
Landlord ↔ Tenant lean methodology
- Overall (STATE)
- 87 Strongly Landlord-Friendly
- State Florida
- 87 Strongly Landlord-Friendly · R+3
- County
- — inherits STATE
- City
- — inherits STATE
ZIP-level market 33974
- Home prices YoY
- 5.8%
- Rents YoY
- -4.7%
- Active inventory
- 2460
- Price-to-rent
- 11.1×
Monthly cashflow live
- Estimated rent
- $2,019 high interval (Pro) →
- Mortgage (P&I)
- −$1,416
- Tax from tax record
- −$68 /mo · $812/yr
- Insurance
- −$112
- HOA
- −$0
- Vacancy / Maint / Mgmt
- −$424
- Net cashflow
- $-1
Break-even live
UW: 25.0% down · 7.5% · 30yr · 1.5% tax · 5.0% vac · 8.0% maint · 8.0% mgmt
Financing live
Cash to close
- Down payment
- $67,500
- Closing costs
- $8,100
- Reserves months
- —
- Total cash needed
- —
Loan-product check · same deal, 3 products live
Conventional
25% down · 7.5% · 30yr
- Down + closing
- —
- Monthly P&I
- —
- Monthly cashflow
- —
- DSCR
- —
- Eligible?
- —
Personal DTI + credit; lowest rate.
DSCR
20% down · 8.5% · 30yr
- Down + closing
- —
- Monthly P&I
- —
- Monthly cashflow
- —
- DSCR
- —
- Eligible?
- —
No personal income docs; deal must DSCR.
Hard money
10% down · 12.0% · 12mo
- Down + closing
- —
- Monthly P&I
- —
- Monthly cashflow
- —
- DSCR
- —
- Eligible?
- —
Short-term bridge; refi at stabilization.
Rent comps 40 comps
| Address | Beds | Baths | Sqft | Rent | $/sqft | DOM | Units | Dist |
|---|---|---|---|---|---|---|---|---|
| 350 Limerick Ave S Lehigh Acres, FL | 3.0 | 2.0 | 1199 | $1,800 | $1.50 | 3d | 1 | 0.39mi |
| 333 Bell Blvd S Lehigh Acres, FL | 3.0 | 2.0 | 1114 | $1,300 | $1.17 | 3d | 1 | 0.41mi |
| 825 Carbon St E Lehigh Acres, FL | 3.0 | 2.0 | 1582 | $2,300 | $1.45 | 23d | 1 | 0.42mi |
| 346 Bell Blvd S Lehigh Acres, FL | 3.0 | 2.0 | 1185 | $1,495 | $1.26 | 3d | 1 | 0.46mi |
| 346 Bell Blvd S Lehigh Acres, FL | 3.0 | 2.0 | 1185 | $1,495 | $1.26 | 14d | 1 | 0.46mi |
| 382 McArthur Blvd Lehigh Acres, FL | 3.0 | 2.0 | 1055 | $2,200 | $2.09 | 23d | 1 | 0.46mi |
| 388 Bell Blvd S Lehigh Acres, FL | 3.0 | 2.0 | 1200 | $1,780 | $1.48 | 23d | 1 | 0.50mi |
| 759 Cane St E Lehigh Acres, FL | 3.0 | 2.0 | 1169 | $1,950 | $1.67 | 3d | 1 | 0.55mi |
| 219 Beckley Dr Lehigh Acres, FL | 3.0 | 2.5 | 1548 | $1,890 | $1.22 | 16d | 1 | 0.60mi |
| 947 Grant Blvd Lehigh Acres, FL | 4.0 | 2.0 | 1650 | $2,145 | $1.30 | 23d | 1 | 0.61mi |
| 750 Cane St E Lehigh Acres, FL | 4.0 | 3.0 | 1537 | $2,800 | $1.82 | 3d | 1 | 0.61mi |
| 940 Belmont St E Lehigh Acres, FL | 4.0 | 2.0 | 1838 | $2,850 | $1.55 | 23d | 1 | 0.63mi |
| 455 Bell Blvd Unit 1 Lehigh Acres, FL | 3.0 | 2.0 | 1142 | $1,600 | $1.40 | 23d | 1 | 0.64mi |
| 230 E Malden Ave S Lehigh Acres, FL | 4.0 | 2.0 | 1833 | $1,875 | $1.02 | 23d | 1 | 0.68mi |
| 459 Lockport Ave S Lehigh Acres, FL | 3.0 | 2.0 | 1650 | $2,000 | $1.21 | 23d | 1 | 0.70mi |
| 727 Cane St E Lehigh Acres, FL | 3.0 | 2.0 | 1582 | $2,000 | $1.26 | 23d | 1 | 0.79mi |
| 912 Anthony St E Lehigh Acres, FL | 3.0 | 2.5 | 1548 | $1,890 | $1.22 | 16d | 1 | 0.83mi |
| 508 Bell Blvd S Lehigh Acres, FL | 3.0 | 2.0 | 1200 | $1,800 | $1.50 | 23d | 1 | 0.85mi |
| 718 Sunrise Blvd Lehigh Acres, FL | 3.0 | 2.0 | 1100 | $1,610 | $1.46 | 23d | 1 | 0.89mi |
| 713 Cardinal St E Lehigh Acres, FL | 3.0 | 2.0 | 1100 | $1,635 | $1.49 | 3d | 1 | 0.92mi |
| 232 Fowler Ave Lehigh Acres, FL | 3.0 | 2.0 | 1582 | $2,664 | $1.68 | 23d | 1 | 0.97mi |
| 940 Sterling St E Lehigh Acres, FL | 4.0 | 2.0 | 1389 | $1,750 | $1.26 | 3d | 1 | 1.01mi |
| 970 Lakeside Dr Lehigh Acres, FL | 3.0 | 2.0 | 1325 | $1,800 | $1.36 | 19d | 1 | 1.05mi |
| 720 Chavers St Lehigh Acres, FL | 3.0 | 2.0 | 1547 | $2,200 | $1.42 | 23d | 1 | 1.08mi |
| 573 Bell Blvd S Lehigh Acres, FL | 3.0 | 2.0 | 1218 | $1,900 | $1.56 | 14d | 1 | 1.11mi |
| 444 Genoa Ave S Lehigh Acres, FL | 4.0 | 2.0 | 1389 | $1,750 | $1.26 | 21d | 1 | 1.13mi |
| 129 Wanatah Ave Lehigh Acres, FL | 4.0 | 2.0 | 1798 | $1,911 | $1.06 | 3d | 1 | 1.14mi |
| 404 Chalet Ave S Lehigh Acres, FL | 3.0 | 2.0 | 1200 | $1,850 | $1.54 | 23d | 1 | 1.16mi |
| 406 Chalet Ave S Lehigh Acres, FL | 3.0 | 2.0 | 1200 | $1,850 | $1.54 | 23d | 1 | 1.16mi |
| 541 Hawthorne Ave S Lehigh Acres, FL | 3.0 | 2.0 | 1634 | $1,921 | $1.18 | 3d | 1 | 1.18mi |
| 1440 Graham Cir Lehigh Acres, FL | 3.0 | 2.0 | 1767 | $2,300 | $1.30 | 23d | 1 | 1.21mi |
| 270 Silent Lake Dr Lehigh Acres, FL | 4.0 | 2.0 | 1800 | $1,895 | $1.05 | 11d | 1 | 1.22mi |
| 1018 Kent St E Lehigh Acres, FL | 3.0 | 2.0 | 1600 | $2,000 | $1.25 | 16d | 1 | 1.23mi |
| 815 Porter St E Lehigh Acres, FL | 3.0 | 2.0 | 1659 | $1,800 | $1.08 | 23d | 1 | 1.25mi |
| 719 Center Lake St Lehigh Acres, FL | 3.0 | 2.0 | 1616 | $1,750 | $1.08 | 23d | 1 | 1.26mi |
| 442 Genoa Ave S Lehigh Acres, FL | 4.0 | 2.0 | 1365 | $1,750 | $1.28 | 3d | 1 | 1.26mi |
| 1122 Randolph St Lehigh Acres, FL | 3.0 | 2.0 | 1550 | $2,100 | $1.35 | 23d | 1 | 1.29mi |
| 1125 Chipley St Unit 1 Lehigh Acres, FL | 2.0 | 1.0 | 950 | $1,350 | $1.42 | 3d | 1 | 1.29mi |
| 538 Flamingo Ave S Lehigh Acres, FL | 3.0 | 2.0 | 1272 | $1,791 | $1.41 | 3d | 1 | 1.32mi |
| 201 Fireside Ct Unit N/A Lehigh Acres, FL | 2.0 | 2.0 | 1370 | $1,675 | $1.22 | 2d | 1 | 1.34mi |
Listing history 24 events
-
2026-06-08statusdays on market $270,000 Pending 21 DOM
-
2026-06-03days on market $270,000 Active 20 DOM
-
2026-06-02days on market $270,000 Active 19 DOM
-
2026-06-01days on market $270,000 Active 18 DOM
-
2026-05-31days on market $270,000 Active 17 DOM
-
2026-04-23$270,000 Active
Show marketing remark (544 chars)
One or more photo(s) has been virtually staged, AI generated or rendered. Excellent opportunity! Brand-new construction featuring 3 bedrooms and 2 bathrooms in a central Lehigh Acres location. This property is strategically located near major roads including SR-82, Lee Blvd, and Bell Blvd, providing easy access to different parts of the city. It is also just minutes away from supermarkets, schools, restaurants, and shopping centers such as Walmart and Dollar General. Ideal for those seeking comfort, convenience, and an excellent location.
-
2026-04-23$270,000 Active 544-char remark
Show marketing remark (544 chars)
One or more photo(s) has been virtually staged, AI generated or rendered. Excellent opportunity! Brand-new construction featuring 3 bedrooms and 2 bathrooms in a central Lehigh Acres location. This property is strategically located near major roads including SR-82, Lee Blvd, and Bell Blvd, providing easy access to different parts of the city. It is also just minutes away from supermarkets, schools, restaurants, and shopping centers such as Walmart and Dollar General. Ideal for those seeking comfort, convenience, and an excellent location.
-
2025-12-31historical
-
2025-11-17price $299,900
-
2025-11-07price $309,900
-
2025-07-17$315,000 Active
-
2025-05-29historical
-
2025-05-29historical
-
2025-04-29$300,000 Active
-
2025-04-22price $300,000
-
2025-03-14price $335,000
-
2025-02-10price $345,997
-
2025-01-23$349,997 Active
-
2025-01-21historical
-
2024-12-12price $349,997
-
2024-11-15$364,000 Active
-
2024-01-29soldstatus $14,000
-
2017-10-11soldstatus $86,600
-
2005-03-07soldstatus $25,000
ⓘ Source: listings_history table (triggers on properties + properties_extension) + one-shot
backfill from property_details.listing_events for pre-trigger history.
Tax reassessment forecast FL · Resets to sale price
- Current annual tax
- $812 · $68/mo
- Projected year-2 tax
- $2,241 · $187/mo
- Expected delta
- +$1,429/yr (+$119/mo · 176.1%)
ⓘ Screening estimate from a state-policy table — verify with the county assessor before closing.
Climate risk First Street
- Flood 3/10 Moderate FEMA zone X (unshaded) · 20% chance over 30 yrs
- Wildfire 3/10 Moderate
- Heat 9/10 Extreme 5 d/yr ≥108°F today · 20 d/yr by 30 yrs out
- Wind 10/10 Extreme 99% chance of damaging wind over 30 yrs
- Air quality 2/10 Low 1 unhealthy d/yr today · 2 by 30 yrs out
Nearby sold comps map
Loading sold comps map…
Walkable amenities ~0.75 mi
Loading nearby amenities…
Taxation est. · year 1
- Rental income
- $24,230
- − Mortgage interest
- −$15,124
- − Property taxes
- −$812
- − Insurance
- −$1,350
- − Repairs & maintenance
- −$1,938
- − Management
- −$1,938
- − Depreciation
- −$7,855
- Taxable loss
- −$4,787
- Est. tax savings @ 24.0%
- +$1,149
- After-tax cash flow
- $1,138/yr
For passive investors: Depreciation is non-cash, so a rental often shows a tax loss while cash-flowing — sheltering income. Rental losses are passive: they offset passive income freely, and up to $25,000/yr can offset ordinary (W-2) income if you actively participate and your MAGI is under $100k (phasing out to $0 by $150k); unused losses carry forward. On sale, claimed depreciation is recaptured at up to 25%, and gains may owe capital-gains tax (a 1031 exchange can defer both). Figures are a year-1 estimate at your 24.0% rate — not tax advice; consult a CPA.
Schools (NCES district)
- District
- Lee
- NCES district ID
- 1201080
- Math proficiency
- 47% ▼ -11.00%
- Reading proficiency
- 50% ▼ -4.00%
- Median HH income
- $49,518
- Composite
- 41.49/100
- National rank
- #3458
- State rank
- #42 of 73 in FL
Livability — Lehigh Acres
- Score
- 59/100
- State rank
- #826
- US rank
- #20055
Category grades
Schools grade is shown separately in the Schools card above.
Census & demographics
- Census place
- Lehigh Acres, FL
- County
- Lee County · 788,662 people
- City population
- 130,638
- Metro
- Cape Coral-Fort Myers, FL
- Population (ZIP)
- 19,927
- Household income
- $72,192
- Rent vs Own
- Severe rent burden
- 434.0
Population outlook (Lee County) Hauer SSP2
- Today (2025)
- 871,946 people
- By 2030
- 955,468 · +9.6%
- By 2040
- 1,113,587 · +27.7%
- By 2050
- 1,256,891 · +44.1%
- By 2075
- 1,560,270 · +78.9%
- By 2100
- 1,726,848 · +98.0%
Race, ethnicity, and origin ACS 2023
- Neighborhood character
- Diverse neighborhood (Simpson 0.64)
- Race & ethnicity
- Hispanic / Latino 52% Two or more races 31% White 26% Black 18%
- Hispanic origin (detail)
- Mexican 12% Puerto Rican 7% Cuban 20% Dominican 4%
- Common ancestry
- Hispanic 7% Italian 1% Portuguese 1%
- Foreign-born
- 32% · Canada, Jamaica
- Languages at home
- 48% English-only · Spanish 43% French/Haitian/Cajun 7% Other Indo-European 1%
Political lean MEDSL · Lee
- 2024 margin
- Strong R (+28.4) · D 35.5% · R 63.9%
- 2008→2024 swing
- -18.0pp toward R · 2008: -10.4pp · 2024: -28.4pp
- All cycles
- 2024: R+28.4 2020: R+19.2 2016: R+20.4 2012: R+16.6 2008: R+10.4
Not yet ingested
- Civics
- —
Market trends
- HPI YoY
- ▲ 16.53%
- Current HPI
- 303.3399
- Rent YoY
- ▼ -4.68%
- Metro
- Cape Coral-Fort Myers, FL
- State GDP YoY
- ▲ 3.28%
- F500 in state
- 36
Industry mix (Fortune 500 HQ in FL)
| Industry | F500 HQs | Revenue |
|---|---|---|
| Industrial Technology | 2 | $29B |
|
||
| Insurance | 2 | $17B |
|
||
| Retail | 1 | $60B |
|
||
| Technology Distribution | 1 | $58B |
|
||
| Homebuilding | 1 | $35B |
|
||
| Technology Manufacturing | 1 | $35B |
|
||
Price history
+980.0% since first listed19 events — show timeline
- 2026-04-23 Listed $270,000 NAPLESMLS
- 2026-04-23 Listed $270,000 MARMLS
- 2025-12-31 Listing Removed — FORTMLS
- 2025-11-17 Price Changed $299,900 FORTMLS
- 2025-11-07 Price Changed $309,900 FORTMLS
- 2025-07-17 Listed $315,000 FORTMLS
- 2025-05-29 Listing Removed — MARMLS
- 2025-05-29 Listing Removed — NAPLESMLS
- 2025-04-29 Listed $300,000 MARMLS
- 2025-04-22 Price Changed $300,000 NAPLESMLS
- 2025-03-14 Price Changed $335,000 NAPLESMLS
- 2025-02-10 Price Changed $345,997 NAPLESMLS
- 2025-01-23 Listed $349,997 NAPLESMLS
- 2025-01-21 Listing Removed — FORTMLS
- 2024-12-12 Price Changed $349,997 FORTMLS
- 2024-11-15 Listed $364,000 FORTMLS
- 2024-01-29 Sold (Public Records) $14,000 Public Records
- 2017-10-11 Sold (Public Records) $86,600 Public Records
- 2005-03-07 Sold (Public Records) $25,000 Public Records
Property tax history
+59.3%/yrLatest (2025): $812 · +130.9% YoY. Source: county tax records.
Cash-flow waterfall
monthlySold comps — $/sqft
last 12 mo · ≤1 miLoading sold comps…