 🏷️ Likely Rental
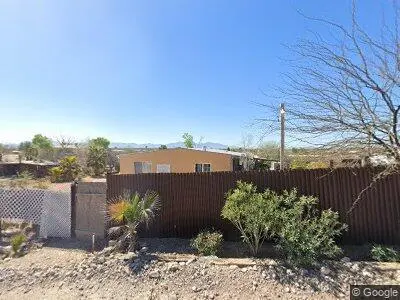
10281 S Summit Peak Pl · Summit, AZ
Flood risk 1/10 · Minimal
- FEMA flood zone
- X (unshaded)
- Chance of flooding over 30 yrs
- 0.0%
- Est. flood insurance / yr
- $507 – $1,088
Fire risk 7/10 · Major
- Est. fire insurance / yr
- $610 – $1,132
Heat risk 8/10 · Major
- Hot days now (above 106°F)
- 7 days/yr
- Hot days in 30 yrs
- 18 days/yr
Wind risk 1/10 · Minimal
- Chance of severe wind over 30 yrs
- —
Air-quality risk 1/10 · Minimal
- Unhealthy air days now
- 0 days/yr
- Unhealthy air days in 30 yrs
- 0 days/yr
Risk factors via First Street. Map © Google.
Why this score? — see what drove the C+ grade
The composite is a weighted blend of 9 inputs, each scored 0–100. Each bar is that input's sub-score; the figure is the points it added to the 100-point composite (weight × sub-score).
- Cash flow +24.8/30.0
- ARV discount +15.0/15.0
- DSCR +8.1/10.0
- 1% rule +5.1/10.0
- Rent growth +2.9/5.0
- Livability +2.8/5.0
- Condition / age +2.5/5.0
- Schools +1.0/10.0
- Appreciation +0.0/10.0
$167,500
🖨 Deal sheet 📄 Offer letter ✓ Due diligence
Listing remarks
Nice area in Summit. Acre lot with a mobile home and large addition. Newer septic system. Longtime renters are leaving (paid 1750 per month) also has a camper that rented for 500. Has potential to rent for 2,250 and with a sale price of 167,500 this is a great deal.
Key facts
- Built 2001
- Listed 37 days
Neighborhood map
What this means for you Summary
Snapshot
- This is a 2-bed/1.0-bath manufactured listed at $168k.
Deal economics
- At list price, monthly cash flow is $356 ($4k/yr) — positive.
- The deal already cash-flows at list — no discount required.
- Meets the 1% rule at list price ($2k rent vs $168k).
- Recommended offer: $162k (3.0% below list) — sets the bar for market timing.
Location & tenants
- Location reads 56/100 on livability (#254 in AZ) — a working-class tenant base; expect higher turnover. Strengths: cost of living A+, housing A+; Watch: schools F, crime F, amenities F.
- Sunnyside Unified District (4407) (urban): math 9% / reading 15% proficiency, ranked #233 of 249 in AZ (top 94%) — low school quality limits family demand, transient renter base, plan for 1-2y turnover.
- Market conditions: Rents rising (+1.5%/yr); 158 active listings in the ZIP; 5,268 units permitted in Pima County in 2024 (996 in 5+ unit buildings).
Forward outlook
- Local home prices are declining (-3.0%/yr); year-one equity from $1k of loan paydown is wiped out by about $5k of value loss. Plan a longer hold.
- Pima County population projected at +8% by 2050 — modest demand growth; plan on rents tracking national, not racing it.
Negotiation context
- It's been on market 37 days — a 3% lower offer ($162k) is reasonable based on typical stale-listing flexibility.
- 5 sale attempts since 2y ago with the ask held roughly flat each time — persistent listings suggest the price (not the market) is what's stuck; bring a comps-based counter.
- Current owner paid $110k; list at $168k implies a 52% gain — meaningful room to come down on a strong offer.
Risks & watch-outs
- Climate carrying-cost: major wildfire risk; extreme-heat days projected 7→18/yr by 2055 (HVAC capex compounding) — expect insurance premiums to compound above CPI over the hold.
Questions for the listing agent
- It's been on market 37 days. Have you received any prior offers? Is the seller open to a 3% concession, seller financing, or rate buy-down credit?
- Is there a deadline driving the sale (1031 exchange, divorce, estate, relocation)? That informs how much negotiation room exists.
- Schools are F-rated, which usually means shorter tenancies and higher turnover. Who's the typical renter profile here, and what's been the actual vacancy rate?
- Crime grade is F in this area — have there been break-ins, vandalism, or insurance claims at this property in the last 3 years? What carrier currently insures it and at what premium?
- What's the average days-on-market for RENTAL listings here right now (not sales)? A rising rental-DOM trend means longer vacancies and softer asking-rent achievability than the comps imply.
- What's the recent tenant-quality profile in this submarket — average credit score on applications, eviction rate, late-payment / NSF rate, and stable-employment percentage? A property-management company in the area should have these aggregated.
- How much new for-sale + rental construction is in the pipeline within 1–3 miles? Heavy new supply typically softens prices + rents 12–24 months out; constrained supply supports both.
Investment metrics
- 1% rule
- 1.01% ✓
- Cap rate
- 8.84%
- Cash-on-cash
- 9.11%
- DSCR
- 1.41
- GRM
- 8.2
CMA / ARV
- ARV (on-the-fly)
- $231,600
- Comps found
- 3
Show comp detail 3 sales within ~0.75 mi
| Address | Dist | Beds/Ba | Sqft | Sold | Price | $/sf | Match |
|---|---|---|---|---|---|---|---|
| 10430 S Epperson Ln | 0.30mi | 3/2.0 (+1) | 1,344 (+12%) | 13mo | $255,000 | $190 | 46 |
| 9876 S Cactus Apple Ln | 0.70mi | 3/2.0 (+1) | 1,344 (+12%) | 2mo | $262,000 | $195 | 37 |
| 9805 S Desert Brush Loop | 0.59mi | 3/2.0 (+1) | 1,344 (+12%) | 20mo | $260,000 | $193 | 27 |
Match score weights: distance 35% · size 25% · config 20% · recency 20%. Top-matched comps best support the ARV.
Projected returns pro-forma
-3.0% appreciation · 1.52% rent growth · sell at horizon
- IRR
- -4.1%
- Equity multiple
- 0.85×
- Total profit
- $-7,047
- Equity at exit
- $24,975
- IRR
- 4.0%
- Equity multiple
- 1.27×
- Total profit
- $12,804
- Equity at exit
- $14,482
Cash invested: $46,900 (down + closing). Projections, not guarantees.
Landlord ↔ Tenant lean methodology
- Overall (STATE)
- 87 Strongly Landlord-Friendly
- State Arizona
- 87 Strongly Landlord-Friendly · R+3
- County
- — inherits STATE
- City
- — inherits STATE
ZIP-level market 85756
- Home prices YoY
- -19.4%
- Rents YoY
- 1.5%
- Active inventory
- 158
- Price-to-rent
- 8.2×
Monthly cashflow live
- Estimated rent
- $1,696 medium interval (Pro) →
- Mortgage (P&I)
- −$878
- Tax from tax record
- −$36 /mo · $432/yr
- Insurance
- −$70
- HOA
- −$0
- Vacancy / Maint / Mgmt
- −$356
- Net cashflow
- $356
Break-even live
UW: 25.0% down · 7.5% · 30yr · 1.5% tax · 5.0% vac · 8.0% maint · 8.0% mgmt
Financing live
Cash to close
- Down payment
- $41,875
- Closing costs
- $5,025
- Reserves months
- —
- Total cash needed
- —
Loan-product check · same deal, 3 products live
Conventional
25% down · 7.5% · 30yr
- Down + closing
- —
- Monthly P&I
- —
- Monthly cashflow
- —
- DSCR
- —
- Eligible?
- —
Personal DTI + credit; lowest rate.
DSCR
20% down · 8.5% · 30yr
- Down + closing
- —
- Monthly P&I
- —
- Monthly cashflow
- —
- DSCR
- —
- Eligible?
- —
No personal income docs; deal must DSCR.
Hard money
10% down · 12.0% · 12mo
- Down + closing
- —
- Monthly P&I
- —
- Monthly cashflow
- —
- DSCR
- —
- Eligible?
- —
Short-term bridge; refi at stabilization.
Listing history 33 events
-
2026-06-18days on market $167,500 Active 37 DOM
-
2026-06-17days on market $167,500 Active 36 DOM
-
2026-06-16days on market $167,500 Active 35 DOM
-
2026-06-15days on market $167,500 Active 34 DOM
-
2026-06-13days on market $167,500 Active 32 DOM
-
2026-06-13days on market $167,500 Active 31 DOM
-
2026-06-10days on market $167,500 Active 29 DOM
-
2026-06-09days on market $167,500 Active 28 DOM
-
2026-06-08days on market $167,500 Active 27 DOM
-
2026-06-07days on market $167,500 Active 26 DOM
-
2026-06-05days on market $167,500 Active 23 DOM
-
2026-06-03days on market $167,500 Active 22 DOM
-
2026-06-02days on market $167,500 Active 21 DOM
-
2026-06-01days on market $167,500 Active 20 DOM
-
2026-05-31days on market $167,500 Active 19 DOM
-
2026-05-12$167,500 Active 269-char remark
-
2026-01-14historical
-
2025-11-15status Active
-
2025-11-10historical
-
2025-11-06price $190,000
-
2025-09-11$197,500 Active
-
2024-09-16soldstatus $110,000
-
2024-08-10historical Active Contingent
-
2024-08-09historical
-
2024-08-05price $115,000
-
2024-08-05status Active
-
2024-08-01historical Active Contingent
-
2024-07-29price $135,000
-
2024-07-18price $150,000
-
2024-07-10price $159,999
-
2024-06-06$165,000 Active
-
2012-02-16soldstatus $47,000
-
2001-06-06soldstatus $34,000
ⓘ Source: listings_history table (triggers on properties + properties_extension) + one-shot
backfill from property_details.listing_events for pre-trigger history.
Tax reassessment forecast AZ · Resets to sale price
- Current annual tax
- $432 · $36/mo
- Projected year-2 tax
- $1,106 · $92/mo
- Expected delta
- +$674/yr (+$56/mo · 156.1%)
ⓘ Screening estimate from a state-policy table — verify with the county assessor before closing.
Climate risk First Street
- Flood 1/10 Low FEMA zone X (unshaded) · 0% chance over 30 yrs
- Wildfire 7/10 Severe
- Heat 8/10 Severe 7 d/yr ≥106°F today · 18 d/yr by 30 yrs out
- Wind 1/10 Low
- Air quality 1/10 Low 0 unhealthy d/yr today · 0 by 30 yrs out
Nearby sold comps map
Loading sold comps map…
Walkable amenities ~0.75 mi
Loading nearby amenities…
Taxation est. · year 1
- Rental income
- $20,355
- − Mortgage interest
- −$9,383
- − Property taxes
- −$432
- − Insurance
- −$838
- − Repairs & maintenance
- −$1,628
- − Management
- −$1,628
- − Depreciation
- −$4,873
- Taxable income
- $1,573
- Est. tax owed @ 24.0%
- −$378
- After-tax cash flow
- $3,893/yr
For passive investors: Depreciation is non-cash, so a rental often shows a tax loss while cash-flowing — sheltering income. Rental losses are passive: they offset passive income freely, and up to $25,000/yr can offset ordinary (W-2) income if you actively participate and your MAGI is under $100k (phasing out to $0 by $150k); unused losses carry forward. On sale, claimed depreciation is recaptured at up to 25%, and gains may owe capital-gains tax (a 1031 exchange can defer both). Figures are a year-1 estimate at your 24.0% rate — not tax advice; consult a CPA.
Schools (NCES district)
- District
- Sunnyside Unified District (4407)
- NCES district ID
- 0408170
- Math proficiency
- 9% ▼ -21.00%
- Reading proficiency
- 15% ▼ -14.00%
- Median HH income
- $34,365
- Composite
- 9.76/100
- National rank
- #9827
- State rank
- #233 of 249 in AZ
Livability — Summit
- Score
- 56/100
- State rank
- #254
- US rank
- #23040
Category grades
Schools grade is shown separately in the Schools card above.
Census & demographics
- Census place
- Summit, AZ
- County
- Pima County · 1,012,107 people
- Metro
- Tucson, AZ
- Population (ZIP)
- 37,700
- Household income
- $72,490
- Rent vs Own
- Severe rent burden
- 265.0
Population outlook (Pima County) Hauer SSP2
- Today (2025)
- 1,066,056 people
- By 2030
- 1,086,684 · +1.9%
- By 2040
- 1,117,160 · +4.8%
- By 2050
- 1,149,778 · +7.9%
- By 2075
- 1,271,480 · +19.3%
- By 2100
- 1,321,160 · +23.9%
Race, ethnicity, and origin ACS 2023
- Neighborhood character
- Diverse neighborhood (Simpson 0.56)
- Race & ethnicity
- Hispanic / Latino 59% White 29% Two or more races 23% Black 7% Native American 4% Asian 2%
- Hispanic origin (detail)
- Mexican 49%
- Common ancestry
- Italian 2% Slovak 1% Portuguese 1%
- Foreign-born
- 18% · Canada, China
- Languages at home
- 57% English-only · Spanish 39% Chinese 1%
Political lean MEDSL · Pima
- 2024 margin
- D (+15.2) · D 57.0% · R 41.8% · Other 1.2%
- 2008→2024 swing
- +9.1pp toward D · 2008: 6.1pp · 2024: 15.2pp
- All cycles
- 2024: D+15.2 2020: D+18.7 2016: D+13.5 2012: D+5.8 2008: D+6.1
Not yet ingested
- Civics
- —
Market trends
- HPI YoY
- ▼ -73.28%
- Current HPI
- 304.0243
- Rent YoY
- ▲ 1.52%
- Metro
- Tucson, AZ
- State GDP YoY
- ▲ 4.54%
- F500 in state
- 20
Industry mix (Fortune 500 HQ in AZ)
| Industry | F500 HQs | Revenue |
|---|---|---|
| Technology | 2 | $13B |
|
||
| Mining / Metals | 1 | $23B |
|
||
| Environmental Services | 1 | $16B |
|
||
| Metals / Steel | 1 | $14B |
|
||
| Technology Distribution | 1 | $9B |
|
||
| Homebuilding | 1 | $8B |
|
||
Price history
+392.6% since first listed18 events — show timeline
- 2026-05-12 Listed $167,500 FSBO.com
- 2026-01-14 Listing Removed — MLSSAZ
- 2025-11-15 Relisted — MLSSAZ
- 2025-11-10 Listing Removed — MLSSAZ
- 2025-11-06 Price Changed $190,000 MLSSAZ
- 2025-09-11 Listed $197,500 MLSSAZ
- 2024-09-16 Sold (Public Records) $110,000 Public Records
- 2024-08-10 Contingent — MLSSAZ
- 2024-08-09 Listing Removed — MLSSAZ
- 2024-08-05 Price Changed $115,000 MLSSAZ
- 2024-08-05 Relisted — MLSSAZ
- 2024-08-01 Contingent — MLSSAZ
- 2024-07-29 Price Changed $135,000 MLSSAZ
- 2024-07-18 Price Changed $150,000 MLSSAZ
- 2024-07-10 Price Changed $159,999 MLSSAZ
- 2024-06-06 Listed $165,000 MLSSAZ
- 2012-02-16 Sold (Public Records) $47,000 Public Records
- 2001-06-06 Sold (Public Records) $34,000 Public Records
Property tax history
+1.0%/yrLatest (2025): $432 · +5.7% YoY. Source: county tax records.
Cash-flow waterfall
monthlySold comps — $/sqft
last 12 mo · ≤1 miLoading sold comps…