 🏗️ New Construction
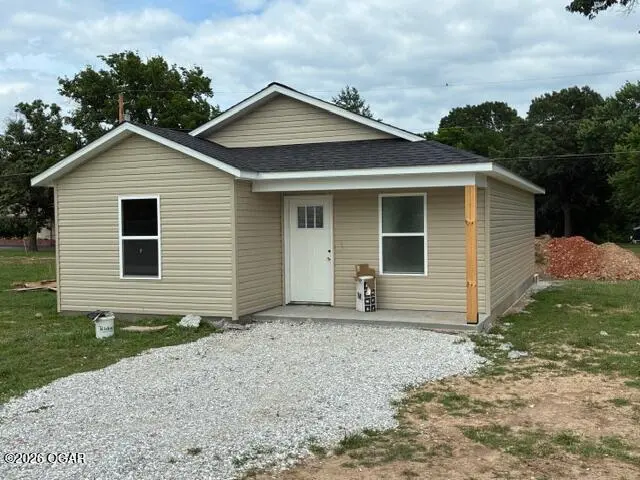
306 Stone Cottage Dr · Sarcoxie, MO
Flood risk 1/10 · Minimal
- FEMA flood zone
- X (unshaded)
- Chance of flooding over 30 yrs
- 0.0%
- Est. flood insurance / yr
- $507 – $1,088
Fire risk 4/10 · Minor
- Est. fire insurance / yr
- $1,054 – $1,958
Heat risk 5/10 · Moderate
- Hot days now (above 106°F)
- 7 days/yr
- Hot days in 30 yrs
- 20 days/yr
Wind risk 2/10 · Minimal
- Chance of severe wind over 30 yrs
- 1.0%
Air-quality risk 2/10 · Minimal
- Unhealthy air days now
- 0 days/yr
- Unhealthy air days in 30 yrs
- 1 days/yr
Risk factors via First Street. Map © Google.
Why this score? — see what drove the D- grade
The composite is a weighted blend of 9 inputs, each scored 0–100. Each bar is that input's sub-score; the figure is the points it added to the 100-point composite (weight × sub-score).
- Appreciation +10.0/10.0
- ARV discount +7.5/15.0
- Cash flow +7.1/30.0
- Livability +3.4/5.0
- Schools +2.6/10.0
- Rent growth +2.5/5.0
- Condition / age +2.5/5.0
- 1% rule +2.0/10.0
- DSCR +1.3/10.0
$122,000
🖨 Deal sheet (PDF) 📄 Offer letter ✓ Due diligence
Listing remarks
High quality new construction home for not a lot of money. Home to be completed on July 24th. This property does have solid surface countertops. range, refrigerator, microwave hood and dishwasher. Flooring will be LVP throughout and does have a covered front porch. Open style floor plan.
Key facts
- Covered front porch
- 0.3 acre lot
- Built 2026
Tags
Property features AI
Exterior
- Parking: Parking pad
- Utilities: Public sewer
- Home design: Single family residence (freestanding); Residential property; Under construction
- Construction: Vinyl siding; Composition roof; Slab foundation; Under construction
- Exterior features: Covered porch; Porch; Level topography; 102 x 132 lot dimensions
Interior
- Kitchen: Electric range; Refrigerator; Disposal; Dishwasher
- Flooring: Vinyl flooring
- Bathrooms: 1 full bathroom
- Heating & cooling: Central heating; Electric heating; Ceiling fan(s) for cooling
- Interior features: Ceiling fan(s); Eat-in kitchen; 5 total rooms
Neighborhood map
What this means for you Summary
Snapshot
- This is a 2-bed/1.0-bath single-family listed at $122k.
Deal economics
- At list price, monthly cash flow is $-177 ($-2k/yr) — negative.
- To cash-flow at today's rent, offer at most $99k (18.6% below list).
- To meet the 1% rule (rent ≥ 1% of price), the offer needs to be $87k (28.8% below list).
- Recommended offer: $87k (28.8% below list) — sets the bar for 1% rule.
Location & tenants
- Location reads 68/100 on livability (#190 in MO) — a middle-class / working-renter tenant base. Strengths: cost of living A+, health & safety A, crime B+; Watch: employment D, amenities F, commute F.
- Sarcoxie R-II (rural): math 30% / reading 32% proficiency, ranked #265 of 324 in MO (top 82%) — families likely to look elsewhere, expect single-tenant / working-renter base with shorter leases.
- Zoned schools: Wildwood Elem. (math 37% / reading 37%, grade F, #611 of 1,115 statewide, top 59%, 285 students, 70% FRL); Sarcoxie High (math 27% / reading 29%, grade F, #414 of 521 statewide, top 80%, 401 students, 72% FRL).
- Market conditions: 20 active listings in the ZIP; 2 comparable units currently listed for rent nearby; 602 units permitted in Jasper County in 2024 (0 in 5+ unit buildings).
Forward outlook
- In year one you build about $13k of equity ($864 loan paydown + $12k appreciation (10.0% local appreciation)).
- By year 3, paydown + projected appreciation supports a ~$34k cash-out refi (75% LTV) — recoverable capital for the next deal without selling this one.
Negotiation context
- Only 6 days on market — expect competitive offers; lowballing is unlikely to land.
Risks & watch-outs
- Climate carrying-cost: extreme-heat days projected 7→20/yr by 2055 (HVAC capex compounding) — expect insurance premiums to compound above CPI over the hold.
Questions for the listing agent
- What do current leases actually rent for vs. the listed asking? Can we see a recent rent roll and the last 12 months of T-12 income?
- Is there a deadline driving the sale (1031 exchange, divorce, estate, relocation)? That informs how much negotiation room exists.
- Schools are D-rated, which usually means shorter tenancies and higher turnover. Who's the typical renter profile here, and what's been the actual vacancy rate?
- The area grade is low — what's the realistic commute time and amenity access for the typical tenant pool here? Any planned neighborhood developments (good or bad) we should know about?
- What's the average days-on-market for RENTAL listings here right now (not sales)? A rising rental-DOM trend means longer vacancies and softer asking-rent achievability than the comps imply.
- What's the recent tenant-quality profile in this submarket — average credit score on applications, eviction rate, late-payment / NSF rate, and stable-employment percentage? A property-management company in the area should have these aggregated.
- How much new for-sale + rental construction is in the pipeline within 1–3 miles? Heavy new supply typically softens prices + rents 12–24 months out; constrained supply supports both.
Investment metrics
- 1% rule
- 0.70% ✗
- Cap rate
- 4.59%
- Cash-on-cash
- -6.09%
- DSCR
- 0.73
- GRM
- 12.0
CMA / ARV
- ARV (on-the-fly)
- $124,944
- Comps found
- 3
Show comp detail 3 sales within ~0.75 mi
| Address | Dist | Beds/Ba | Sqft | Sold | Price | $/sf | Match |
|---|---|---|---|---|---|---|---|
| 6th 118 St | 0.50mi | 2/1.0 | 824 (+0%) | 1mo | $125,000 | $152 | 75 |
| 1308 Washington St | 0.14mi | 2/1.0 | 945 (+15%) | 5mo | $39,900 | $42 | 65 |
| 805 Joplin Street St | 0.58mi | 1/1.0 (-1) | 750 (-9%) | 14mo | $160,000 | $213 | 41 |
Match score weights: distance 35% · size 25% · config 20% · recency 20%. Top-matched comps best support the ARV.
Projected returns pro-forma
10.0% appreciation · 3.0% rent growth · sell at horizon
- IRR
- 20.0%
- Equity multiple
- 2.62×
- Total profit
- $56,760
- Equity at exit
- $112,559
- IRR
- 18.3%
- Equity multiple
- 6.03×
- Total profit
- $176,061
- Equity at exit
- $242,739
Cash invested: $34,984 (down + closing). Projections, not guarantees.
Landlord ↔ Tenant lean methodology
- Overall (STATE)
- 81 Strongly Landlord-Friendly
- State Missouri
- 81 Strongly Landlord-Friendly · R+10
- County
- — inherits STATE
- City
- — inherits STATE
ZIP-level market 64862
- Home prices YoY
- 19.6%
- Active inventory
- 20
- Price-to-rent
- 11.7×
Monthly cashflow live
- Estimated rent
- $868 medium interval (Pro) →
- Mortgage (P&I)
- −$655
- Tax est. 1.5%
- −$156 /mo · $1,874/yr
- Insurance
- −$52
- HOA
- −$0
- Vacancy / Maint / Mgmt
- −$182
- Net cashflow
- $-177
Break-even live
Sensitivity live
| Price | -10% $-91 | -5% $-134 | +0% $-177 | +5% $-221 | +10% $-264 |
|---|---|---|---|---|---|
| Rent | -10% $-246 | -5% $-212 | +0% $-177 | +5% $-143 | +10% $-109 |
| Rate | -1.0pp $-115 | -0.5pp $-146 | base $-177 | +0.5pp $-210 | +1.0pp $-243 |
UW: 25.0% down · 7.5% · 30yr · 1.5% tax · 5.0% vac · 8.0% maint · 8.0% mgmt
Financing live
Cash to close
- Down payment
- $31,236
- Closing costs
- $3,748
- Reserves months
- —
- Total cash needed
- —
Loan-product check · same deal, 3 products live
Conventional
25% down · 7.5% · 30yr
- Down + closing
- —
- Monthly P&I
- —
- Monthly cashflow
- —
- DSCR
- —
- Eligible?
- —
Personal DTI + credit; lowest rate.
DSCR
20% down · 8.5% · 30yr
- Down + closing
- —
- Monthly P&I
- —
- Monthly cashflow
- —
- DSCR
- —
- Eligible?
- —
No personal income docs; deal must DSCR.
Hard money
10% down · 12.0% · 12mo
- Down + closing
- —
- Monthly P&I
- —
- Monthly cashflow
- —
- DSCR
- —
- Eligible?
- —
Short-term bridge; refi at stabilization.
Rent comps 2 comps
| Address | Beds | Baths | Sqft | Rent | $/sqft | DOM | Units | Dist |
|---|---|---|---|---|---|---|---|---|
| 201 S 9th St #4 Sarcoxie, MO | 3.0 | 2.0 | 1100 | $1,000 | $0.91 | 15d | 1 | 0.38mi |
| 400 High St Unit 1A Sarcoxie, MO | 1.0 | 1.0 | 600 | $653 | $1.09 | 23d | 1 | 0.61mi |
Listing history 7 events
-
2026-06-18status $122,000 Pending 6 DOM
-
2026-06-18days on market $122,000 Active 6 DOM
-
2026-06-17days on market $122,000 Active 5 DOM
-
2026-06-16days on market $122,000 Active 4 DOM
-
2026-06-15days on market $122,000 Active 3 DOM
-
2026-06-13remarks 288-char remark
-
2026-06-13$122,000 Active 1 DOM
ⓘ Source: listings_history table (triggers on properties + properties_extension) + one-shot
backfill from property_details.listing_events for pre-trigger history.
Climate risk First Street
- Flood 1/10 Low FEMA zone X (unshaded) · 0% chance over 30 yrs
- Wildfire 4/10 Moderate
- Heat 5/10 Major 7 d/yr ≥106°F today · 20 d/yr by 30 yrs out
- Wind 2/10 Low 100% chance of damaging wind over 30 yrs
- Air quality 2/10 Low 0 unhealthy d/yr today · 1 by 30 yrs out
Nearby sold comps map
Loading sold comps map…
Walkable amenities ~0.75 mi
Loading nearby amenities…
Taxation est. · year 1
- Rental income
- $10,421
- − Mortgage interest
- −$6,999
- − Property taxes
- −$1,874
- − Insurance
- −$625
- − Repairs & maintenance
- −$834
- − Management
- −$834
- − Depreciation
- −$3,635
- Taxable loss
- −$4,379
- Est. tax savings @ 24.0%
- +$1,051
- After-tax cash flow
- $-1,078/yr
For passive investors: Depreciation is non-cash, so a rental often shows a tax loss while cash-flowing — sheltering income. Rental losses are passive: they offset passive income freely, and up to $25,000/yr can offset ordinary (W-2) income if you actively participate and your MAGI is under $100k (phasing out to $0 by $150k); unused losses carry forward. On sale, claimed depreciation is recaptured at up to 25%, and gains may owe capital-gains tax (a 1031 exchange can defer both). Figures are a year-1 estimate at your 24.0% rate — not tax advice; consult a CPA.
Schools (NCES district)
- District
- Sarcoxie R-II
- NCES district ID
- 2927540
- Math proficiency
- 30% ▼ -2.00%
- Reading proficiency
- 32% ▼ -13.00%
- Median HH income
- $38,365
- Composite
- 25.92/100
- National rank
- #7337
- State rank
- #265 of 324 in MO
Livability — Sarcoxie
- Score
- 68/100
- State rank
- #190
- US rank
- #9931
Category grades
Schools grade is shown separately in the Schools card above.
Census & demographics
- Census place
- Sarcoxie, MO
- Population (ZIP)
- 3,214
Population outlook (Jasper County) Hauer SSP2
- Today (2025)
- 120,033 people
- By 2030
- 120,091 · +0.0%
- By 2040
- 119,297 · -0.6%
- By 2050
- 117,705 · -1.9%
- By 2075
- 110,402 · -8.0%
- By 2100
- 99,719 · -16.9%
Race, ethnicity, and origin ACS 2023
- Neighborhood character
- Predominantly White (94%)
- Race & ethnicity
- White 94% Two or more races 5% Hispanic / Latino 2%
- Common ancestry
- Lithuanian 3% Slovak 1% Serbian 1%
- Foreign-born
- 0%
- Languages at home
- 99% English-only · German/W. Germanic 1%
Political lean MEDSL · Jasper
- 2024 margin
- Solid R (+46.8) · D 25.9% · R 72.7% · Other 1.4%
- 2008→2024 swing
- -13.6pp toward R · 2008: -33.2pp · 2024: -46.8pp
- All cycles
- 2024: R+46.8 2020: R+46.2 2016: R+50.8 2012: R+41.0 2008: R+33.2
Not yet ingested
- Civics
- —
Market trends
- HPI YoY
- ▲ 46.24%
- Current HPI
- 282.5337
- Rent YoY
- —
- Metro
- —
- State GDP YoY
- ▲ 1.84%
- F500 in state
- 20
Industry mix (Fortune 500 HQ in MO)
| Industry | F500 HQs | Revenue |
|---|---|---|
| Healthcare | 1 | $163B |
|
||
| Insurance | 1 | $21B |
|
||
| Industrial Technology | 1 | $17B |
|
||
| Retail | 1 | $16B |
|
||
| Industrial Distribution | 1 | $10B |
|
||
| Utilities | 1 | $9B |
|
||
Price history
1 event — show timeline
- 2026-06-12 Listed $122,000 OGAR
Cash-flow waterfall
monthlySold comps — $/sqft
last 12 mo · ≤1 miLoading sold comps…