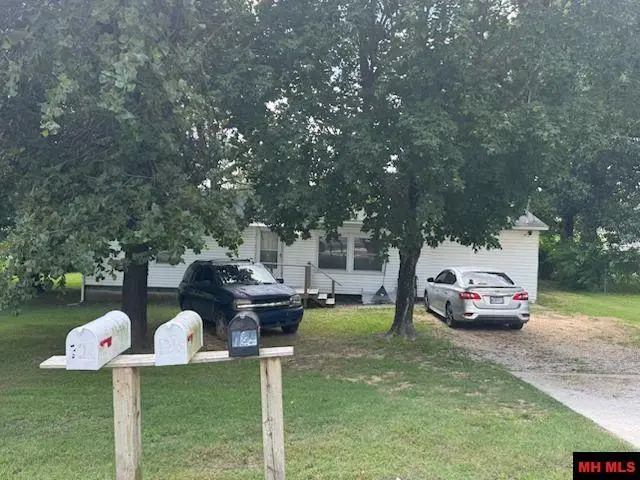
724 Gentry St · Mountain Home, AR
Flood risk 1/10 · Minimal
- FEMA flood zone
- X (unshaded)
- Chance of flooding over 30 yrs
- 0.0%
- Est. flood insurance / yr
- $507 – $1,088
Fire risk 4/10 · Minor
- Est. fire insurance / yr
- $1,499 – $2,785
Heat risk 5/10 · Moderate
- Hot days now (above 105°F)
- 7 days/yr
- Hot days in 30 yrs
- 20 days/yr
Wind risk 2/10 · Minimal
- Chance of severe wind over 30 yrs
- 1.0%
Air-quality risk 1/10 · Minimal
- Unhealthy air days now
- 0 days/yr
- Unhealthy air days in 30 yrs
- 0 days/yr
Risk factors via First Street. Map © Google.
Why this score? — see what drove the B+ grade
The composite is a weighted blend of 9 inputs, each scored 0–100. Each bar is that input's sub-score; the figure is the points it added to the 100-point composite (weight × sub-score).
- Cash flow +30.0/30.0
- ARV discount +15.0/15.0
- DSCR +10.0/10.0
- 1% rule +8.9/10.0
- Schools +3.7/10.0
- Livability +3.5/5.0
- Rent growth +2.5/5.0
- Condition / age +2.5/5.0
- Appreciation +0.0/10.0
$85,000
🖨 Deal sheet (PDF) 📄 Offer letter ✓ Due diligence
Listing remarks
Great income producing property. In-town location next to schools with all city utilities. 3 bedroom, 1 bath on level lot with fenced yard.
Key facts
- Fenced yard
- In-town location
- Listed 17 days
Tags
Property features AI
Exterior
- Home design: Manufactured home; Residential property
- Construction: Vinyl siding
Interior
- Kitchen: Electric oven; Electric range
- Bathrooms: 1 full bathroom
- Heating & cooling: Central electric heating; Central electric cooling
- Interior features: Electric oven; Electric range
Neighborhood map
What this means for you Summary
Snapshot
- This is a 3-bed/1.0-bath single-family listed at $85k.
Deal economics
- At list price, monthly cash flow is $401 ($5k/yr) — positive.
- The deal already cash-flows at list — no discount required.
- Meets the 1% rule at list price ($1k rent vs $85k).
- Recommended offer: $84k (1.5% below list) — sets the bar for market timing.
- Cap rate 12.0% vs local median 3.0% in Mountain Home — top-decile yield for the area; either an underpriced asset or a hidden risk that comps aren't pricing in. Stress-test before assuming the spread holds.
Location & tenants
- Location reads 70/100 on livability (#54 in AR) — a middle-class / working-renter tenant base. Strengths: cost of living A+, housing A+, health & safety A+; Watch: schools C-, amenities F, commute F.
- Mountain Home School District (town): math 45% / reading 45% proficiency, ranked #40 of 238 in AR (top 17%) — families likely to look elsewhere, expect single-tenant / working-renter base with shorter leases.
- Market conditions: 384 active listings in the ZIP; 1 comparable units currently listed for rent nearby; 47 units permitted in Baxter County in 2024 (0 in 5+ unit buildings).
Forward outlook
- Local home prices are declining (-3.0%/yr); year-one equity from $588 of loan paydown is wiped out by about $3k of value loss. Plan a longer hold.
- Baxter County population projected to shrink 9% by 2050 — rents likely to lag national; underwrite the cash flow, not the appreciation.
- At projected returns (-3.0% appreciation + 3.0% rent growth), your $24k cash investment doubles in ~7 years — after that, you're playing with house money.
Negotiation context
- It's been on market 18 days — a 2% lower offer ($84k) is reasonable based on typical stale-listing flexibility.
- Current owner paid $45k; list at $85k implies a 89% gain — meaningful room to come down on a strong offer.
Risks & watch-outs
- Climate carrying-cost: extreme-heat days projected 7→20/yr by 2055 (HVAC capex compounding) — expect insurance premiums to compound above CPI over the hold.
Questions for the listing agent
- Is there a deadline driving the sale (1031 exchange, divorce, estate, relocation)? That informs how much negotiation room exists.
- What's the average days-on-market for RENTAL listings here right now (not sales)? A rising rental-DOM trend means longer vacancies and softer asking-rent achievability than the comps imply.
- What's the recent tenant-quality profile in this submarket — average credit score on applications, eviction rate, late-payment / NSF rate, and stable-employment percentage? A property-management company in the area should have these aggregated.
- How much new for-sale + rental construction is in the pipeline within 1–3 miles? Heavy new supply typically softens prices + rents 12–24 months out; constrained supply supports both.
Investment metrics
- 1% rule
- 1.39% ✓
- Cap rate
- 11.95%
- Cash-on-cash
- 20.21%
- DSCR
- 1.90
- GRM
- 6.0
CMA / ARV
- ARV (on-the-fly)
- $143,040
- Comps found
- 4
Show comp detail 4 sales within ~0.75 mi
| Address | Dist | Beds/Ba | Sqft | Sold | Price | $/sf | Match |
|---|---|---|---|---|---|---|---|
| 610 Gentry St | 0.16mi | 3/1.5 | 1,104 (+15%) | 23mo | $165,000 | $149 | 46 |
| 506 E 1st St | 0.70mi | 3/1.5 | 1,015 (+6%) | 12mo | $150,000 | $148 | 46 |
| 517 Nevada Ave | 0.66mi | 3/1.0 | 1,025 (+7%) | 22mo | $165,000 | $161 | 39 |
| 915 Windbrook St | 0.74mi | 2/2.0 (-1) | 1,066 (+11%) | 14mo | $140,000 | $131 | 26 |
Match score weights: distance 35% · size 25% · config 20% · recency 20%. Top-matched comps best support the ARV.
Projected returns pro-forma
-3.0% appreciation · 3.0% rent growth · sell at horizon
- IRR
- 12.4%
- Equity multiple
- 1.49×
- Total profit
- $11,739
- Equity at exit
- $12,674
- IRR
- 21.3%
- Equity multiple
- 2.81×
- Total profit
- $43,032
- Equity at exit
- $7,349
Cash invested: $23,800 (down + closing). Projections, not guarantees.
Landlord ↔ Tenant lean methodology
- Overall (STATE)
- 92 Strongly Landlord-Friendly
- State Arkansas
- 92 Strongly Landlord-Friendly · R+14
- County
- — inherits STATE
- City
- — inherits STATE
ZIP-level market 72653
- Home prices YoY
- -15.8%
- Active inventory
- 384
- Price-to-rent
- 6.0×
Monthly cashflow live
- Estimated rent
- $1,183 medium interval (Pro) →
- Mortgage (P&I)
- −$446
- Tax from tax record
- −$53 /mo · $630/yr
- Insurance
- −$35
- HOA
- −$0
- Vacancy / Maint / Mgmt
- −$248
- Net cashflow
- $401
Break-even live
Sensitivity live
| Price | -10% $449 | -5% $425 | +0% $401 | +5% $377 | +10% $353 |
|---|---|---|---|---|---|
| Rent | -10% $307 | -5% $354 | +0% $401 | +5% $448 | +10% $494 |
| Rate | -1.0pp $444 | -0.5pp $422 | base $401 | +0.5pp $379 | +1.0pp $356 |
UW: 25.0% down · 7.5% · 30yr · 1.5% tax · 5.0% vac · 8.0% maint · 8.0% mgmt
Financing live
Cash to close
- Down payment
- $21,250
- Closing costs
- $2,550
- Reserves months
- —
- Total cash needed
- —
Loan-product check · same deal, 3 products live
Conventional
25% down · 7.5% · 30yr
- Down + closing
- —
- Monthly P&I
- —
- Monthly cashflow
- —
- DSCR
- —
- Eligible?
- —
Personal DTI + credit; lowest rate.
DSCR
20% down · 8.5% · 30yr
- Down + closing
- —
- Monthly P&I
- —
- Monthly cashflow
- —
- DSCR
- —
- Eligible?
- —
No personal income docs; deal must DSCR.
Hard money
10% down · 12.0% · 12mo
- Down + closing
- —
- Monthly P&I
- —
- Monthly cashflow
- —
- DSCR
- —
- Eligible?
- —
Short-term bridge; refi at stabilization.
Rent comps 1 comps
| Address | Beds | Baths | Sqft | Rent | $/sqft | DOM | Units | Dist |
|---|---|---|---|---|---|---|---|---|
| 47 Northstar Cir Unit 47-3 Mountain Home, AR | 2.0 | 1.5 | 1122 | $1,200 | $1.07 | 45d | 1 | 0.27mi |
Listing history 13 events
-
2026-06-21days on market $85,000 Active 18 DOM
-
2026-06-19days on market $85,000 Active 16 DOM
-
2026-06-18days on market $85,000 Active 15 DOM
-
2026-06-17days on market $85,000 Active 14 DOM
-
2026-06-16days on market $85,000 Active 13 DOM
-
2026-06-15days on market $85,000 Active 12 DOM
-
2026-06-14days on market $85,000 Active 10 DOM
-
2026-06-12days on market $85,000 Active 9 DOM
-
2026-06-09days on market $85,000 Active 6 DOM
-
2026-06-08days on market $85,000 Active 5 DOM
-
2026-06-07days on market $85,000 Active 4 DOM
-
2026-06-05remarks 139-char remark
-
2026-06-05$85,000 Active 1 DOM
ⓘ Source: listings_history table (triggers on properties + properties_extension) + one-shot
backfill from property_details.listing_events for pre-trigger history.
Tax reassessment forecast AR · Resets to sale price
- Current annual tax
- $630 · $53/mo
- Projected year-2 tax
- $630 · $53/mo
- Expected delta
- $0/yr ($0/mo · 0.0%)
ⓘ Screening estimate from a state-policy table — verify with the county assessor before closing.
Climate risk First Street
- Flood 1/10 Low FEMA zone X (unshaded) · 0% chance over 30 yrs
- Wildfire 4/10 Moderate
- Heat 5/10 Major 7 d/yr ≥105°F today · 20 d/yr by 30 yrs out
- Wind 2/10 Low 100% chance of damaging wind over 30 yrs
- Air quality 1/10 Low 0 unhealthy d/yr today · 0 by 30 yrs out
Nearby sold comps map
Loading sold comps map…
Walkable amenities ~0.75 mi
Loading nearby amenities…
Taxation est. · year 1
- Rental income
- $14,195
- − Mortgage interest
- −$4,761
- − Property taxes
- −$630
- − Insurance
- −$425
- − Repairs & maintenance
- −$1,136
- − Management
- −$1,136
- − Depreciation
- −$2,473
- Taxable income
- $3,634
- Est. tax owed @ 24.0%
- −$872
- After-tax cash flow
- $3,937/yr
For passive investors: Depreciation is non-cash, so a rental often shows a tax loss while cash-flowing — sheltering income. Rental losses are passive: they offset passive income freely, and up to $25,000/yr can offset ordinary (W-2) income if you actively participate and your MAGI is under $100k (phasing out to $0 by $150k); unused losses carry forward. On sale, claimed depreciation is recaptured at up to 25%, and gains may owe capital-gains tax (a 1031 exchange can defer both). Figures are a year-1 estimate at your 24.0% rate — not tax advice; consult a CPA.
Schools (NCES district)
- District
- Mountain Home School District
- NCES district ID
- 0500043
- Math proficiency
- 45% ▼ -8.00%
- Reading proficiency
- 45% ▼ -4.00%
- Median HH income
- $36,966
- Composite
- 37.4/100
- National rank
- #4424
- State rank
- #40 of 238 in AR
Livability — Mountain Home
- Score
- 70/100
- State rank
- #54
- US rank
- #7718
Category grades
Schools grade is shown separately in the Schools card above.
Census & demographics
- Census place
- Mountain Home, AR
- County
- Baxter County · 29,564 people
- City population
- 29,564
- Metro
- Mountain Home, AR
- Population (ZIP)
- 29,564
- Household income
- $48,718
- Rent vs Own
- Severe rent burden
- 663.0
Population outlook (Baxter County) Hauer SSP2
- Today (2025)
- 39,886 people
- By 2030
- 39,226 · -1.7%
- By 2040
- 37,810 · -5.2%
- By 2050
- 36,287 · -9.0%
- By 2075
- 32,965 · -17.4%
- By 2100
- 28,002 · -29.8%
Race, ethnicity, and origin ACS 2023
- Neighborhood character
- Predominantly White (91%)
- Race & ethnicity
- White 91% Two or more races 6% Hispanic / Latino 3%
- Common ancestry
- Slovak 2% Romanian 2% Portuguese 2%
- Foreign-born
- 2% · Canada
- Languages at home
- 96% English-only · Spanish 2% German/W. Germanic 1%
Political lean MEDSL · Baxter
- 2024 margin
- Solid R (+56.9) · D 20.7% · R 77.6% · Other 1.7%
- 2008→2024 swing
- -25.3pp toward R · 2008: -31.6pp · 2024: -56.9pp
- All cycles
- 2024: R+56.9 2020: R+53.3 2016: R+53.6 2012: R+44.0 2008: R+31.6
Not yet ingested
- Civics
- —
Market trends
- HPI YoY
- ▼ -46.18%
- Current HPI
- 246.3231
- Rent YoY
- —
- Metro
- Mountain Home, AR
- State GDP YoY
- ▲ 3.80%
- F500 in state
- 10
Industry mix (Fortune 500 HQ in AR)
| Industry | F500 HQs | Revenue |
|---|---|---|
| Retail | 1 | $681B |
|
||
| Food / Agriculture | 1 | $53B |
|
||
| Retail / Energy | 1 | $22B |
|
||
| Transportation / Logistics | 1 | $12B |
|
||
| Energy | 1 | $4B |
|
||
Price history
+672.7% since first listed3 events — show timeline
- 2026-06-03 Listed $85,000 MHMLS
- 2022-07-15 Sold (Public Records) $45,000 Public Records
- 2015-10-16 Sold (Public Records) $11,000 Public Records
Property tax history
+5.5%/yrLatest (2025): $630 · +0.0% YoY. Source: county tax records.
Cash-flow waterfall
monthlySold comps — $/sqft
last 12 mo · ≤1 miLoading sold comps…