 Triplex
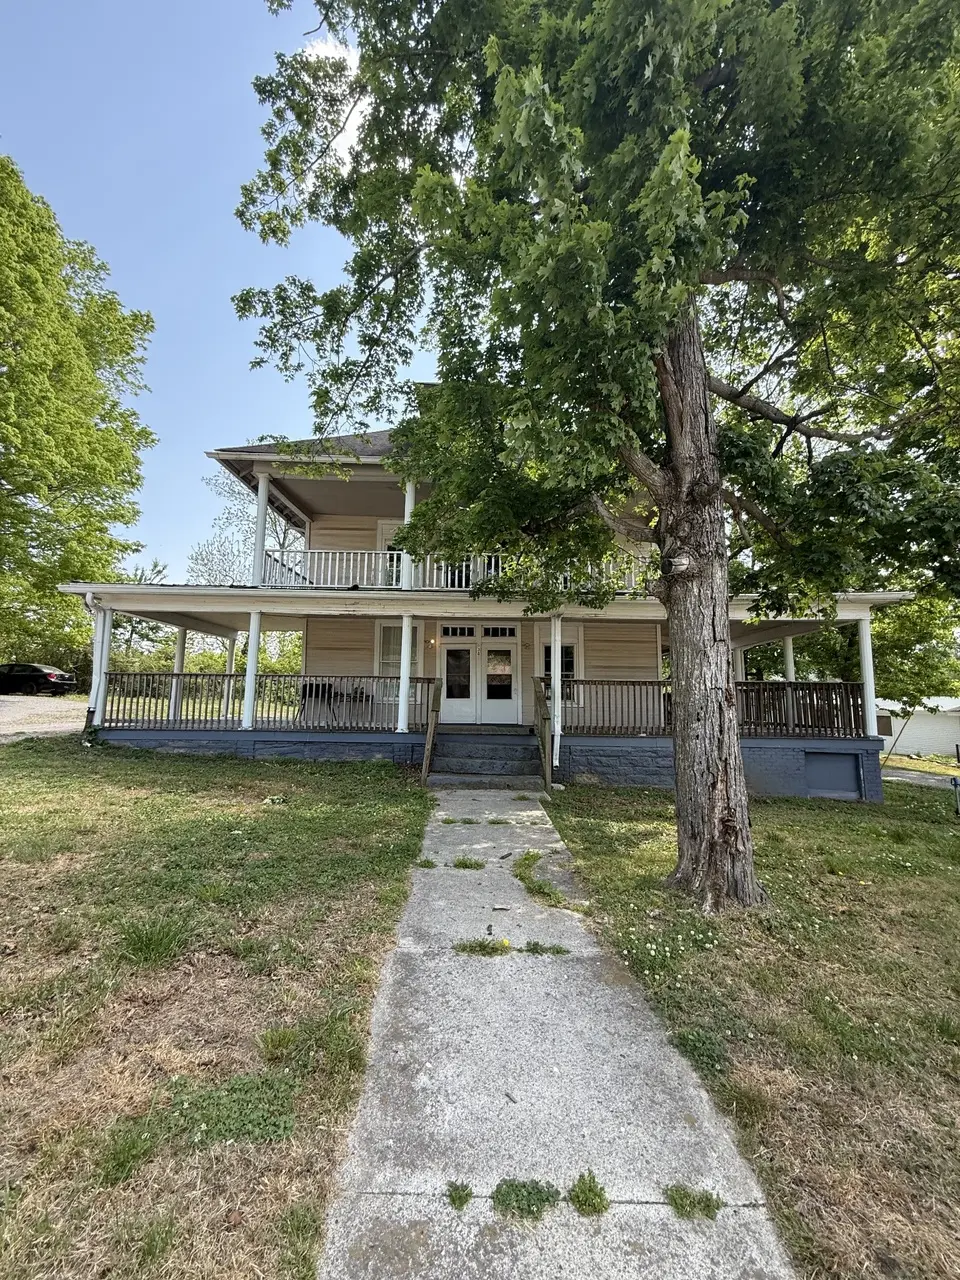
138 S Main St · Cornersville, TN
Flood risk 1/10 · Minimal
- FEMA flood zone
- X (unshaded)
- Chance of flooding over 30 yrs
- 0.0%
- Est. flood insurance / yr
- $507 – $1,088
Fire risk 5/10 · Moderate
- Est. fire insurance / yr
- $949 – $1,763
Heat risk 5/10 · Moderate
- Hot days now (above 104°F)
- 7 days/yr
- Hot days in 30 yrs
- 20 days/yr
Wind risk 4/10 · Minor
- Chance of severe wind over 30 yrs
- 14.0%
Air-quality risk 1/10 · Minimal
- Unhealthy air days now
- 0 days/yr
- Unhealthy air days in 30 yrs
- 0 days/yr
Risk factors via First Street. Map © Google.
Why this score? — see what drove the B grade
The composite is a weighted blend of 9 inputs, each scored 0–100. Each bar is that input's sub-score; the figure is the points it added to the 100-point composite (weight × sub-score).
- Cash flow +30.0/30.0
- 1% rule +10.0/10.0
- DSCR +10.0/10.0
- ARV discount +7.5/15.0
- Appreciation +5.5/10.0
- Livability +3.2/5.0
- Schools +2.6/10.0
- Rent growth +2.5/5.0
- Condition / age +2.5/5.0
$249,900
🖨 Deal sheet 📄 Offer letter ✓ Due diligence
Multi-family units
County records classify this as Multi-Family (2-4 Unit). Listing-text estimate: 3 units. confirmed
Listing remarks
Investor opportunity in the heart of Cornersville! This historic antebellum tri-plex sits on a spacious 0.5 acre lot and offers a unique chance to step into real estate investing or expand your portfolio. The property features three units: one 2-bedroom, 1.5-bath apartment and two 1-bedroom, 1-bath units. The one-bedroom apartments are currently tenant-occupied, generating $1,100/month and $1,000/month, while the two-bedroom unit was recently leased through April 2026 at $1,300/month. With landlord-paid utilities, the property produces over $40,000 in annual gross rental income, and $30,000 net annual income. Full of character and history, this older home comes with its share of quirks&mdas
Key facts
- 0.41 acre lot
- Built 1900
- Listed 52 days
Property features AI
Finance
- Financial info: Gross income reported at $40,000; Net operating income reported at $30,000; Owner pays electricity and water; Tenants reported as paying none
Exterior
- Parking: No designated or covered parking spaces listed
- Utilities: Public water; Private sewer; Water available
- Home design: Residential income property (triplex); Attached property; One level
- Construction: Vinyl siding
- Exterior features: Lot dimensions approximately 70 x 258
Interior
- Bedrooms: Two 1-bedroom units; One 2-bedroom unit
- Flooring: Wood; Laminate
- Bathrooms: Two 1-bath units; One 2-bath unit
- Heating & cooling: Radiant heating; Wall/window unit(s) for cooling
- Interior features: Wood and laminate flooring; Radiant heating; Wall/window cooling units
- Laundry & utility: Washer hookup; Electric dryer hookup
Neighborhood map
What this means for you Summary
Snapshot
- This is a 1×2bd/1.5ba + 2×1bd/1ba units multifamily listed at $250k.
Deal economics
- At list price, monthly cash flow is $2k ($21k/yr) — positive. Per door: $576/mo.
- The deal already cash-flows at list — no discount required.
- Meets the 1% rule at list price ($4k rent vs $250k).
- Recommended offer: $242k (3.0% below list) — sets the bar for market timing.
Location & tenants
- Location reads 65/100 on livability (#152 in TN) — a middle-class / working-renter tenant base. Strengths: cost of living A+, housing A+, crime B+; Watch: health & safety C-, employment D+, amenities F.
- Marshall County (rural): math 31% / reading 29% proficiency, ranked #58 of 139 in TN (top 42%) — families likely to look elsewhere, expect single-tenant / working-renter base with shorter leases.
- Zoned schools: Cornersville Elementary (math 35% / reading 34%, grade F, #319 of 952 statewide, top 37%, 468 students, 0% FRL); Cornersville School (math 21% / reading 32%, grade F, #112 of 332 statewide, top 35%, 442 students, 0% FRL) — zoned schools average 0% FRL vs 48% district-wide (48 pts lower); this property's tenant base skews higher-income than the district average.
- Market conditions: 43 active listings in the ZIP; 400 units permitted in Marshall County in 2024 (75 in 5+ unit buildings).
Forward outlook
- In year one you build about $4k of equity ($2k loan paydown + $3k appreciation (1.0% local appreciation)).
- Marshall County population projected at +5% by 2050 — modest demand growth; plan on rents tracking national, not racing it.
- At projected returns (1.0% appreciation + 3.0% rent growth), your $70k cash investment doubles in ~3 years — after that, you're playing with house money.
- By year 8, paydown + projected appreciation supports a ~$34k cash-out refi (75% LTV) — recoverable capital for the next deal without selling this one.
Negotiation context
- It's been on market 52 days — a 3% lower offer ($242k) is reasonable based on typical stale-listing flexibility.
- 5 sale attempts since 12y ago; this cycle's ask has dropped $19k (7%) from the opening price — seller is motivated, your offer sets the floor, not the list.
- Current owner paid $33k; list at $250k implies a 657% gain — meaningful room to come down on a strong offer.
Risks & watch-outs
- Watch-outs: built in 1900 — expect roof / HVAC / electrical / plumbing capex.
- Climate carrying-cost: moderate wildfire risk; extreme-heat days projected 7→20/yr by 2055 (HVAC capex compounding) — expect insurance premiums to compound above CPI over the hold.
Questions for the listing agent
- It's been on market 52 days. Have you received any prior offers? Is the seller open to a 3% concession, seller financing, or rate buy-down credit?
- Can we see the unit-by-unit rent roll, current vacancy, and any below-market leases? What's the average tenancy length?
- What capital expenditures (roof, boiler, parking lot, exteriors) have been made in the last 5 years, and what's planned in the next 2?
- Built in 1900 — when were the roof, HVAC, electrical panel, plumbing, and water heater last replaced?
- Is there a deadline driving the sale (1031 exchange, divorce, estate, relocation)? That informs how much negotiation room exists.
- Schools are D-rated, which usually means shorter tenancies and higher turnover. Who's the typical renter profile here, and what's been the actual vacancy rate?
- What's the average days-on-market for RENTAL listings here right now (not sales)? A rising rental-DOM trend means longer vacancies and softer asking-rent achievability than the comps imply.
- What's the recent tenant-quality profile in this submarket — average credit score on applications, eviction rate, late-payment / NSF rate, and stable-employment percentage? A property-management company in the area should have these aggregated.
- How much new apartment / multifamily construction is in the pipeline within 1–3 miles? Heavy new supply (>2% of stock underway) typically softens rents 12–24 months out; light construction supports rent growth.
Investment metrics
- 1% rule
- 1.66% ✓
- Cap rate
- 14.59%
- Cash-on-cash
- 29.64%
- DSCR
- 2.32
- GRM
- 5.0
CMA / ARV
No comps found within radius.
Projected returns pro-forma
1.03% appreciation · 3.0% rent growth · sell at horizon
- IRR
- 32.0%
- Equity multiple
- 2.64×
- Total profit
- $115,059
- Equity at exit
- $85,683
- IRR
- 34.3%
- Equity multiple
- 5.13×
- Total profit
- $289,110
- Equity at exit
- $114,152
Cash invested: $69,972 (down + closing). Projections, not guarantees.
Landlord ↔ Tenant lean methodology
- Overall (STATE)
- 87 Strongly Landlord-Friendly
- State Tennessee
- 87 Strongly Landlord-Friendly · R+13
- County
- — inherits STATE
- City
- — inherits STATE
ZIP-level market 37047
- Home prices YoY
- 0.3%
- Active inventory
- 43
- Price-to-rent
- 15.2×
Monthly cashflow live
- Estimated rent
- $4,149 medium interval (Pro) →
- Mortgage (P&I)
- −$1,311
- Tax from tax record
- −$135 /mo · $1,616/yr
- Insurance
- −$104
- HOA
- −$0
- Vacancy / Maint / Mgmt
- −$871
- Net cashflow
- $1,728
Break-even live
3-unit breakdown (identical units grouped — click to expand)
| Units | Beds | Baths | Est. rent |
|---|---|---|---|
| 1× unit | 2 | 1.5 | $1,366 |
| 2× units | 1 | 1 | $2,782 |
| #2 | 1 | 1 | $1,391 |
| #3 | 1 | 1 | $1,391 |
| Total (3 units) | $4,149 | ||
UW: 25.0% down · 7.5% · 30yr · 1.5% tax · 5.0% vac · 8.0% maint · 8.0% mgmt
Financing live
Cash to close
- Down payment
- $62,475
- Closing costs
- $7,497
- Reserves months
- —
- Total cash needed
- —
Loan-product check · same deal, 3 products live
Conventional
25% down · 7.5% · 30yr
- Down + closing
- —
- Monthly P&I
- —
- Monthly cashflow
- —
- DSCR
- —
- Eligible?
- —
Personal DTI + credit; lowest rate.
DSCR
20% down · 8.5% · 30yr
- Down + closing
- —
- Monthly P&I
- —
- Monthly cashflow
- —
- DSCR
- —
- Eligible?
- —
No personal income docs; deal must DSCR.
Hard money
10% down · 12.0% · 12mo
- Down + closing
- —
- Monthly P&I
- —
- Monthly cashflow
- —
- DSCR
- —
- Eligible?
- —
Short-term bridge; refi at stabilization.
Listing history 27 events
-
2026-06-18price $249,900 Active 52 DOM
-
2026-06-18days on market $269,000 Active 52 DOM
-
2026-06-17days on market $269,000 Active 51 DOM
-
2026-06-16days on market $269,000 Active 50 DOM
-
2026-06-15days on market $269,000 Active 49 DOM
-
2026-06-13days on market $269,000 Active 47 DOM
-
2026-06-09days on market $269,000 Active 43 DOM
-
2026-06-08days on market $269,000 Active 42 DOM
-
2026-06-07days on market $269,000 Active 41 DOM
-
2026-06-03days on market $269,000 Active 37 DOM
-
2026-06-02days on market $269,000 Active 36 DOM
-
2026-06-01days on market $269,000 Active 35 DOM
-
2026-05-31days on market $269,000 Active 34 DOM
-
2026-04-27$269,000 Active 1371-char remark
-
2022-03-03historical
-
2022-03-03historical
-
2022-01-12Active
-
2022-01-12Active
-
2014-09-25soldstatus $33,000 Closed
-
2014-09-25soldstatus $33,000
-
2014-09-22soldstatus $33,000 Closed
-
2014-09-22soldstatus $33,000
-
2014-08-29historical
-
2014-08-27historical
-
2014-02-20$43,000
-
2014-02-16$43,000
-
2007-10-10soldstatus $40,000
ⓘ Source: listings_history table (triggers on properties + properties_extension) + one-shot
backfill from property_details.listing_events for pre-trigger history.
Tax reassessment forecast TN · Resets to sale price
- Current annual tax
- $1,616 · $135/mo
- Projected year-2 tax
- $1,774 · $148/mo
- Expected delta
- +$158/yr (+$13/mo · 9.8%)
ⓘ Screening estimate from a state-policy table — verify with the county assessor before closing.
Climate risk First Street
- Flood 1/10 Low FEMA zone X (unshaded) · 0% chance over 30 yrs
- Wildfire 5/10 Major
- Heat 5/10 Major 7 d/yr ≥104°F today · 20 d/yr by 30 yrs out
- Wind 4/10 Moderate 14% chance of damaging wind over 30 yrs
- Air quality 1/10 Low 0 unhealthy d/yr today · 0 by 30 yrs out
Nearby sold comps map
Loading sold comps map…
Walkable amenities ~0.75 mi
Loading nearby amenities…
Taxation est. · year 1
- Rental income
- $49,788
- − Mortgage interest
- −$13,998
- − Property taxes
- −$1,616
- − Insurance
- −$1,250
- − Repairs & maintenance
- −$3,983
- − Management
- −$3,983
- − Depreciation
- −$7,270
- Taxable income
- $17,688
- Est. tax owed @ 24.0%
- −$4,245
- After-tax cash flow
- $16,496/yr
For passive investors: Depreciation is non-cash, so a rental often shows a tax loss while cash-flowing — sheltering income. Rental losses are passive: they offset passive income freely, and up to $25,000/yr can offset ordinary (W-2) income if you actively participate and your MAGI is under $100k (phasing out to $0 by $150k); unused losses carry forward. On sale, claimed depreciation is recaptured at up to 25%, and gains may owe capital-gains tax (a 1031 exchange can defer both). Figures are a year-1 estimate at your 24.0% rate — not tax advice; consult a CPA.
Schools (NCES district)
- District
- Marshall County
- NCES district ID
- 4702670
- Math proficiency
- 31% ▼ -9.00%
- Reading proficiency
- 29% ▼ -5.00%
- Median HH income
- $43,058
- Composite
- 25.56/100
- National rank
- #7426
- State rank
- #58 of 139 in TN
Livability — Cornersville
- Score
- 65/100
- State rank
- #152
- US rank
- #13391
Category grades
Schools grade is shown separately in the Schools card above.
Census & demographics
- Census place
- Cornersville, TN
- Population (ZIP)
- 2,685
Population outlook (Marshall County) Hauer SSP2
- Today (2025)
- 33,222 people
- By 2030
- 33,867 · +1.9%
- By 2040
- 34,743 · +4.6%
- By 2050
- 34,954 · +5.2%
- By 2075
- 34,652 · +4.3%
- By 2100
- 31,862 · -4.1%
Race, ethnicity, and origin ACS 2023
- Neighborhood character
- Predominantly White (76%)
- Race & ethnicity
- White 76% Two or more races 18% Black 3% Hispanic / Latino 3%
- Common ancestry
- Lithuanian 2% Iranian 2% Polish 1%
- Foreign-born
- 1% · Canada
- Languages at home
- 96% English-only · Spanish 3% German/W. Germanic 1%
Political lean MEDSL · Marshall
- 2024 margin
- Solid R (+56.6) · D 21.2% · R 77.8%
- 2008→2024 swing
- -17.0pp toward R · 2008: -39.6pp · 2024: -56.6pp
- All cycles
- 2024: R+56.6 2020: R+50.0 2016: R+46.6 2012: R+28.9 2008: R+39.6
Not yet ingested
- Civics
- —
Market trends
- HPI YoY
- ▲ 1.03%
- Current HPI
- 366.0155
- Rent YoY
- —
- Metro
- —
- State GDP YoY
- ▲ 2.78%
- F500 in state
- 22
Industry mix (Fortune 500 HQ in TN)
| Industry | F500 HQs | Revenue |
|---|---|---|
| Healthcare | 3 | $91B |
|
||
| Retail | 3 | $72B |
|
||
| Transportation / Logistics | 1 | $88B |
|
||
| Paper / Packaging | 1 | $19B |
|
||
| Insurance | 1 | $13B |
|
||
| Energy | 1 | $12B |
|
||
Price history
+524.8% since first listed15 events — show timeline
- 2026-06-18 Price Changed $249,900 REALTRACS as Distributed by MLS Grid
- 2026-04-27 Listed $269,000 REALTRACS as Distributed by MLS Grid
- 2022-03-03 Listing Removed — REALTRACS as Distributed by MLS Grid
- 2022-03-03 Listing Removed — REALTRACS as Distributed by MLS Grid
- 2022-01-12 Listed — REALTRACS as Distributed by MLS Grid
- 2022-01-12 Listed — REALTRACS as Distributed by MLS Grid
- 2014-09-25 Sold (MLS) $33,000 REALTRACS as Distributed by MLS Grid
- 2014-09-25 Sold (MLS) $33,000 REALTRACS as Distributed by MLS Grid
- 2014-09-22 Sold (MLS) $33,000 REALTRACS as Distributed by MLS Grid
- 2014-09-22 Sold (MLS) $33,000 REALTRACS as Distributed by MLS Grid
- 2014-08-29 Listing Removed — REALTRACS as Distributed by MLS Grid
- 2014-08-27 Listing Removed — REALTRACS as Distributed by MLS Grid
- 2014-02-20 Listed $43,000 REALTRACS as Distributed by MLS Grid
- 2014-02-16 Listed $43,000 REALTRACS as Distributed by MLS Grid
- 2007-10-10 Sold (Public Records) $40,000 Public Records
Property tax history
+12.8%/yrLatest (2025): $1,616 · +5.6% YoY. Source: county tax records.
Cash-flow waterfall
monthlySold comps — $/sqft
last 12 mo · ≤1 miLoading sold comps…