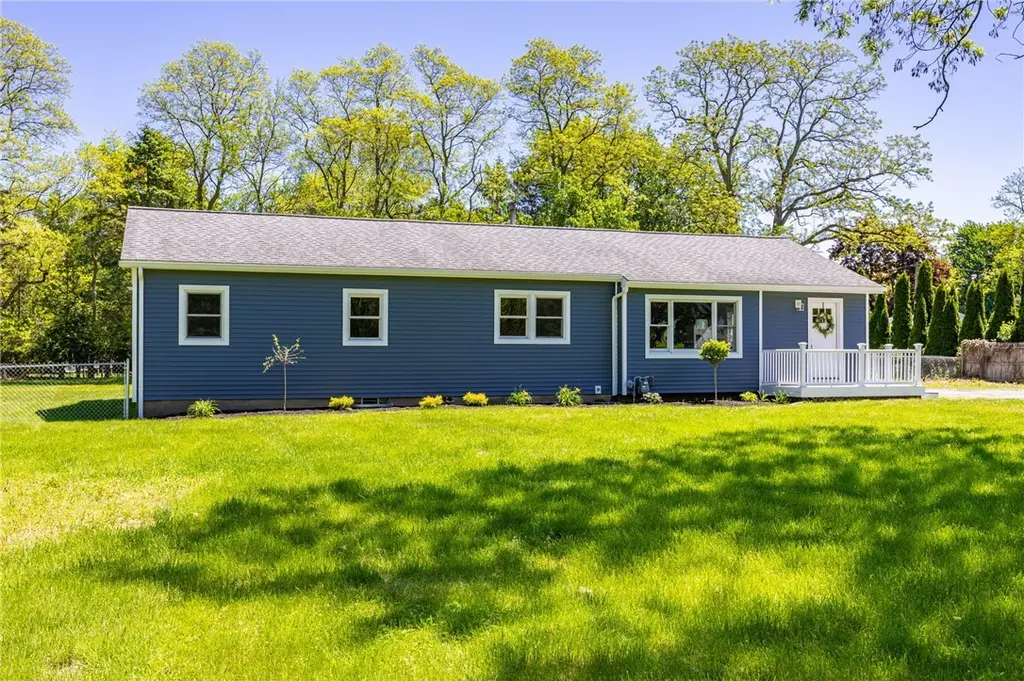
249 Dickinson Rd · Irondequoit, NY
Flood risk No data
- FEMA flood zone
- —
- Chance of flooding over 30 yrs
- —
- Est. flood insurance / yr
- —
Fire risk No data
- Est. fire insurance / yr
- —
Heat risk No data
- Hot days now (above threshold)
- —
- Hot days in 30 yrs
- —
Wind risk No data
- Chance of severe wind over 30 yrs
- —
Air-quality risk No data
- Unhealthy air days now
- —
- Unhealthy air days in 30 yrs
- —
Risk factors via First Street. Map © Google.
Why this score? — see what drove the D+ grade
The composite is a weighted blend of 9 inputs, each scored 0–100. Each bar is that input's sub-score; the figure is the points it added to the 100-point composite (weight × sub-score).
- ARV discount +15.0/15.0
- Cash flow +11.1/30.0
- Schools +5.5/10.0
- Livability +4.0/5.0
- 1% rule +3.5/10.0
- DSCR +3.2/10.0
- Rent growth +3.1/5.0
- Condition / age +2.5/5.0
- Appreciation +0.0/10.0
$299,900
🖨 Deal sheet 📄 Offer letter ✓ Due diligence
Listing remarks
Welcome to 249 Dickinson Road! A completely renovated 5 bedroom/2 bath ranch that is truly move-in ready! Featuring a brand new kitchen with dark blue shaker cabinets, quartz counters, subway tile backsplash and stainless steel appliances. Beautiful hardwood floors flow through the main living area and two bedrooms. The spacious primary bedroom suite offers a walk-in shower, and the convenience of first floor laundry adds to the easy-living layout. Recent updates include newly installed vinyl siding, new garage roof, garage door and opener, brand new furnace with central air, electrical panel, hot water heater (2023), and Andersen vinyl windows. Added spray foam insulation in the basement
Key facts
- Quartz counters
- New kitchen
- Hardwood floors
Tags
Property features AI
Exterior
- Parking: Detached garage with automatic garage door opener; Approximately 1.5 garage spaces
- Utilities: Public water connected; Septic tank; Circuit breaker electrical service; Cable and high-speed internet available
- Home design: Single-story home; Existing/resale property
- Construction: Vinyl siding; Blown-in insulation; Copper and PEX plumbing; Block foundation; Asphalt architectural shingle roof
- Exterior features: Deck; Fully fenced yard; Blacktop driveway; Rectangular residential lot approximately 0.75 acres (155 x 212); City street frontage
Interior
- Kitchen: Dishwasher; Gas oven and gas range; Microwave; Refrigerator; Eat-in kitchen; Quartz countertops; Pantry
- Bedrooms: Five main-level bedrooms; Primary suite on main level with primary bath; Bedroom on main level
- Flooring: Carpet; Hardwood; Luxury vinyl; Varies
- Bathrooms: Two full bathrooms (both on main level); Bath in primary bedroom
- Heating & cooling: Forced air gas heating; Central air conditioning
- Interior features: Ceiling fans; Eat-in kitchen; Separate/formal living room; Home office; Pantry; Quartz countertops; Sliding glass doors; Thermal windows
- Laundry & utility: Main-level laundry; Gas water heater
Neighborhood map
What this means for you Summary
Snapshot
- This is a 5-bed/1.0-bath single-family listed at $300k.
Deal economics
- At list price, monthly cash flow is $-122 ($-1k/yr) — negative.
- To cash-flow at today's rent, offer at most $278k (7.2% below list).
- To meet the 1% rule (rent ≥ 1% of price), the offer needs to be $255k (15.1% below list).
- Recommended offer: $255k (15.1% below list) — sets the bar for 1% rule.
- Cap rate 5.8% vs local median 4.5% in Irondequoit — meaningfully above typical; check what's discounted (condition, days-on-market, listing class) to confirm the premium yield is real.
Location & tenants
- Location reads 81/100 on livability (#92 in NY, #1,414 nationally) — a professional / high-income tenant draw. Strengths: housing A+, health & safety A+, crime B+; Watch: amenities F.
- Webster Central School District (suburban): math 62% / reading 63% proficiency, ranked #184 of 590 in NY (top 31%) — acceptable for families but not a draw, mixed tenant base, ~2y average lease; only 12% free/reduced lunch — higher-income household profile.
- Market conditions: Rents rising (+2.4%/yr); 243 active listings in the ZIP; solid renter incomes; 1,169 units permitted in Monroe County in 2024 (591 in 5+ unit buildings).
- This rent runs 31% of the median local income ($98k/yr) — at the standard rent-burdened threshold; future hikes will face affordability resistance.
Forward outlook
- Local home prices are declining (-3.0%/yr); year-one equity from $2k of loan paydown is wiped out by about $9k of value loss. Plan a longer hold.
- Monroe County population projected to shrink 6% by 2050 — rents likely to lag national; underwrite the cash flow, not the appreciation.
Negotiation context
- Only 14 days on market — expect competitive offers; lowballing is unlikely to land.
Risks & watch-outs
- Watch-outs: built in 1956 — expect roof / HVAC / electrical / plumbing capex.
Questions for the listing agent
- What do current leases actually rent for vs. the listed asking? Can we see a recent rent roll and the last 12 months of T-12 income?
- Built in 1956 — when were the roof, HVAC, electrical panel, plumbing, and water heater last replaced?
- Is there a deadline driving the sale (1031 exchange, divorce, estate, relocation)? That informs how much negotiation room exists.
- Schools are B-rated — typically a magnet for longer-tenancy family renters. What's the average tenant stay here, and is there a school-zone premium baked into asking?
- The area grade is low — what's the realistic commute time and amenity access for the typical tenant pool here? Any planned neighborhood developments (good or bad) we should know about?
- What's the average days-on-market for RENTAL listings here right now (not sales)? A rising rental-DOM trend means longer vacancies and softer asking-rent achievability than the comps imply.
- What's the recent tenant-quality profile in this submarket — average credit score on applications, eviction rate, late-payment / NSF rate, and stable-employment percentage? A property-management company in the area should have these aggregated.
- How much new for-sale + rental construction is in the pipeline within 1–3 miles? Heavy new supply typically softens prices + rents 12–24 months out; constrained supply supports both.
Investment metrics
- 1% rule
- 0.85% ✗
- Cap rate
- 5.80%
- Cash-on-cash
- -1.75%
- DSCR
- 0.92
- GRM
- 9.8
CMA / ARV
- ARV (on-the-fly)
- $374,052
- Comps found
- 9
Show comp detail 9 sales within ~0.75 mi
| Address | Dist | Beds/Ba | Sqft | Sold | Price | $/sf | Match |
|---|---|---|---|---|---|---|---|
| 787 Dewitt Rd | 0.48mi | 4/2.0 (-1) | 1,608 (-6%) | 7mo | $155,000 | $96 | 53 |
| 388 Longbush Ln | 0.56mi | 4/2.0 (-1) | 1,730 (+1%) | 12mo | $395,500 | $229 | 53 |
| 200 Colonial Dr | 0.42mi | 5/1.5 | 1,804 (+6%) | 21mo | $275,000 | $152 | 51 |
| 746 Dewitt Rd | 0.31mi | 4/3.0 (-1) | 1,843 (+8%) | 10mo | $262,500 | $142 | 51 |
| 165 Dickinson Rd | 0.48mi | 4/1.5 (-1) | 1,604 (-6%) | 13mo | $351,800 | $219 | 50 |
| 197 Dickinson Rd | 0.33mi | 5/2.0 | 1,545 (-10%) | 24mo | $410,000 | $265 | 45 |
| 250 Norwood Cir | 0.66mi | 4/2.0 (-1) | 1,491 (-13%) | 3mo | $360,000 | $241 | 36 |
| 823 Chestnut Bnd | 0.70mi | 4/2.0 (-1) | 1,530 (-10%) | 8mo | $336,000 | $220 | 34 |
| 225 Oakwood Ln | 0.61mi | 4/2.0 (-1) | 1,549 (-9%) | 20mo | $301,000 | $194 | 30 |
Match score weights: distance 35% · size 25% · config 20% · recency 20%. Top-matched comps best support the ARV.
Projected returns pro-forma
-3.0% appreciation · 2.38% rent growth · sell at horizon
- IRR
- -19.9%
- Equity multiple
- 0.31×
- Total profit
- $-57,878
- Equity at exit
- $44,716
- IRR
- -14.1%
- Equity multiple
- 0.21×
- Total profit
- $-66,505
- Equity at exit
- $25,930
Cash invested: $83,972 (down + closing). Projections, not guarantees.
Landlord ↔ Tenant lean methodology
- Overall (STATE)
- 15 Strongly Tenant-Friendly
- State New York
- 15 Strongly Tenant-Friendly · D+10
- County
- — inherits STATE
- City
- — inherits STATE
ZIP-level market 14580
- Rents YoY
- 2.4%
- Active inventory
- 243
- Price-to-rent
- 9.8×
Monthly cashflow live
- Estimated rent
- $2,546 medium interval (Pro) →
- Mortgage (P&I)
- −$1,573
- Tax from tax record
- −$436 /mo · $5,229/yr
- Insurance
- −$125
- HOA
- −$0
- Vacancy / Maint / Mgmt
- −$535
- Net cashflow
- $-122
Break-even live
UW: 25.0% down · 7.5% · 30yr · 1.5% tax · 5.0% vac · 8.0% maint · 8.0% mgmt
Financing live
Cash to close
- Down payment
- $74,975
- Closing costs
- $8,997
- Reserves months
- —
- Total cash needed
- —
Loan-product check · same deal, 3 products live
Conventional
25% down · 7.5% · 30yr
- Down + closing
- —
- Monthly P&I
- —
- Monthly cashflow
- —
- DSCR
- —
- Eligible?
- —
Personal DTI + credit; lowest rate.
DSCR
20% down · 8.5% · 30yr
- Down + closing
- —
- Monthly P&I
- —
- Monthly cashflow
- —
- DSCR
- —
- Eligible?
- —
No personal income docs; deal must DSCR.
Hard money
10% down · 12.0% · 12mo
- Down + closing
- —
- Monthly P&I
- —
- Monthly cashflow
- —
- DSCR
- —
- Eligible?
- —
Short-term bridge; refi at stabilization.
Listing history 10 events
-
2026-06-15status $299,900 Pending 14 DOM
-
2026-06-13statusdays on market $299,900 Active Under Contract 14 DOM
-
2026-06-10days on market $299,900 Active 11 DOM
-
2026-06-09days on market $299,900 Active 10 DOM
-
2026-06-09days on market $299,900 Active 9 DOM
-
2026-06-07days on market $299,900 Active 8 DOM
-
2026-06-05days on market $299,900 Active 5 DOM
-
2026-06-03days on market $299,900 Active 4 DOM
-
2026-06-03days on market $299,900 Active 3 DOM
-
2026-06-01days on market $299,900 Active 2 DOM
ⓘ Source: listings_history table (triggers on properties + properties_extension) + one-shot
backfill from property_details.listing_events for pre-trigger history.
Tax reassessment forecast NY · Partial reset (capped growth)
- Current annual tax
- $5,229 · $436/mo
- Projected year-2 tax
- $5,229 · $436/mo
- Expected delta
- $0/yr ($0/mo · 0.0%)
ⓘ Screening estimate from a state-policy table — verify with the county assessor before closing.
Nearby sold comps map
Loading sold comps map…
Walkable amenities ~0.75 mi
Loading nearby amenities…
Taxation est. · year 1
- Rental income
- $30,551
- − Mortgage interest
- −$16,799
- − Property taxes
- −$5,229
- − Insurance
- −$1,500
- − Repairs & maintenance
- −$2,444
- − Management
- −$2,444
- − Depreciation
- −$8,724
- Taxable loss
- −$6,589
- Est. tax savings @ 24.0%
- +$1,581
- After-tax cash flow
- $116/yr
For passive investors: Depreciation is non-cash, so a rental often shows a tax loss while cash-flowing — sheltering income. Rental losses are passive: they offset passive income freely, and up to $25,000/yr can offset ordinary (W-2) income if you actively participate and your MAGI is under $100k (phasing out to $0 by $150k); unused losses carry forward. On sale, claimed depreciation is recaptured at up to 25%, and gains may owe capital-gains tax (a 1031 exchange can defer both). Figures are a year-1 estimate at your 24.0% rate — not tax advice; consult a CPA.
Schools (NCES district)
- District
- Webster Central School District
- NCES district ID
- 3630360
- Math proficiency
- 62% ▼ -3.00%
- Reading proficiency
- 63% ▲ 6.00%
- Median HH income
- $71,221
- Composite
- 55.18/100
- National rank
- #1273
- State rank
- #184 of 590 in NY
Livability — Irondequoit
- Score
- 81/100
- State rank
- #92
- US rank
- #1414
Category grades
Schools grade is shown separately in the Schools card above.
Census & demographics
- County
- Monroe County · 674,131 people
- City population
- 74,252
- Metro
- Rochester, NY
- Population (ZIP)
- 54,180
- Household income
- $98,310
- Rent vs Own
- Severe rent burden
- 1325.0
Population outlook (Monroe County) Hauer SSP2
- Today (2025)
- 759,460 people
- By 2030
- 757,154 · -0.3%
- By 2040
- 740,644 · -2.5%
- By 2050
- 714,443 · -5.9%
- By 2075
- 645,883 · -15.0%
- By 2100
- 547,084 · -28.0%
Race, ethnicity, and origin ACS 2023
- Neighborhood character
- Predominantly White (88%)
- Race & ethnicity
- White 88% Two or more races 5% Hispanic / Latino 3% Asian 3% Black 2%
- Common ancestry
- Romanian 4% Iranian 3% Subsaharan African 3%
- Foreign-born
- 8% · Canada, China
- Languages at home
- 91% English-only · Other Indo-European 3% Russian/Polish/Slavic 2% Spanish 2%
Political lean MEDSL · Monroe
- 2024 margin
- D (+19.1) · D 59.5% · R 40.5%
- 2008→2024 swing
- +1.4pp toward D · 2008: 17.7pp · 2024: 19.1pp
- All cycles
- 2024: D+19.1 2020: D+21.0 2016: D+14.1 2012: D+17.4 2008: D+17.7
Not yet ingested
- Civics
- —
Market trends
- HPI YoY
- ▼ -154.52%
- Current HPI
- 266.2145
- Rent YoY
- ▲ 2.38%
- Metro
- Rochester, NY
- State GDP YoY
- ▲ 2.60%
- F500 in state
- 92
Industry mix (Fortune 500 HQ in NY)
| Industry | F500 HQs | Revenue |
|---|---|---|
| Financial Services | 10 | $950B |
|
||
| Consumer Goods | 9 | $162B |
|
||
| Insurance | 4 | $225B |
|
||
| Telecommunications | 2 | $144B |
|
||
| Pharmaceuticals | 2 | $112B |
|
||
| Media / Entertainment | 2 | $69B |
|
||
Price history
1 event — show timeline
- 2026-05-30 Listed $299,900 UNYREIS
Property tax history
+3.2%/yrLatest (2025): $5,229 · +10.8% YoY. Source: county tax records.
Cash-flow waterfall
monthlySold comps — $/sqft
last 12 mo · ≤1 miLoading sold comps…