 Multi-family
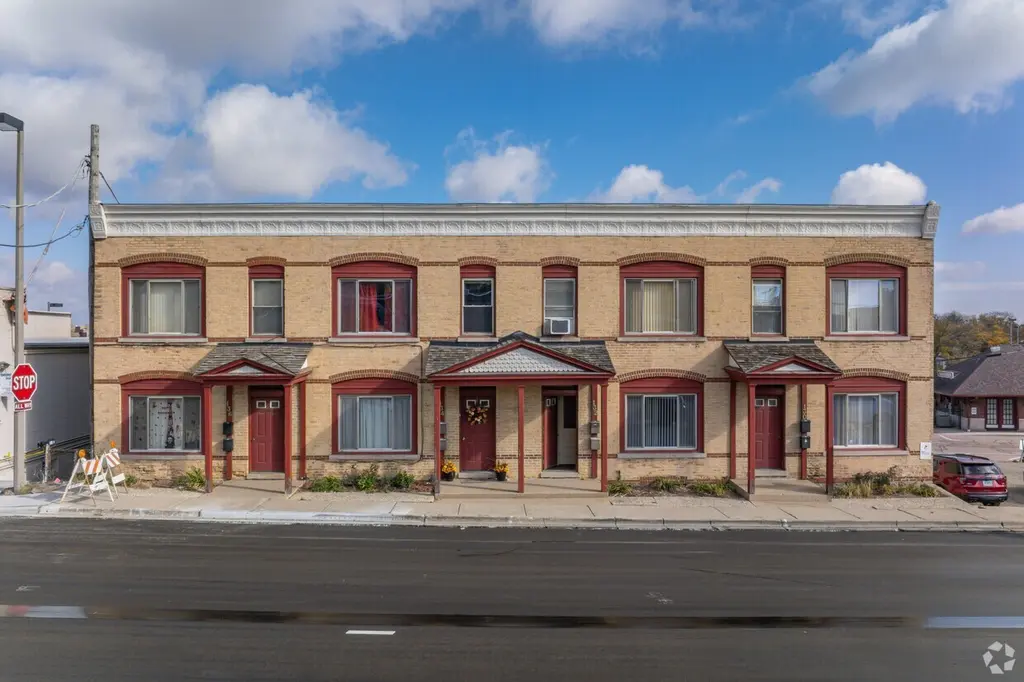
130 Washington St · Woodstock, IL
Flood risk 1/10 · Minimal
- FEMA flood zone
- X (unshaded)
- Chance of flooding over 30 yrs
- 0.0%
- Est. flood insurance / yr
- $473 – $860
Fire risk 1/10 · Minimal
- Est. fire insurance / yr
- $804 – $1,492
Heat risk 2/10 · Minimal
- Hot days now (above 101°F)
- 7 days/yr
- Hot days in 30 yrs
- 14 days/yr
Wind risk 2/10 · Minimal
- Chance of severe wind over 30 yrs
- —
Air-quality risk 2/10 · Minimal
- Unhealthy air days now
- 1 days/yr
- Unhealthy air days in 30 yrs
- 1 days/yr
Risk factors via First Street. Map © Google.
Why this score? — see what drove the C grade
The composite is a weighted blend of 9 inputs, each scored 0–100. Each bar is that input's sub-score; the figure is the points it added to the 100-point composite (weight × sub-score).
- Cash flow +26.7/30.0
- DSCR +9.2/10.0
- 1% rule +7.2/10.0
- Livability +4.1/5.0
- Condition / age +3.8/5.0
- Schools +2.8/10.0
- Rent growth +2.5/5.0
- ARV discount +0.0/15.0
- Appreciation +0.0/10.0
$999,000
🖨 Deal sheet 📄 Offer letter ✓ Due diligence
Multi-family units
County records classify this as Multi-Family (5+ Unit). Listing-text estimate: 1 unit. estimate disagrees with records
5+ unit building — per-unit beds/baths from public records are typically unavailable; the breakdown below (if shown) is an estimate from the listing text.
Listing remarks MLS
Fully Occupied- Premier Downtown Woodstock Investment Opportunity - 8 Residential Units, Commercial Space, and Vacant Lot with 8.19% CAP Rate. A unique and lucrative investment property in the heart of downtown Woodstock, offering a rare combination of immediate rental income, significant tax incentives, and future development potential. This solid brick, multi-family and commercial building, located just off the historic Woodstock Square and steps from the Metra train station. The property includes eight fully occupied one-bedroom, one-bathroom residential apartments, a leased commercial print shop, and a valuable adjacent vacant lot, providing a diverse and stable income stream. Tenants enjoy the convenience of exterior parking, shared laundry facilities, and a dedicated storage area. Located in TIF district & Enterprise Zone.
Key facts
- Residential units
- Vacant lot
- Commercial space
Tags
Neighborhood map
What this means for you Summary
Snapshot
- This is a 8-bed/9.0-bath multifamily listed at $999k. Condition is rated good.
Deal economics
- At list price, monthly cash flow is $3k ($33k/yr) — positive.
- The deal already cash-flows at list — no discount required.
- Meets the 1% rule at list price ($12k rent vs $999k).
- Recommended offer: $879k (12.0% below list) — sets the bar for market timing.
- Cap rate 9.6% vs local median 2.6% in Woodstock — top-decile yield for the area; either an underpriced asset or a hidden risk that comps aren't pricing in. Stress-test before assuming the spread holds.
Location & tenants
- Location reads 82/100 on livability (#66 in IL, #1,114 nationally) — a professional / high-income tenant draw. Strengths: crime A+, cost of living A+, housing A+; Watch: schools D-.
- Woodstock CUSD 200 (town): math 24% / reading 38% proficiency, ranked #220 of 620 in IL (top 36%) — families likely to look elsewhere, expect single-tenant / working-renter base with shorter leases.
- Market conditions: 141 active listings in the ZIP; solid renter incomes; 1,595 units permitted in McHenry County in 2024 (485 in 5+ unit buildings).
- At $12,180/mo this rent would consume 161% of the median local household income ($91k/yr) (locally 759% of renters already pay >50% of income on rent) — very limited rent-growth headroom before tenants either downsize or default.
Forward outlook
- Local home prices are declining (-3.0%/yr); year-one equity from $7k of loan paydown is wiped out by about $30k of value loss. Plan a longer hold.
- McHenry County population projected at -12% by 2050 — secular population decline; favor cash flow + early exit over multi-decade hold.
- At projected returns (-3.0% appreciation + 3.0% rent growth), your $280k cash investment doubles in ~10 years — after that, you're playing with house money.
Negotiation context
- It's been on market 345 days — a 12% lower offer ($879k) is reasonable based on typical stale-listing flexibility.
- 4 sale attempts since 2y ago; this cycle's ask has dropped $100k (9%) from the opening price — seller is motivated, your offer sets the floor, not the list.
- Current owner paid $675k; 48% above their basis — modest negotiation headroom, anchor on the comps not their cost.
Risks & watch-outs
- Watch-outs: built in 1900 — expect roof / HVAC / electrical / plumbing capex.
Questions for the listing agent
- It's been on market 345 days. Have you received any prior offers? Is the seller open to a 12% concession, seller financing, or rate buy-down credit?
- Built in 1900 — when were the roof, HVAC, electrical panel, plumbing, and water heater last replaced?
- Why hasn't it sold? Are there any deal-killer items the seller is aware of (foundation, flood, title, zoning, code violations)?
- Is there a deadline driving the sale (1031 exchange, divorce, estate, relocation)? That informs how much negotiation room exists.
- Schools are D-rated, which usually means shorter tenancies and higher turnover. Who's the typical renter profile here, and what's been the actual vacancy rate?
- What's the average days-on-market for RENTAL listings here right now (not sales)? A rising rental-DOM trend means longer vacancies and softer asking-rent achievability than the comps imply.
- What's the recent tenant-quality profile in this submarket — average credit score on applications, eviction rate, late-payment / NSF rate, and stable-employment percentage? A property-management company in the area should have these aggregated.
- How much new apartment / multifamily construction is in the pipeline within 1–3 miles? Heavy new supply (>2% of stock underway) typically softens rents 12–24 months out; light construction supports rent growth.
Investment metrics
- 1% rule
- 1.22% ✓
- Cap rate
- 9.56%
- Cash-on-cash
- 11.66%
- DSCR
- 1.52
- GRM
- 6.8
CMA / ARV
- ARV (median comp)
- $829,148
- List price
- $999,000
- Delta
- 20.49%
- Verdict
- OVERPRICED
- Comps
- 2 within 1.0 mi
Show comp detail 2 sales within ~0.75 mi
| Address | Dist | Beds/Ba | Sqft | Sold | Price | $/sf | Match |
|---|---|---|---|---|---|---|---|
| 130 Washington St | 0.00mi | 8/9.0 | — | 21mo | $675,000 | — | 70 |
| 220 Griffing Ave | 0.56mi | 9/5.0 (+1) | 5,500 | 17mo | $665,000 | $121 | 27 |
Match score weights: distance 35% · size 25% · config 20% · recency 20%. Top-matched comps best support the ARV.
Projected returns pro-forma
-3.0% appreciation · 3.0% rent growth · sell at horizon
- IRR
- 1.1%
- Equity multiple
- 1.04×
- Total profit
- $11,435
- Equity at exit
- $148,954
- IRR
- 10.7%
- Equity multiple
- 1.84×
- Total profit
- $233,640
- Equity at exit
- $86,375
Cash invested: $279,720 (down + closing). Projections, not guarantees.
Landlord ↔ Tenant lean methodology
- Overall (STATE)
- 43 Moderately Tenant-Leaning
- State Illinois
- 43 Moderately Tenant-Leaning · D+7
- County
- — inherits STATE
- City
- — inherits STATE
ZIP-level market 60098
- Home prices YoY
- -30.0%
- Active inventory
- 141
- Price-to-rent
- 54.7×
Monthly cashflow live
- Estimated rent
- $12,180 high interval (Pro) →
- Mortgage (P&I)
- −$5,239
- Tax est. 1.5%
- −$1,249 /mo · $14,985/yr
- Insurance
- −$416
- HOA
- −$0
- Vacancy / Maint / Mgmt
- −$2,558
- Net cashflow
- $2,718
Break-even live
8-unit breakdown (identical units grouped — click to expand)
| Units | Beds | Baths | Est. rent |
|---|---|---|---|
| 8× units | 1 | 1 | $12,176 |
| #1 | 1 | 1 | $1,522 |
| #2 | 1 | 1 | $1,522 |
| #3 | 1 | 1 | $1,522 |
| #4 | 1 | 1 | $1,522 |
| #5 | 1 | 1 | $1,522 |
| #6 | 1 | 1 | $1,522 |
| #7 | 1 | 1 | $1,522 |
| #8 | 1 | 1 | $1,522 |
| Total (8 units) | $12,180 | ||
UW: 25.0% down · 7.5% · 30yr · 1.5% tax · 5.0% vac · 8.0% maint · 8.0% mgmt
Financing live
Cash to close
- Down payment
- $249,750
- Closing costs
- $29,970
- Reserves months
- —
- Total cash needed
- —
Loan-product check · same deal, 3 products live
Conventional
25% down · 7.5% · 30yr
- Down + closing
- —
- Monthly P&I
- —
- Monthly cashflow
- —
- DSCR
- —
- Eligible?
- —
Personal DTI + credit; lowest rate.
DSCR
20% down · 8.5% · 30yr
- Down + closing
- —
- Monthly P&I
- —
- Monthly cashflow
- —
- DSCR
- —
- Eligible?
- —
No personal income docs; deal must DSCR.
Hard money
10% down · 12.0% · 12mo
- Down + closing
- —
- Monthly P&I
- —
- Monthly cashflow
- —
- DSCR
- —
- Eligible?
- —
Short-term bridge; refi at stabilization.
Listing history 11 events
-
2026-04-14price $999,000 846-char remark
Show marketing remark (846 chars)
Fully Occupied- Premier Downtown Woodstock Investment Opportunity - 8 Residential Units, Commercial Space, and Vacant Lot with 8.19% CAP Rate. A unique and lucrative investment property in the heart of downtown Woodstock, offering a rare combination of immediate rental income, significant tax incentives, and future development potential. This solid brick, multi-family and commercial building, located just off the historic Woodstock Square and steps from the Metra train station. The property includes eight fully occupied one-bedroom, one-bathroom residential apartments, a leased commercial print shop, and a valuable adjacent vacant lot, providing a diverse and stable income stream. Tenants enjoy the convenience of exterior parking, shared laundry facilities, and a dedicated storage area. Located in TIF district & Enterprise Zone.
-
2026-02-04price $1,049,000 846-char remark
Show marketing remark (846 chars)
Fully Occupied- Premier Downtown Woodstock Investment Opportunity - 8 Residential Units, Commercial Space, and Vacant Lot with 8.19% CAP Rate. A unique and lucrative investment property in the heart of downtown Woodstock, offering a rare combination of immediate rental income, significant tax incentives, and future development potential. This solid brick, multi-family and commercial building, located just off the historic Woodstock Square and steps from the Metra train station. The property includes eight fully occupied one-bedroom, one-bathroom residential apartments, a leased commercial print shop, and a valuable adjacent vacant lot, providing a diverse and stable income stream. Tenants enjoy the convenience of exterior parking, shared laundry facilities, and a dedicated storage area. Located in TIF district & Enterprise Zone.
-
2025-06-13historical
-
2025-06-12$1,099,000 Active 846-char remark
Show marketing remark (846 chars)
Fully Occupied- Premier Downtown Woodstock Investment Opportunity - 8 Residential Units, Commercial Space, and Vacant Lot with 8.19% CAP Rate. A unique and lucrative investment property in the heart of downtown Woodstock, offering a rare combination of immediate rental income, significant tax incentives, and future development potential. This solid brick, multi-family and commercial building, located just off the historic Woodstock Square and steps from the Metra train station. The property includes eight fully occupied one-bedroom, one-bathroom residential apartments, a leased commercial print shop, and a valuable adjacent vacant lot, providing a diverse and stable income stream. Tenants enjoy the convenience of exterior parking, shared laundry facilities, and a dedicated storage area. Located in TIF district & Enterprise Zone.
-
2025-01-07Active
-
2025-01-07historical
-
2024-12-04Active
-
2024-09-20soldstatus $675,000 Closed
-
2024-08-28historical Contingent - Continue to Show
-
2024-08-22price $735,000
-
2024-08-20$675,000 Active
ⓘ Source: listings_history table (triggers on properties + properties_extension) + one-shot
backfill from property_details.listing_events for pre-trigger history.
Climate risk First Street
- Flood 1/10 Low FEMA zone X (unshaded) · 0% chance over 30 yrs
- Wildfire 1/10 Low
- Heat 2/10 Low 7 d/yr ≥101°F today · 14 d/yr by 30 yrs out
- Wind 2/10 Low
- Air quality 2/10 Low 1 unhealthy d/yr today · 1 by 30 yrs out
Nearby sold comps map
Loading sold comps map…
Walkable amenities ~0.75 mi
Loading nearby amenities…
Taxation est. · year 1
- Rental income
- $146,160
- − Mortgage interest
- −$55,960
- − Property taxes
- −$14,985
- − Insurance
- −$4,995
- − Repairs & maintenance
- −$11,693
- − Management
- −$11,693
- − Depreciation
- −$29,062
- Taxable income
- $17,773
- Est. tax owed @ 24.0%
- −$4,266
- After-tax cash flow
- $28,354/yr
For passive investors: Depreciation is non-cash, so a rental often shows a tax loss while cash-flowing — sheltering income. Rental losses are passive: they offset passive income freely, and up to $25,000/yr can offset ordinary (W-2) income if you actively participate and your MAGI is under $100k (phasing out to $0 by $150k); unused losses carry forward. On sale, claimed depreciation is recaptured at up to 25%, and gains may owe capital-gains tax (a 1031 exchange can defer both). Figures are a year-1 estimate at your 24.0% rate — not tax advice; consult a CPA.
Condition & rehab AI · 10 photos
This multi-family property is in good condition with a good CAP rate. It offers a combination of residential and commercial spaces, making it a solid investment opportunity.
Value-add opportunities
- Both Paint exterior — Enhances curb appeal and property value
- Both Replace carpet — Improves living space and rental appeal
Renovation cost estimate screening
Value-add ROI direction
- Both Paint exterior — Enhances curb appeal and property value ↑
- Both Replace carpet — Improves living space and rental appeal ↑
ⓘ Cost ranges are severity-bucket heuristics (US national rule-of-thumb). Get contractor quotes + a written scope before underwriting a rehab budget.
Schools (NCES district)
- District
- Woodstock CUSD 200
- NCES district ID
- 1743330
- Math proficiency
- 24% ▼ -8.00%
- Reading proficiency
- 38% ▼ -8.00%
- Median HH income
- $64,309
- Composite
- 28.35/100
- National rank
- #6773
- State rank
- #220 of 620 in IL
Livability — Woodstock
- Score
- 82/100
- State rank
- #66
- US rank
- #1114
Category grades
Schools grade is shown separately in the Schools card above.
Census & demographics
- Census place
- Woodstock, IL
- County
- McHenry County · 204,279 people
- City population
- 33,130
- Metro
- Chicago-Naperville-Elgin, IL-IN-WI
- Population (ZIP)
- 33,130
- Household income
- $91,062
- Rent vs Own
- Severe rent burden
- 759.0
Population outlook (McHenry County) Hauer SSP2
- Today (2025)
- 305,342 people
- By 2030
- 301,491 · -1.3%
- By 2040
- 288,211 · -5.6%
- By 2050
- 268,430 · -12.1%
- By 2075
- 226,209 · -25.9%
- By 2100
- 181,247 · -40.6%
Race, ethnicity, and origin ACS 2023
- Neighborhood character
- Predominantly White (73%)
- Race & ethnicity
- White 73% Hispanic / Latino 20% Two or more races 14% Asian 2% Black 2%
- Hispanic origin (detail)
- Mexican 17% Puerto Rican 1%
- Common ancestry
- Romanian 9% Lithuanian 2% Portuguese 2%
- Foreign-born
- 12% · Canada
- Languages at home
- 79% English-only · Spanish 16% Russian/Polish/Slavic 2% Tagalog/Filipino 1%
Political lean MEDSL · McHenry
- 2024 margin
- Lean R (+5.3) · D 46.6% · R 51.9% · Other 1.5%
- 2008→2024 swing
- -10.6pp toward R · 2008: 5.3pp · 2024: -5.3pp
- All cycles
- 2024: R+5.3 2020: R+2.5 2016: R+8.1 2012: R+8.8 2008: D+5.3
Not yet ingested
- Civics
- —
Market trends
- HPI YoY
- ▼ -88.07%
- Current HPI
- 205.5664
- Rent YoY
- —
- Metro
- Chicago-Naperville-Elgin, IL-IN-WI
- State GDP YoY
- ▲ 1.59%
- F500 in state
- 60
Industry mix (Fortune 500 HQ in IL)
| Industry | F500 HQs | Revenue |
|---|---|---|
| Insurance | 4 | $201B |
|
||
| Consumer Goods | 4 | $87B |
|
||
| Industrial Machinery | 3 | $64B |
|
||
| Healthcare | 2 | $55B |
|
||
| Retail / Pharmacy | 1 | $148B |
|
||
| Agriculture / Food | 1 | $86B |
|
||
Price history
+48.0% since first listed11 events — show timeline
- 2026-04-14 Price Changed $999,000 MRED as Distributed by MLS Grid
- 2026-02-04 Price Changed $1,049,000 MRED as Distributed by MLS Grid
- 2025-06-13 Listing Removed — MRED as Distributed by MLS Grid
- 2025-06-12 Listed $1,099,000 MRED as Distributed by MLS Grid
- 2025-01-07 Listing Removed — MRED as Distributed by MLS Grid
- 2025-01-07 Listed — MRED as Distributed by MLS Grid
- 2024-12-04 Listed — MRED as Distributed by MLS Grid
- 2024-09-20 Sold (MLS) $675,000 MRED as Distributed by MLS Grid
- 2024-08-28 Contingent — MRED as Distributed by MLS Grid
- 2024-08-22 Price Changed $735,000 MRED as Distributed by MLS Grid
- 2024-08-20 Listed $675,000 MRED as Distributed by MLS Grid
Cash-flow waterfall
monthlySold comps — $/sqft
last 12 mo · ≤1 miLoading sold comps…