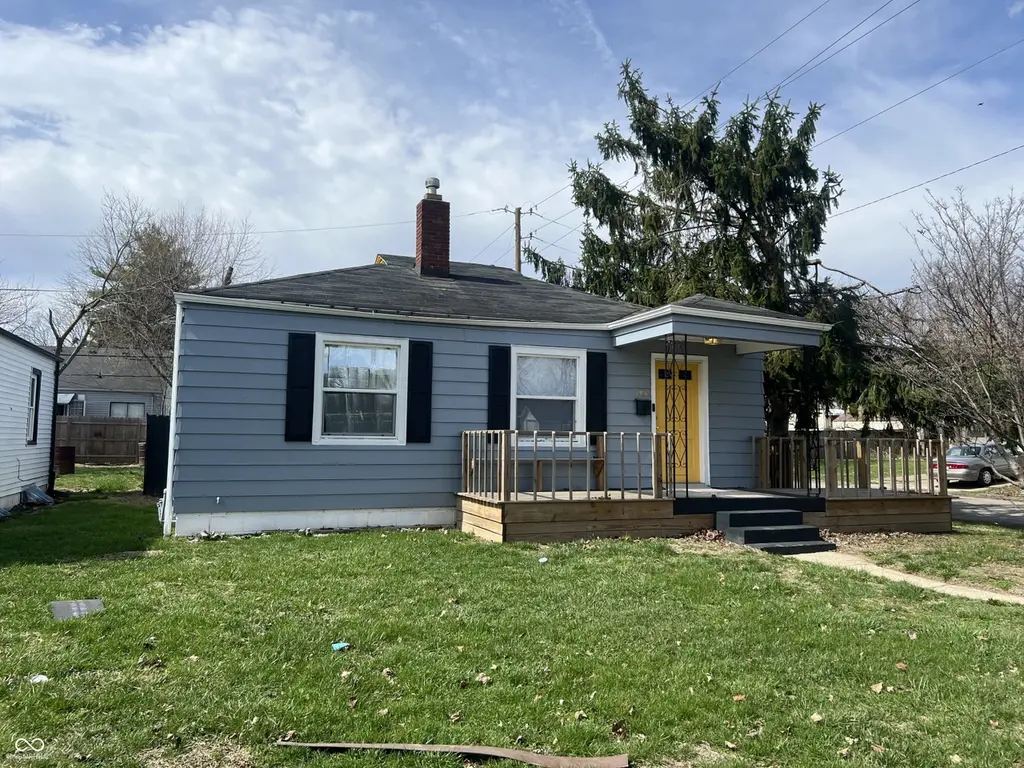
1956 N Drexel Ave · Indianapolis city (balance), IN
Flood risk 1/10 · Minimal
- FEMA flood zone
- X (unshaded)
- Chance of flooding over 30 yrs
- 0.0%
- Est. flood insurance / yr
- $473 – $860
Fire risk 1/10 · Minimal
- Est. fire insurance / yr
- $717 – $1,331
Heat risk 3/10 · Minor
- Hot days now (above 101°F)
- 7 days/yr
- Hot days in 30 yrs
- 18 days/yr
Wind risk 2/10 · Minimal
- Chance of severe wind over 30 yrs
- 0.0%
Air-quality risk 4/10 · Minor
- Unhealthy air days now
- 5 days/yr
- Unhealthy air days in 30 yrs
- 7 days/yr
Risk factors via First Street. Map © Google.
Why this score? — see what drove the D grade
The composite is a weighted blend of 9 inputs, each scored 0–100. Each bar is that input's sub-score; the figure is the points it added to the 100-point composite (weight × sub-score).
- ARV discount +15.0/15.0
- Cash flow +12.1/30.0
- 1% rule +4.4/10.0
- DSCR +3.6/10.0
- Rent growth +2.7/5.0
- Livability +2.5/5.0
- Condition / age +2.5/5.0
- Schools +1.4/10.0
- Appreciation +0.0/10.0
$109,500
🖨 Deal sheet (PDF) 📄 Offer letter ✓ Due diligence
Listing remarks MLS
Remarks Investor or make it your own!! Special, featuring a well maintained home that offers a finished basement.. This bungalow style home features 3 beds | 2 bath with a fenced in back yard, one car garage and covered walkway into the home. Conveniently located within 10 minutes of heart of downtown. Make this your home today! Home being sold as
Key facts
- Finished basement
- Covered walkway
- Fenced in back yard
Tags
Neighborhood map
What this means for you Summary
Snapshot
- This is a 2-bed/2.0-bath single-family listed at $110k.
Deal economics
- At list price, monthly cash flow is $-24 ($-286/yr) — negative.
- To cash-flow at today's rent, offer at most $105k (3.8% below list).
- To meet the 1% rule (rent ≥ 1% of price), the offer needs to be $103k (5.8% below list).
- Recommended offer: $103k (6.0% below list) — sets the bar for market timing.
- Cap rate 6.0% vs local median 4.4% in Indianapolis city (balance) — top-decile yield for the area; either an underpriced asset or a hidden risk that comps aren't pricing in. Stress-test before assuming the spread holds.
Location & tenants
- Location reads: area grade D — affects rentability + tenant quality, not the cash-flow math above.
- Indianapolis Public Schools (urban): math 14% / reading 20% proficiency, ranked #286 of 301 in IN (top 95%) — low school quality limits family demand, transient renter base, plan for 1-2y turnover; 77% free/reduced lunch — lower-income household profile, screen leases tightly.
- Zoned schools: Center For Inquiry School 27 (math 25% / reading 29%, grade F, #737 of 994 statewide, top 76%, 525 students, 51% FRL); H L Harshman Middle School (math 3% / reading 16%, grade F, #316 of 330 statewide, top 96%, 549 students, 84% FRL).
- Market conditions: Rents flat; 338 active listings in the ZIP; 40 comparable units currently listed for rent nearby; rentals at typical pace (median 26d on market — plan ~3-4 weeks tenant-placement turnaround); lower-income renter base — watch delinquency; 1,906 units permitted in Marion County in 2024 (621 in 5+ unit buildings).
- This rent runs 33% of the median local income ($38k/yr) — at the standard rent-burdened threshold; future hikes will face affordability resistance.
Forward outlook
- Local home prices are declining (-3.0%/yr); year-one equity from $757 of loan paydown is wiped out by about $3k of value loss. Plan a longer hold.
- Marion County population projected at +18% by 2050 — long-run rental-demand tailwind backs the buy-and-hold thesis.
Negotiation context
- It's been on market 77 days — a 6% lower offer ($103k) is reasonable based on typical stale-listing flexibility.
- 9 sale attempts since 21y ago; this cycle's ask has dropped $30k (22%) from the opening price — seller is motivated, your offer sets the floor, not the list.
- Current owner paid $80k; 37% above their basis — modest negotiation headroom, anchor on the comps not their cost.
Risks & watch-outs
- Watch-outs: built in 1948 — expect roof / HVAC / electrical / plumbing capex.
Questions for the listing agent
- What do current leases actually rent for vs. the listed asking? Can we see a recent rent roll and the last 12 months of T-12 income?
- It's been on market 77 days. Have you received any prior offers? Is the seller open to a 6% concession, seller financing, or rate buy-down credit?
- Built in 1948 — when were the roof, HVAC, electrical panel, plumbing, and water heater last replaced?
- Why hasn't it sold? Are there any deal-killer items the seller is aware of (foundation, flood, title, zoning, code violations)?
- Is there a deadline driving the sale (1031 exchange, divorce, estate, relocation)? That informs how much negotiation room exists.
- The area grade is low — what's the realistic commute time and amenity access for the typical tenant pool here? Any planned neighborhood developments (good or bad) we should know about?
- What's the average days-on-market for RENTAL listings here right now (not sales)? A rising rental-DOM trend means longer vacancies and softer asking-rent achievability than the comps imply.
- What's the recent tenant-quality profile in this submarket — average credit score on applications, eviction rate, late-payment / NSF rate, and stable-employment percentage? A property-management company in the area should have these aggregated.
- How much new for-sale + rental construction is in the pipeline within 1–3 miles? Heavy new supply typically softens prices + rents 12–24 months out; constrained supply supports both.
Investment metrics
- 1% rule
- 0.94% ✗
- Cap rate
- 6.03%
- Cash-on-cash
- -0.93%
- DSCR
- 0.96
- GRM
- 8.8
CMA / ARV
- ARV (median comp)
- $162,189
- List price
- $109,500
- Delta
- -32.49%
- Verdict
- UNDERPRICED
- Comps
- 20 within 1.0 mi
Show comp detail 12 sales within ~0.75 mi
| Address | Dist | Beds/Ba | Sqft | Sold | Price | $/sf | Match |
|---|---|---|---|---|---|---|---|
| 4733 E 18th St | 0.28mi | 2/1.0 | 748 (-4%) | 10mo | $100,000 | $134 | 68 |
| 2048 N Euclid Ave | 0.20mi | 2/1.0 | 688 (-12%) | 5mo | $62,500 | $91 | 63 |
| 4301 E 21st St | 0.24mi | 3/1.0 (+1) | 864 (+11%) | 0mo | $63,000 | $73 | 62 |
| 4706 E 21st St | 0.18mi | 3/1.5 (+1) | 888 (+14%) | 0mo | $130,000 | $146 | 61 |
| 5320 E 19th St | 0.74mi | 2/1.0 | 768 (-2%) | 0mo | $85,000 | $111 | 58 |
| 2203 N Drexel Ave | 0.34mi | 2/1.0 | 835 (+7%) | 14mo | $30,000 | $36 | 56 |
| 1825 N Hawthorne Ln | 0.73mi | 2/1.0 | 768 (-2%) | 8mo | $128,647 | $168 | 52 |
| 1726 N Euclid Ave | 0.30mi | 2/1.0 | 672 (-14%) | 12mo | $97,000 | $144 | 49 |
| 1536 N Sherman Dr | 0.73mi | 2/1.0 | 816 (+5%) | 7mo | $55,000 | $67 | 48 |
| 1518 N Chester Ave | 0.60mi | 2/1.0 | 672 (-14%) | 4mo | $114,555 | $170 | 42 |
| 2344 N Leland Ave | 0.68mi | 2/1.0 | 720 (-8%) | 12mo | $122,000 | $169 | 41 |
| 1409 N Denny St | 0.74mi | 1/1.0 (-1) | 858 (+10%) | 14mo | $65,000 | $76 | 28 |
Match score weights: distance 35% · size 25% · config 20% · recency 20%. Top-matched comps best support the ARV.
Projected returns pro-forma
-3.0% appreciation · 0.81% rent growth · sell at horizon
- IRR
- -20.5%
- Equity multiple
- 0.30×
- Total profit
- $-21,419
- Equity at exit
- $16,327
- IRR
- -20.2%
- Equity multiple
- 0.05×
- Total profit
- $-29,071
- Equity at exit
- $9,468
Cash invested: $30,660 (down + closing). Projections, not guarantees.
Landlord ↔ Tenant lean methodology
- Overall (STATE)
- 90 Strongly Landlord-Friendly
- State Indiana
- 90 Strongly Landlord-Friendly · R+11
- County
- — inherits STATE
- City
- — inherits STATE
ZIP-level market 46218
- Home prices YoY
- -17.1%
- Rents YoY
- 0.8%
- Active inventory
- 338
- Price-to-rent
- 8.8×
Monthly cashflow live
- Estimated rent
- $1,032 high interval (Pro) →
- Mortgage (P&I)
- −$574
- Tax from tax record
- −$219 /mo · $2,627/yr
- Insurance
- −$46
- HOA
- −$0
- Vacancy / Maint / Mgmt
- −$217
- Net cashflow
- $-24
Break-even live
Sensitivity live
| Price | -10% $38 | -5% $7 | +0% $-24 | +5% $-55 | +10% $-86 |
|---|---|---|---|---|---|
| Rent | -10% $-105 | -5% $-65 | +0% $-24 | +5% $17 | +10% $58 |
| Rate | -1.0pp $31 | -0.5pp $4 | base $-24 | +0.5pp $-52 | +1.0pp $-81 |
UW: 25.0% down · 7.5% · 30yr · 1.5% tax · 5.0% vac · 8.0% maint · 8.0% mgmt
Financing live
Cash to close
- Down payment
- $27,375
- Closing costs
- $3,285
- Reserves months
- —
- Total cash needed
- —
Loan-product check · same deal, 3 products live
Conventional
25% down · 7.5% · 30yr
- Down + closing
- —
- Monthly P&I
- —
- Monthly cashflow
- —
- DSCR
- —
- Eligible?
- —
Personal DTI + credit; lowest rate.
DSCR
20% down · 8.5% · 30yr
- Down + closing
- —
- Monthly P&I
- —
- Monthly cashflow
- —
- DSCR
- —
- Eligible?
- —
No personal income docs; deal must DSCR.
Hard money
10% down · 12.0% · 12mo
- Down + closing
- —
- Monthly P&I
- —
- Monthly cashflow
- —
- DSCR
- —
- Eligible?
- —
Short-term bridge; refi at stabilization.
Rent comps 40 comps
| Address | Beds | Baths | Sqft | Rent | $/sqft | DOM | Units | Dist |
|---|---|---|---|---|---|---|---|---|
| 1951 N Bosart Ave Indianapolis, IN | 2.0 | 1.0 | 728 | $1,000 | $1.37 | 6d | 1 | 0.10mi |
| 2030 N Colorado Ave Indianapolis, IN | 2.0 | 1.0 | 728 | $1,150 | $1.58 | 26d | 1 | 0.23mi |
| 1824 N Riley Ave Indianapolis, IN | 2.0 | 1.0 | 720 | $1,150 | $1.60 | 46d | 1 | 0.36mi |
| 2194 N Riley Ave Indianapolis, IN | 3.0 | 1.0 | 1100 | $1,749 | $1.59 | 46d | 1 | 0.46mi |
| 1512 N Gladstone Ave Unit 1510 1510 Indianapolis, IN | 1.0 | 1.0 | 570 | $830 | $1.46 | 17d | 1 | 0.51mi |
| 1510 N Gladstone Ave Indianapolis, IN | 1.0 | 1.0 | 570 | $765 | $1.34 | 46d | 1 | 0.51mi |
| 1531 N Grant Ave Indianapolis, IN | 1.0 | 1.0 | 611 | $875 | $1.43 | 26d | 1 | 0.51mi |
| 5119 E 21st St Indianapolis, IN | 2.0 | 1.0 | 816 | $1,199 | $1.47 | 46d | 1 | 0.53mi |
| 1450 N Gladstone Ave Indianapolis, IN | 1.0 | 1.0 | 588 | $799 | $1.36 | 46d | 1 | 0.56mi |
| 1506 N Grant Ave Indianapolis, IN | 2.0 | 1.0 | 780 | $1,150 | $1.47 | 17d | 1 | 0.56mi |
| 1432 N Colorado Ave Indianapolis, IN | 1.0 | 1.0 | 584 | $875 | $1.50 | 26d | 1 | 0.57mi |
| 1421 N Colorado Ave Indianapolis, IN | 2.0 | 1.0 | 983 | $1,225 | $1.25 | 26d | 1 | 0.57mi |
| 1509 N Chester Ave Indianapolis, IN | 2.0 | 1.0 | 950 | $1,100 | $1.16 | 0d | 1 | 0.58mi |
| 1509 N Chester Ave Indianapolis, IN | 2.0 | 1.0 | 950 | $1,100 | $1.16 | 24d | 1 | 0.58mi |
| 1518 N Chester Ave Indianapolis, IN | 2.0 | 1.0 | 672 | $700 | $1.04 | 9d | 1 | 0.58mi |
| 1513 N Denny St Indianapolis, IN | 3.0 | 1.0 | 874 | $1,399 | $1.60 | 26d | 1 | 0.61mi |
| 5242 E 20th Pl Indianapolis, IN | 2.0 | 1.0 | 720 | $1,050 | $1.46 | 9d | 1 | 0.70mi |
| 1532 N Sherman Dr Unit 1530 Sherman Indianapolis, IN | 1.0 | 1.0 | 768 | $550 | $0.72 | 4d | 1 | 0.71mi |
| 1417 N Denny St Indianapolis, IN | 2.0 | 1.0 | 1000 | $1,125 | $1.12 | 26d | 1 | 0.71mi |
| 3709 Brookside Parkway South Dr Indianapolis, IN | 1.0 | 1.0 | 742 | $825 | $1.11 | 26d | 1 | 0.71mi |
| 1327 N Chester Ave Indianapolis, IN | 1.0 | 1.0 | 600 | $795 | $1.32 | 16d | 1 | 0.72mi |
| 3617 Brookside Parkway South Dr Indianapolis, IN | 2.0 | 1.0 | 800 | $999 | $1.25 | 26d | 1 | 0.75mi |
| 1306 N Chester Ave Indianapolis, IN | 1.0 | 1.0 | 600 | $800 | $1.33 | 22d | 1 | 0.76mi |
| 5322 E 19th Pl Indianapolis, IN | 2.0 | 1.0 | 720 | $945 | $1.31 | 46d | 1 | 0.77mi |
| 3601 Brookside Parkway South Dr Indianapolis, IN | 2.0 | 1.0 | 1025 | $995 | $0.97 | 46d | 1 | 0.77mi |
| 3601 Brookside Parkway South Dr Indianapolis, IN | 2.0 | 1.0 | 1025 | $995 | $0.97 | 26d | 1 | 0.77mi |
| 1421 N Olney St Indianapolis, IN | 2.0 | 1.0 | 1064 | $975 | $0.92 | 12d | 1 | 0.91mi |
| 1421 N Olney St Indianapolis, IN | 2.0 | 1.0 | 1064 | $975 | $0.92 | 0d | 1 | 0.91mi |
| 1358 N Gale St Indianapolis, IN | 1.0 | 1.0 | 550 | $890 | $1.62 | 18d | 1 | 0.93mi |
| 953 N Linwood Ave Indianapolis, IN | 2.0 | 1.0 | 960 | $1,325 | $1.38 | 46d | 1 | 0.93mi |
| 1505 N Tuxedo St Unit 1507 Indianapolis, IN | 2.0 | 1.0 | 1000 | $1,100 | $1.10 | 46d | 1 | 0.96mi |
| 2312 N Ritter Ave Apt 31 Indianapolis, IN | 2.0 | 1.0 | 725 | $825 | $1.14 | 24d | 1 | 0.98mi |
| 1354 N Olney St Unit 1356 Indianapolis, IN | 1.0 | 1.0 | 765 | $775 | $1.01 | 46d | 1 | 0.98mi |
| 1702 N Ritter Ave Indianapolis, IN | 2.0 | 1.0 | 750 | $1,200 | $1.60 | 6d | 1 | 0.99mi |
| 896 N Gladstone Ave Indianapolis, IN | 1.0 | 1.0 | 580 | $775 | $1.34 | 46d | 1 | 1.00mi |
| 2302 N Ritter Ave Indianapolis, IN | 2.0 | 1.0 | 725 | $788 | $1.09 | 9d | 2 | 1.00mi |
| 1301 N Olney St Unit 1303 Indianapolis, IN | 2.0 | 1.0 | 750 | $1,100 | $1.47 | 46d | 1 | 1.01mi |
| 2304 N Ritter Ave Apt 9 Indianapolis, IN | 2.0 | 1.0 | 725 | $799 | $1.10 | 22d | 1 | 1.02mi |
| 2308 N Ritter Ave Apt 24 Indianapolis, IN | 2.0 | 1.0 | 725 | $825 | $1.14 | 22d | 1 | 1.02mi |
| 861 N Drexel Ave Unit 863 Indianapolis, IN | 3.0 | 1.0 | 1000 | $1,200 | $1.20 | 46d | 1 | 1.03mi |
Listing history 38 events
-
2026-06-21days on market $109,500 Active 77 DOM
-
2026-06-18days on market $109,500 Active 74 DOM
-
2026-06-17days on market $109,500 Active 73 DOM
-
2026-06-16days on market $109,500 Active 72 DOM
-
2026-06-15pricedays on market $109,500 Active 71 DOM
-
2026-06-13days on market $110,000 Active 69 DOM
-
2026-06-13days on market $110,000 Active 68 DOM
-
2026-06-09days on market $110,000 Active 65 DOM
-
2026-06-08days on market $110,000 Active 64 DOM
-
2026-06-07pricedays on market $110,000 Active 63 DOM
-
2026-06-03days on market $120,000 Active 59 DOM
-
2026-06-02days on market $120,000 Active 58 DOM
-
2026-06-01days on market $120,000 Active 57 DOM
-
2026-05-31days on market $120,000 Active 56 DOM
-
2026-05-15price $120,000 350-char remark
Show marketing remark (350 chars)
Remarks Investor or make it your own!! Special, featuring a well maintained home that offers a finished basement.. This bungalow style home features 3 beds | 2 bath with a fenced in back yard, one car garage and covered walkway into the home. Conveniently located within 10 minutes of heart of downtown. Make this your home today! Home being sold as
-
2026-05-08price $129,999 350-char remark
Show marketing remark (350 chars)
Remarks Investor or make it your own!! Special, featuring a well maintained home that offers a finished basement.. This bungalow style home features 3 beds | 2 bath with a fenced in back yard, one car garage and covered walkway into the home. Conveniently located within 10 minutes of heart of downtown. Make this your home today! Home being sold as
-
2026-05-04price $132,999 350-char remark
Show marketing remark (350 chars)
Remarks Investor or make it your own!! Special, featuring a well maintained home that offers a finished basement.. This bungalow style home features 3 beds | 2 bath with a fenced in back yard, one car garage and covered walkway into the home. Conveniently located within 10 minutes of heart of downtown. Make this your home today! Home being sold as
-
2026-04-18price $134,999 350-char remark
Show marketing remark (350 chars)
Remarks Investor or make it your own!! Special, featuring a well maintained home that offers a finished basement.. This bungalow style home features 3 beds | 2 bath with a fenced in back yard, one car garage and covered walkway into the home. Conveniently located within 10 minutes of heart of downtown. Make this your home today! Home being sold as
-
2026-04-05$139,999 Active 350-char remark
Show marketing remark (350 chars)
Remarks Investor or make it your own!! Special, featuring a well maintained home that offers a finished basement.. This bungalow style home features 3 beds | 2 bath with a fenced in back yard, one car garage and covered walkway into the home. Conveniently located within 10 minutes of heart of downtown. Make this your home today! Home being sold as
-
2024-02-08soldstatus $80,000 Closed 440-char remark
Show marketing remark (440 chars)
Investor special featuring a well maintained home that needs minor cosmetic updates. This bungalow style home features 2 beds | 1 bath with a fully fenced in back yard, one car garage and covered walkway into the home. With minor cosmetic updates, the home has an estimated after repair value of $135,000~ & an estimated rental amount of $1050~/mo. Conveniently located within 10 minutes of heart of downtown. Make this your home today!
-
2024-02-02status Pending 440-char remark
Show marketing remark (440 chars)
Investor special featuring a well maintained home that needs minor cosmetic updates. This bungalow style home features 2 beds | 1 bath with a fully fenced in back yard, one car garage and covered walkway into the home. With minor cosmetic updates, the home has an estimated after repair value of $135,000~ & an estimated rental amount of $1050~/mo. Conveniently located within 10 minutes of heart of downtown. Make this your home today!
-
2024-01-26status Active 440-char remark
Show marketing remark (440 chars)
Investor special featuring a well maintained home that needs minor cosmetic updates. This bungalow style home features 2 beds | 1 bath with a fully fenced in back yard, one car garage and covered walkway into the home. With minor cosmetic updates, the home has an estimated after repair value of $135,000~ & an estimated rental amount of $1050~/mo. Conveniently located within 10 minutes of heart of downtown. Make this your home today!
-
2024-01-09status Pending 440-char remark
Show marketing remark (440 chars)
Investor special featuring a well maintained home that needs minor cosmetic updates. This bungalow style home features 2 beds | 1 bath with a fully fenced in back yard, one car garage and covered walkway into the home. With minor cosmetic updates, the home has an estimated after repair value of $135,000~ & an estimated rental amount of $1050~/mo. Conveniently located within 10 minutes of heart of downtown. Make this your home today!
-
2023-12-29$84,900 Active 440-char remark
Show marketing remark (440 chars)
Investor special featuring a well maintained home that needs minor cosmetic updates. This bungalow style home features 2 beds | 1 bath with a fully fenced in back yard, one car garage and covered walkway into the home. With minor cosmetic updates, the home has an estimated after repair value of $135,000~ & an estimated rental amount of $1050~/mo. Conveniently located within 10 minutes of heart of downtown. Make this your home today!
-
2023-09-28historical
-
2023-09-14$80,000 Active
-
2020-09-15soldstatus $50,000 Sold
-
2020-09-11status Pending
-
2020-09-03status Pending
-
2020-09-03$55,000 Active
-
2013-09-21historical
-
2012-06-11$52,900
-
2010-04-01historical
-
2009-07-30$44,000
-
2008-02-01soldstatus $16,000
-
2008-01-16$19,900
-
2005-12-30soldstatus $35,000
-
2005-04-15$40,000
ⓘ Source: listings_history table (triggers on properties + properties_extension) + one-shot
backfill from property_details.listing_events for pre-trigger history.
Tax reassessment forecast IN · Partial reset (capped growth)
- Current annual tax
- $2,627 · $219/mo
- Projected year-2 tax
- $2,627 · $219/mo
- Expected delta
- $0/yr ($0/mo · 0.0%)
ⓘ Screening estimate from a state-policy table — verify with the county assessor before closing.
Climate risk First Street
- Flood 1/10 Low FEMA zone X (unshaded) · 0% chance over 30 yrs
- Wildfire 1/10 Low
- Heat 3/10 Moderate 7 d/yr ≥101°F today · 18 d/yr by 30 yrs out
- Wind 2/10 Low 0% chance of damaging wind over 30 yrs
- Air quality 4/10 Moderate 5 unhealthy d/yr today · 7 by 30 yrs out
Nearby sold comps map
Loading sold comps map…
Walkable amenities ~0.75 mi
Loading nearby amenities…
Taxation est. · year 1
- Rental income
- $12,379
- − Mortgage interest
- −$6,134
- − Property taxes
- −$2,627
- − Insurance
- −$548
- − Repairs & maintenance
- −$990
- − Management
- −$990
- − Depreciation
- −$3,185
- Taxable loss
- −$2,095
- Est. tax savings @ 24.0%
- +$503
- After-tax cash flow
- $217/yr
For passive investors: Depreciation is non-cash, so a rental often shows a tax loss while cash-flowing — sheltering income. Rental losses are passive: they offset passive income freely, and up to $25,000/yr can offset ordinary (W-2) income if you actively participate and your MAGI is under $100k (phasing out to $0 by $150k); unused losses carry forward. On sale, claimed depreciation is recaptured at up to 25%, and gains may owe capital-gains tax (a 1031 exchange can defer both). Figures are a year-1 estimate at your 24.0% rate — not tax advice; consult a CPA.
Schools (NCES district)
- District
- Indianapolis Public Schools
- NCES district ID
- 1804770
- Math proficiency
- 14% ▼ -7.00%
- Reading proficiency
- 20% ▼ -3.00%
- Median HH income
- $32,034
- Composite
- 13.69/100
- National rank
- #9499
- State rank
- #286 of 301 in IN
Livability — Indianapolis city (balance)
No livability data for this city. (Only ~50 U.S. cities are tracked.)
Census & demographics
- Census place
- Indianapolis city (balance), IN
- County
- Marion County · 998,460 people
- City population
- 881,119
- Metro
- Indianapolis-Carmel-Anderson, IN
- Population (ZIP)
- 29,360
- Household income
- $38,063
- Rent vs Own
- Severe rent burden
- 2340.0
Population outlook (Marion County) Hauer SSP2
- Today (2025)
- 1,025,572 people
- By 2030
- 1,065,727 · +3.9%
- By 2040
- 1,141,577 · +11.3%
- By 2050
- 1,208,920 · +17.9%
- By 2075
- 1,367,288 · +33.3%
- By 2100
- 1,438,201 · +40.2%
Race, ethnicity, and origin ACS 2023
- Neighborhood character
- Predominantly Black (68%)
- Race & ethnicity
- Black 68% White 18% Hispanic / Latino 9% Two or more races 6%
- Hispanic origin (detail)
- Mexican 6%
- Common ancestry
- Romanian 1%
- Foreign-born
- 5% · Canada, Philippines
- Languages at home
- 92% English-only · Spanish 7%
Political lean MEDSL · Marion
- 2024 margin
- Strong D (+27.7) · D 63.0% · R 35.3% · Other 1.7%
- 2008→2024 swing
- -0.7pp no change · 2008: 28.4pp · 2024: 27.7pp
- All cycles
- 2024: D+27.7 2020: D+29.1 2016: D+22.8 2012: D+22.2 2008: D+28.4
Not yet ingested
- Civics
- —
Market trends
- HPI YoY
- ▼ -81.57%
- Current HPI
- 395.7071
- Rent YoY
- ▲ 0.81%
- Metro
- Indianapolis-Carmel-Anderson, IN
- State GDP YoY
- ▲ 2.90%
- F500 in state
- 18
Industry mix (Fortune 500 HQ in IN)
| Industry | F500 HQs | Revenue |
|---|---|---|
| Industrial Machinery | 2 | $37B |
|
||
| Healthcare | 1 | $177B |
|
||
| Pharmaceuticals | 1 | $45B |
|
||
| Metals / Steel | 1 | $18B |
|
||
| Agriculture | 1 | $17B |
|
||
| Packaging | 1 | $12B |
|
||
Price history
+200.0% since first listed24 events — show timeline
- 2026-05-15 Price Changed $120,000 MIBOR as Distributed by MLS Grid
- 2026-05-08 Price Changed $129,999 MIBOR as Distributed by MLS Grid
- 2026-05-04 Price Changed $132,999 MIBOR as Distributed by MLS Grid
- 2026-04-18 Price Changed $134,999 MIBOR as Distributed by MLS Grid
- 2026-04-05 Listed $139,999 MIBOR as Distributed by MLS Grid
- 2024-02-08 Sold (MLS) $80,000 MIBOR as Distributed by MLS Grid
- 2024-02-02 Pending — MIBOR as Distributed by MLS Grid
- 2024-01-26 Relisted — MIBOR as Distributed by MLS Grid
- 2024-01-09 Pending — MIBOR as Distributed by MLS Grid
- 2023-12-29 Listed $84,900 MIBOR as Distributed by MLS Grid
- 2023-09-28 Listing Removed — MIBOR as Distributed by MLS Grid
- 2023-09-14 Listed $80,000 MIBOR as Distributed by MLS Grid
- 2020-09-15 Sold (MLS) $50,000 MIBOR as Distributed by MLS Grid
- 2020-09-11 Pending — MIBOR as Distributed by MLS Grid
- 2020-09-03 Pending — MIBOR as Distributed by MLS Grid
- 2020-09-03 Listed $55,000 MIBOR as Distributed by MLS Grid
- 2013-09-21 Listing Removed — MIBOR as Distributed by MLS Grid
- 2012-06-11 Listed $52,900 MIBOR as Distributed by MLS Grid
- 2010-04-01 Listing Removed — MIBOR as Distributed by MLS Grid
- 2009-07-30 Listed $44,000 MIBOR as Distributed by MLS Grid
- 2008-02-01 Sold (MLS) $16,000 MIBOR as Distributed by MLS Grid
- 2008-01-16 Listed $19,900 MIBOR as Distributed by MLS Grid
- 2005-12-30 Sold (MLS) $35,000 MIBOR as Distributed by MLS Grid
- 2005-04-15 Listed $40,000 MIBOR as Distributed by MLS Grid
Property tax history
+11.9%/yrLatest (2025): $2,627 · +46.5% YoY. Source: county tax records.
Cash-flow waterfall
monthlySold comps — $/sqft
last 12 mo · ≤1 miLoading sold comps…