1100 NW 87th Ave #208 · Coral Springs, FL
Flood risk 1/10 · Minimal
- FEMA flood zone
- X (shaded)
- Chance of flooding over 30 yrs
- 0.0%
- Est. flood insurance / yr
- $507 – $1,088
Fire risk 1/10 · Minimal
- Est. fire insurance / yr
- $947 – $1,759
Heat risk 9/10 · Severe
- Hot days now (above 106°F)
- 6 days/yr
- Hot days in 30 yrs
- 23 days/yr
Wind risk 10/10 · Severe
- Chance of severe wind over 30 yrs
- 99.0%
Air-quality risk 3/10 · Minor
- Unhealthy air days now
- 3 days/yr
- Unhealthy air days in 30 yrs
- 3 days/yr
Risk factors via First Street. Map © Google.
Why this score? — see what drove the D grade
The composite is a weighted blend of 9 inputs, each scored 0–100. Each bar is that input's sub-score; the figure is the points it added to the 100-point composite (weight × sub-score).
- Cash flow +9.6/30.0
- 1% rule +7.8/10.0
- ARV discount +7.5/15.0
- Schools +4.1/10.0
- Livability +4.0/5.0
- DSCR +2.7/10.0
- Condition / age +2.5/5.0
- Rent growth +2.4/5.0
- Appreciation +0.0/10.0
$169,900
🖨 Deal sheet (PDF) 📄 Offer letter ✓ Due diligence
Listing remarks
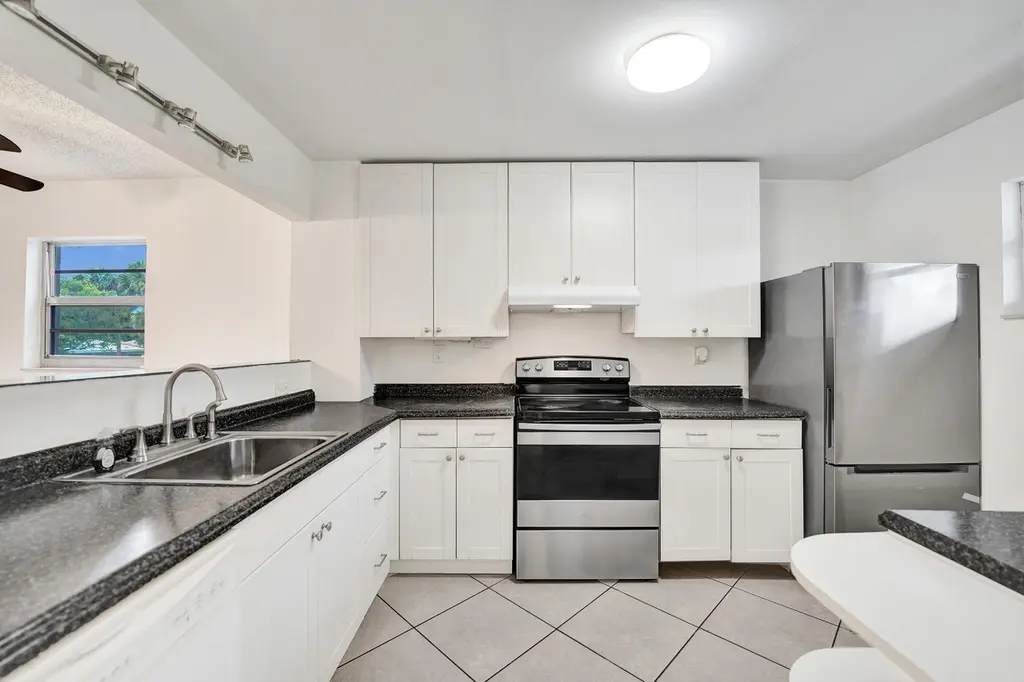
Discover this Spacious 2 bed 2 bath corner unit perfectly situated in the heart of Coral Springs. The open floor plan offers a seamless flow between the light and sunny living room with lots of windows and the bright white kitchen. Enjoy your morning coffee in the screened-in patio overlooking the pool. This unit features a split floorpan with two large bedrooms—including a walk-in closet in the Master and a second bedroom with a custom built-out closet. The community is very well maintained offering a community pool and tennis courts. It is conveniently located near top-rated schools, shopping, and steps from the mall, with an abundance of restaurants—this is the perfect place
Key facts
- Community pool
- Walk-in closet
- Screened-in patio
Tags
Property features AI
Finance
- Financial info: No land lease; Pets not allowed
- HOA & community: Monthly association fee of $547; Association amenities include clubhouse, elevator(s), laundry, picnic area, parking, pool, tennis courts, trash chute, lobby, maintained community; HOA fee covers insurance, grounds maintenance, sewer, trash, water, common areas, elevator, reserve funds, roof repairs, pool service
Exterior
- Parking: Assigned covered parking; Guest and open parking available; 1 open parking space (1 total listed)
- Security: Fire alarm; Key card entry; Smoke detector(s); Entry phone/intercom
- Utilities: Public water; Public sewer; Cable available; Electricity available; Water connected
- Home design: Condominium; Resale condition; Faces east; 4-story building
- Construction: Stucco and CBS construction
- Exterior features: Not waterfront; Tile roof; Slab foundation
Interior
- Kitchen: Dishwasher; Electric range; Microwave; Refrigerator
- Bedrooms: 2 bedrooms on the main level
- Flooring: Ceramic tile; Tile; Wood
- Bathrooms: 2 full bathrooms on the main level
- Heating & cooling: Central heating; Central air; Ceiling fan(s)
- Interior features: Entrance foyer; Walk-in closet(s); Split bedroom layout
- Laundry & utility: Common area laundry
Neighborhood map
What this means for you Summary
Snapshot
- This is a 2-bed/2.0-bath condo listed at $170k.
Deal economics
- At list price, monthly cash flow is $-116 ($-1k/yr) — negative.
- To cash-flow at today's rent, offer at most $149k (12.1% below list).
- Meets the 1% rule at list price ($2k rent vs $170k).
- Recommended offer: $149k (12.1% below list) — sets the bar for cash-flow.
- Cap rate 5.5% vs local median 3.6% in Coral Springs — top-decile yield for the area; either an underpriced asset or a hidden risk that comps aren't pricing in. Stress-test before assuming the spread holds.
Location & tenants
- Location reads 79/100 on livability (#145 in FL, #2,163 nationally) — a middle-class / working-renter tenant base. Strengths: housing A+, health & safety A+, crime A; Watch: amenities F, cost of living F.
- Broward (suburban): math 42% / reading 53% proficiency, ranked #46 of 73 in FL (top 63%) — families likely to look elsewhere, expect single-tenant / working-renter base with shorter leases.
- Zoned schools: Ramblewood Elementary School (math 28% / reading 45%, grade F, #1,656 of 2,144 statewide, top 78%, 709 students, 58% FRL); Ramblewood Middle School (math 43% / reading 49%, grade D+, #300 of 571 statewide, top 53%, 1,125 students, 58% FRL); J. P. Taravella High School (math 19% / reading 45%, grade F, #415 of 667 statewide, top 63%, 2,586 students, 54% FRL).
- Market conditions: Rents soft (-0.6%/yr); 246 active listings in the ZIP; 40 comparable units currently listed for rent nearby; rentals at typical pace (median 17d on market — plan ~3-4 weeks tenant-placement turnaround); solid renter incomes; 2,111 units permitted in Broward County in 2024 (1,265 in 5+ unit buildings).
Forward outlook
- Local home prices are declining (-3.0%/yr); year-one equity from $1k of loan paydown is wiped out by about $5k of value loss. Plan a longer hold.
- Broward County population projected at +34% by 2050 — long-run rental-demand tailwind backs the buy-and-hold thesis.
Negotiation context
- It's been on market 29 days — a 2% lower offer ($167k) is reasonable based on typical stale-listing flexibility.
- 9 sale attempts with the ask held roughly flat each time — persistent listings suggest the price (not the market) is what's stuck; bring a comps-based counter.
- Current owner paid $59k; list at $170k implies a 188% gain — meaningful room to come down on a strong offer.
Risks & watch-outs
- Watch-outs: HOA is 25% of rent.
- Climate carrying-cost: severe wind risk, 99% chance of damaging wind over 30y; extreme-heat days projected 6→23/yr by 2055 (HVAC capex compounding) — expect insurance premiums to compound above CPI over the hold.
Questions for the listing agent
- What do current leases actually rent for vs. the listed asking? Can we see a recent rent roll and the last 12 months of T-12 income?
- What does the HOA fee cover, when was the last increase, and are there any pending special assessments or reserve-fund shortfalls?
- Any open or pending special assessments — roof, HVAC, plumbing, elevator, façade? What's the per-unit balance and payoff schedule, and is the seller paying it off at close or rolling it to the buyer?
- Is there a deadline driving the sale (1031 exchange, divorce, estate, relocation)? That informs how much negotiation room exists.
- Schools are A-rated — typically a magnet for longer-tenancy family renters. What's the average tenant stay here, and is there a school-zone premium baked into asking?
- The area grade is low — what's the realistic commute time and amenity access for the typical tenant pool here? Any planned neighborhood developments (good or bad) we should know about?
- What's the average days-on-market for RENTAL listings here right now (not sales)? A rising rental-DOM trend means longer vacancies and softer asking-rent achievability than the comps imply.
- What's the recent tenant-quality profile in this submarket — average credit score on applications, eviction rate, late-payment / NSF rate, and stable-employment percentage? A property-management company in the area should have these aggregated.
- How much new apartment / multifamily construction is in the pipeline within 1–3 miles? Heavy new supply (>2% of stock underway) typically softens rents 12–24 months out; light construction supports rent growth.
Investment metrics
- 1% rule
- 1.28% ✓
- Cap rate
- 5.47%
- Cash-on-cash
- -2.93%
- DSCR
- 0.87
- GRM
- 6.5
CMA / ARV
No comps found within radius.
Projected returns pro-forma
-3.0% appreciation · 0.0% rent growth · sell at horizon
- IRR
- -26.5%
- Equity multiple
- 0.14×
- Total profit
- $-40,856
- Equity at exit
- $25,333
- IRR
- -54.9%
- Equity multiple
- -0.43×
- Total profit
- $-67,926
- Equity at exit
- $14,690
Cash invested: $47,572 (down + closing). Projections, not guarantees.
Landlord ↔ Tenant lean methodology
- Overall (STATE)
- 87 Strongly Landlord-Friendly
- State Florida
- 87 Strongly Landlord-Friendly · R+3
- County
- — inherits STATE
- City
- — inherits STATE
ZIP-level market 33071
- Home prices YoY
- -35.0%
- Rents YoY
- -0.6%
- Active inventory
- 246
- Price-to-rent
- 6.5×
Monthly cashflow live
- Estimated rent
- $2,172 high interval (Pro) →
- Mortgage (P&I)
- −$891
- Tax from tax record
- −$323 /mo · $3,881/yr
- Insurance
- −$71
- HOA
- −$547
- Vacancy / Maint / Mgmt
- −$456
- Net cashflow
- $-116
Break-even live
Sensitivity live
| Price | -10% $-20 | -5% $-68 | +0% $-116 | +5% $-164 | +10% $-212 |
|---|---|---|---|---|---|
| Rent | -10% $-288 | -5% $-202 | +0% $-116 | +5% $-30 | +10% $55 |
| Rate | -1.0pp $-31 | -0.5pp $-73 | base $-116 | +0.5pp $-160 | +1.0pp $-205 |
UW: 25.0% down · 7.5% · 30yr · 1.5% tax · 5.0% vac · 8.0% maint · 8.0% mgmt
Financing live
Cash to close
- Down payment
- $42,475
- Closing costs
- $5,097
- Reserves months
- —
- Total cash needed
- —
Loan-product check · same deal, 3 products live
Conventional
25% down · 7.5% · 30yr
- Down + closing
- —
- Monthly P&I
- —
- Monthly cashflow
- —
- DSCR
- —
- Eligible?
- —
Personal DTI + credit; lowest rate.
DSCR
20% down · 8.5% · 30yr
- Down + closing
- —
- Monthly P&I
- —
- Monthly cashflow
- —
- DSCR
- —
- Eligible?
- —
No personal income docs; deal must DSCR.
Hard money
10% down · 12.0% · 12mo
- Down + closing
- —
- Monthly P&I
- —
- Monthly cashflow
- —
- DSCR
- —
- Eligible?
- —
Short-term bridge; refi at stabilization.
Rent comps 40 comps
| Address | Beds | Baths | Sqft | Rent | $/sqft | DOM | Units | Dist |
|---|---|---|---|---|---|---|---|---|
| 1100 NW 87th Ave Coral Springs, FL | 2.0 | 2.0 | 1045 | $1,675 | $1.60 | 15d | 2 | 0.04mi |
| 1100 NW 87th Ave #208 Coral Springs, FL | 2.0 | 2.0 | 1100 | $1,700 | $1.55 | 18d | 1 | 0.04mi |
| 1075 Riverside Dr #306 Coral Springs, FL | 2.0 | 2.0 | 990 | $1,899 | $1.92 | 25d | 1 | 0.08mi |
| 8720 Shadow Wood Blvd Coral Springs, FL | 1.0–2.0 | 1.5–2.0 | 1050 | $2,000 | $1.90 | 4d | 3 | 0.08mi |
| 8777 Shadow Wood Blvd #301 Coral Springs, FL | 3.0 | 2.0 | 1100 | $2,350 | $2.14 | 25d | 1 | 0.13mi |
| 8763 Shadow Wood Blvd #202 Coral Springs, FL | 3.0 | 2.0 | 1100 | $2,500 | $2.27 | 25d | 1 | 0.15mi |
| 8773 Shadow Wood Blvd #303 Coral Springs, FL | 3.0 | 2.0 | 1100 | $2,500 | $2.27 | 25d | 1 | 0.15mi |
| 995 Riverside Dr #111 Coral Springs, FL | 2.0 | 2.0 | 1200 | $2,400 | $2.00 | 18d | 1 | 0.15mi |
| 875 Riverside Dr Coral Springs, FL | 2.0 | 2.0 | 1000 | $2,225 | $2.23 | 9d | 2 | 0.23mi |
| 875 Riverside Dr Coral Springs, FL | 2.0 | 2.0 | 1000 | $2,225 | $2.23 | 12d | 2 | 0.23mi |
| 799 Riverside Dr #1021 Coral Springs, FL | 2.0 | 2.0 | 1060 | $2,400 | $2.26 | 20d | 1 | 0.24mi |
| 9000 Ramblewood Dr Apt 605 Coral Springs, FL | 1.0 | 1.0 | 743 | $1,971 | $2.65 | 5d | 1 | 0.25mi |
| 9000 Ramblewood Dr Apt 605 Coral Springs, FL | 1.0 | 1.0 | 743 | $2,208 | $2.97 | 25d | 1 | 0.25mi |
| 755 Riverside Dr Coral Springs, FL | 1.0 | 1.0 | 780 | $1,700 | $2.18 | 12d | 2 | 0.27mi |
| 777 Riverside Dr #1512 Coral Springs, FL | 1.0 | 1.0 | 950 | $1,750 | $1.84 | 25d | 1 | 0.28mi |
| 755 Riverside Dr #1335 Coral Springs, FL | 1.0 | 1.0 | 780 | $1,800 | $2.31 | 9d | 1 | 0.28mi |
| 9000 Ramblewood Dr Coral Springs, FL | 1.0 | 1.0 | 765 | $2,228 | $2.91 | 0d | 1 | 0.28mi |
| 9000 Ramblewood Dr Coral Springs, FL | 2.0 | 2.0 | 1127 | $2,675 | $2.37 | 25d | 1 | 0.28mi |
| 9000 Ramblewood Dr Coral Springs, FL | 2.0 | 2.0 | 1127 | $2,655 | $2.36 | 22d | 1 | 0.28mi |
| 1599 NW 91st Ave Coral Springs, FL | 1.0–3.0 | 1.0–2.0 | 1120 | $2,324 | $2.07 | 0d | 33 | 0.41mi |
| 9111 Ramblewood Dr Coral Springs, FL | 1.0–3.0 | 1.0–2.0 | 1131 | $2,478 | $2.19 | 0d | 25 | 0.43mi |
| 1351 NW 94th Way Unit 1 Coral Springs, FL | 2.0 | 1.5 | 837 | $1,700 | $2.03 | 3d | 1 | 0.59mi |
| 1351 NW 94th Way #1351 Coral Springs, FL | 2.0 | 1.5 | 837 | $1,700 | $2.03 | 25d | 1 | 0.59mi |
| 1357 NW 94th Way #1357 Coral Springs, FL | 2.0 | 1.5 | 837 | $1,875 | $2.24 | 16d | 1 | 0.59mi |
| 9022 W Atlantic Blvd #214 Coral Springs, FL | 2.0 | 2.0 | 986 | $2,000 | $2.03 | 6d | 1 | 0.60mi |
| 9066 W Atlantic Blvd #433 Coral Springs, FL | 2.0 | 2.0 | 986 | $1,950 | $1.98 | 25d | 1 | 0.60mi |
| 9288 W Atlantic Blvd #1114 Coral Springs, FL | 2.0 | 2.0 | 986 | $2,250 | $2.28 | 25d | 1 | 0.61mi |
| 9266 W Atlantic Blvd #1026 Coral Springs, FL | 2.0 | 2.0 | 986 | $2,000 | $2.03 | 25d | 1 | 0.61mi |
| 9266 W Atlantic Blvd #1025 Coral Springs, FL | 2.0 | 2.0 | 986 | $2,000 | $2.03 | 16d | 1 | 0.61mi |
| 9266 W Atlantic Blvd #1025 Coral Springs, FL | 2.0 | 2.0 | 986 | $2,000 | $2.03 | 9d | 1 | 0.61mi |
| 9088 W Atlantic Blvd #523 Coral Springs, FL | 2.0 | 2.0 | 986 | $1,900 | $1.93 | 20d | 1 | 0.64mi |
| 9244 W Atlantic Blvd Coral Springs, FL | 3.0 | 2.0 | 1263 | $2,475 | $1.96 | 25d | 1 | 0.65mi |
| 8509 Shadow Ct Unit 2-11 Coral Springs, FL | 3.0 | 2.5 | 1320 | $2,900 | $2.20 | 25d | 1 | 0.66mi |
| 8509 Shadow Ct Unit 8509 Coral Springs, FL | 3.0 | 2.5 | 1450 | $3,000 | $2.07 | 25d | 1 | 0.66mi |
| 9100 W Atlantic Blvd #636 Coral Springs, FL | 3.0 | 2.0 | 1263 | $2,650 | $2.10 | 16d | 1 | 0.67mi |
| 9100 W Atlantic Blvd #636 Coral Springs, FL | 3.0 | 2.0 | 1263 | $2,650 | $2.10 | 6d | 1 | 0.67mi |
| 1020 NW 80th Ave #203 Margate, FL | 2.0 | 2.0 | 1000 | $1,900 | $1.90 | 14d | 1 | 0.69mi |
| 1020 NW 80th Ave #203 Margate, FL | 2.0 | 2.0 | 1000 | $1,900 | $1.90 | 3d | 1 | 0.69mi |
| 9122 W Atlantic Blvd #724 Coral Springs, FL | 2.0 | 2.0 | 986 | $2,150 | $2.18 | 9d | 1 | 0.69mi |
| 1480 NW 80th Ave #402 Margate, FL | 2.0 | 2.0 | 1000 | $1,875 | $1.88 | 9d | 1 | 0.70mi |
HOA detail condo
- Monthly dues
- $547 · $6,564/yr
- Likely covers
- pool
- Assessments
- None detected in remarks — confirm with the listing agent.
Listing history 23 events
-
2026-06-02days on market $169,900 Active 29 DOM
-
2026-06-01days on market $169,900 Active 28 DOM
-
2026-05-31days on market $169,900 Active 27 DOM
-
2026-04-30$169,900 Active
-
2026-04-23$1,700
-
2026-04-16historical $1,700
-
2026-04-01$1,700
-
2026-04-01historical $1,750
-
2026-01-09$1,750
-
2025-12-13historical $1,750
-
2025-10-17$1,750
-
2025-09-06historical $1,800
-
2025-08-30$1,800
-
2025-08-01historical $1,800
-
2025-07-01$1,800
-
2025-07-01historical $1,850
-
2025-03-30price $1,850
-
2025-03-13$1,950
-
2025-02-19historical $1,950
-
2025-02-03$1,950
-
2000-08-21soldstatus $59,000
-
1999-02-23soldstatus $55,000
-
1985-04-01soldstatus $42,000
ⓘ Source: listings_history table (triggers on properties + properties_extension) + one-shot
backfill from property_details.listing_events for pre-trigger history.
Tax reassessment forecast FL · Resets to sale price
- Current annual tax
- $3,881 · $323/mo
- Projected year-2 tax
- $3,881 · $323/mo
- Expected delta
- $0/yr ($0/mo · 0.0%)
ⓘ Screening estimate from a state-policy table — verify with the county assessor before closing.
Climate risk First Street
- Flood 1/10 Low FEMA zone X (shaded) · 0% chance over 30 yrs
- Wildfire 1/10 Low
- Heat 9/10 Extreme 6 d/yr ≥106°F today · 23 d/yr by 30 yrs out
- Wind 10/10 Extreme 99% chance of damaging wind over 30 yrs
- Air quality 3/10 Moderate 3 unhealthy d/yr today · 3 by 30 yrs out
Nearby sold comps map
Loading sold comps map…
Walkable amenities ~0.75 mi
Loading nearby amenities…
Taxation est. · year 1
- Rental income
- $26,067
- − Mortgage interest
- −$9,517
- − Property taxes
- −$3,881
- − Insurance
- −$850
- − Repairs & maintenance
- −$2,085
- − Management
- −$2,085
- − HOA
- −$6,564
- − Depreciation
- −$4,943
- Taxable loss
- −$3,858
- Est. tax savings @ 24.0%
- +$926
- After-tax cash flow
- $-468/yr
For passive investors: Depreciation is non-cash, so a rental often shows a tax loss while cash-flowing — sheltering income. Rental losses are passive: they offset passive income freely, and up to $25,000/yr can offset ordinary (W-2) income if you actively participate and your MAGI is under $100k (phasing out to $0 by $150k); unused losses carry forward. On sale, claimed depreciation is recaptured at up to 25%, and gains may owe capital-gains tax (a 1031 exchange can defer both). Figures are a year-1 estimate at your 24.0% rate — not tax advice; consult a CPA.
Schools (NCES district)
- District
- Broward
- NCES district ID
- 1200180
- Math proficiency
- 42% ▼ -18.00%
- Reading proficiency
- 53% ▼ -5.00%
- Median HH income
- $52,139
- Composite
- 40.88/100
- National rank
- #3621
- State rank
- #46 of 73 in FL
Livability — Coral Springs
- Score
- 79/100
- State rank
- #145
- US rank
- #2163
Category grades
Schools grade is shown separately in the Schools card above.
Census & demographics
- Census place
- Coral Springs, FL
- County
- Broward County · 1,963,430 people
- City population
- 101,171
- Metro
- Miami-Fort Lauderdale-Pompano Beach, FL
- Population (ZIP)
- 42,255
- Household income
- $106,149
- Rent vs Own
- Severe rent burden
- 1123.0
Population outlook (Broward County) Hauer SSP2
- Today (2025)
- 2,207,033 people
- By 2030
- 2,360,704 · +7.0%
- By 2040
- 2,661,208 · +20.6%
- By 2050
- 2,946,698 · +33.5%
- By 2075
- 3,602,273 · +63.2%
- By 2100
- 3,970,984 · +79.9%
Race, ethnicity, and origin ACS 2023
- Neighborhood character
- Highly diverse neighborhood (Simpson 0.71)
- Race & ethnicity
- White 35% Hispanic / Latino 34% Black 22% Two or more races 20% Asian 5%
- Hispanic origin (detail)
- Mexican 2% Puerto Rican 7% Cuban 3% Dominican 3%
- Common ancestry
- Hispanic 4% Romanian 3% Scotch-Irish 2%
- Foreign-born
- 32% · Canada, Jamaica, China
- Languages at home
- 60% English-only · Spanish 28% French/Haitian/Cajun 5% Other Indo-European 2%
Political lean MEDSL · Broward
- 2024 margin
- D (+17.0) · D 58.0% · R 41.0%
- 2008→2024 swing
- -17.8pp toward R · 2008: 34.7pp · 2024: 17.0pp
- All cycles
- 2024: D+17.0 2020: D+29.8 2016: D+35.0 2012: D+34.9 2008: D+34.7
Not yet ingested
- Civics
- —
Market trends
- HPI YoY
- ▼ -203.71%
- Current HPI
- 378.3293
- Rent YoY
- ▼ -0.56%
- Metro
- Miami-Fort Lauderdale-Pompano Beach, FL
- State GDP YoY
- ▲ 3.28%
- F500 in state
- 36
Industry mix (Fortune 500 HQ in FL)
| Industry | F500 HQs | Revenue |
|---|---|---|
| Industrial Technology | 2 | $29B |
|
||
| Insurance | 2 | $17B |
|
||
| Retail | 1 | $60B |
|
||
| Technology Distribution | 1 | $58B |
|
||
| Homebuilding | 1 | $35B |
|
||
| Technology Manufacturing | 1 | $35B |
|
||
Price history
+304.5% since first listed20 events — show timeline
- 2026-04-30 Listed $169,900 Beaches MLS
- 2026-04-23 Listed for Rent $1,700 RMLSFL
- 2026-04-16 Rental Removed $1,700 RMLSFL
- 2026-04-01 Listed for Rent $1,700 RMLSFL
- 2026-04-01 Rental Removed $1,750 GFLMLS
- 2026-01-09 Listed for Rent $1,750 GFLMLS
- 2025-12-13 Rental Removed $1,750 GFLMLS
- 2025-10-17 Listed for Rent $1,750 GFLMLS
- 2025-09-06 Rental Removed $1,800 GFLMLS
- 2025-08-30 Listed for Rent $1,800 GFLMLS
- 2025-08-01 Rental Removed $1,800 GFLMLS
- 2025-07-01 Listed for Rent $1,800 GFLMLS
- 2025-07-01 Rental Removed $1,850 GFLMLS
- 2025-03-30 Price Changed $1,850 GFLMLS
- 2025-03-13 Listed for Rent $1,950 GFLMLS
- 2025-02-19 Rental Removed $1,950 GFLMLS
- 2025-02-03 Listed for Rent $1,950 GFLMLS
- 2000-08-21 Sold (Public Records) $59,000 Public Records
- 1999-02-23 Sold (Public Records) $55,000 Public Records
- 1985-04-01 Sold (Public Records) $42,000 Public Records
Property tax history
+17.0%/yrLatest (2025): $3,881 · +7.8% YoY. Source: county tax records.
Cash-flow waterfall
monthlySold comps — $/sqft
last 12 mo · ≤1 miLoading sold comps…