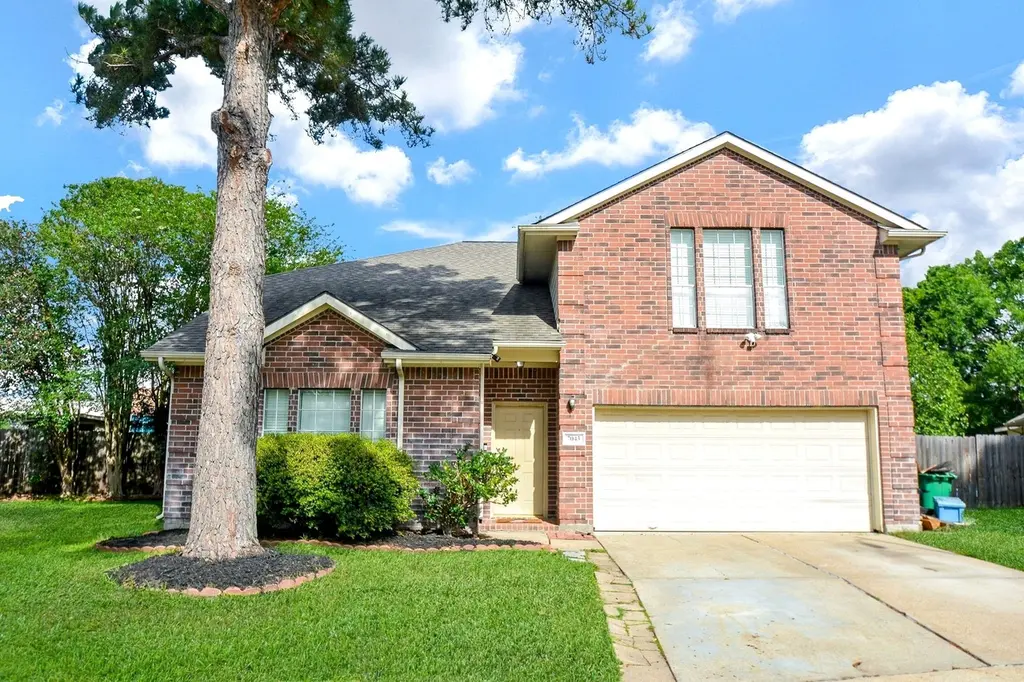
7043 Madison Trl · Houston, TX
Flood risk 1/10 · Minimal
- FEMA flood zone
- X (unshaded)
- Chance of flooding over 30 yrs
- 0.0%
- Est. flood insurance / yr
- $507 – $1,088
Fire risk 1/10 · Minimal
- Est. fire insurance / yr
- $1,222 – $2,270
Heat risk 9/10 · Severe
- Hot days now (above 110°F)
- 7 days/yr
- Hot days in 30 yrs
- 23 days/yr
Wind risk 8/10 · Major
- Chance of severe wind over 30 yrs
- 99.0%
Air-quality risk 3/10 · Minor
- Unhealthy air days now
- 2 days/yr
- Unhealthy air days in 30 yrs
- 3 days/yr
Risk factors via First Street. Map © Google.
Why this score? — see what drove the D grade
The composite is a weighted blend of 9 inputs, each scored 0–100. Each bar is that input's sub-score; the figure is the points it added to the 100-point composite (weight × sub-score).
- ARV discount +13.9/15.0
- Cash flow +6.4/30.0
- Schools +4.4/10.0
- Appreciation +4.3/10.0
- Livability +3.7/5.0
- 1% rule +3.4/10.0
- Condition / age +2.5/5.0
- Rent growth +1.8/5.0
- DSCR +0.7/10.0
$259,950
🖨 Deal sheet (PDF) 📄 Offer letter ✓ Due diligence
Listing remarks
ASK AGENT ABOUT CREDITS FOR CARPET AND PAINT! Tucked into the established Hearthstone community, this home offers a functional layout with comfortable living spaces and a standout backyard. The main living area features vaulted ceilings and flows into the kitchen and breakfast space, creating an open feel while maintaining definition. The kitchen includes an island, pantry, and direct sightlines into the family room. A front living/dining area adds flexibility. All bedrooms are upstairs, including a spacious primary suite with double sinks, soaking tub, separate shower, and walk-in closet. The backyard is a highlight—generous in size with mature trees for shade and usability. A co
Key facts
- Covered patio
- Kitchen island
- Vaulted ceilings
Tags
Property features AI
Finance
- HOA & community: Hearthstone / ACMP association; Association amenities include playground and park; Annual association fee (covers common areas)
Exterior
- Parking: Attached 2-car garage; Attached garage
- Security: Smoke detector(s)
- Utilities: Public water; Public sewer
- Home design: Residential property; Faces southeast
- Construction: Built in 1997; Brick and wood siding exterior; Composition roof; Slab foundation
- Exterior features: Covered patio; Deck; Fully fenced yard (partial fence in backyard); Porch; Patio; Private yard; Subdivision lot; Asphalt road frontage
Interior
- Kitchen: Dishwasher; Electric oven; Gas cooktop; Disposal; Microwave
- Bedrooms: Primary bedroom on second level (16 x 12); Bedroom on second level (12 x 10); Bedroom on second level (12 x 10); Bedroom on second level (11 x 10)
- Flooring: Carpet; Tile
- Bathrooms: 2 full bathrooms; 1 half bathroom
- Heating & cooling: Central heating (electric); Central air conditioning (electric)
- Interior features: Double vanity; Kitchen island; Kitchen/family room combo; Laminate counters; Primary bedroom with bath; Pantry; Soaking tub; Separate shower; Tub/shower; Vaulted ceilings; Living/dining room; Gas fireplace with gas log
- Laundry & utility: Washer hookup; Electric dryer hookup
Neighborhood map
What this means for you Summary
Snapshot
- This is a 4-bed/2.5-bath single-family listed at $260k.
Deal economics
- At list price, monthly cash flow is $-445 ($-5k/yr) — negative.
- To cash-flow at today's rent, offer at most $181k (30.3% below list).
- To meet the 1% rule (rent ≥ 1% of price), the offer needs to be $218k (16.2% below list).
- Recommended offer: $181k (30.3% below list) — sets the bar for cash-flow.
- Cap rate 4.2% vs local median 3.1% in Houston — top-decile yield for the area; either an underpriced asset or a hidden risk that comps aren't pricing in. Stress-test before assuming the spread holds.
Location & tenants
- Location reads 74/100 on livability (#184 in TX, #4,771 nationally) — a middle-class / working-renter tenant base. Strengths: amenities A+, cost of living A+, housing A+; Watch: crime F.
- Cypress-Fairbanks ISD (suburban): math 45% / reading 52% proficiency, ranked #161 of 826 in TX (top 20%) — families likely to look elsewhere, expect single-tenant / working-renter base with shorter leases.
- Zoned schools: Horne El (math 24% / reading 36%, grade F, #2,500 of 4,322 statewide, top 58%, 891 students, 78% FRL); Truitt Middle (math 34% / reading 41%, grade F, #736 of 1,662 statewide, top 45%, 1,419 students, 76% FRL); Cypress-Fairbanks J J A E P (12 students, 0% FRL).
- Zoned-school proficiency averages 34% at this address vs 48% district-wide (-15 pts) — the specific schools serving this property underperform the Cypress-Fairbanks ISD average; the district grade overstates school quality for this exact location.
- Market conditions: Rents soft (-2.9%/yr); 505 active listings in the ZIP; 20 comparable units currently listed for rent nearby; rentals lingering (median 46d on market — plan ~5-8 weeks vacancy on turnover, expect pricing pressure); 55% of comp listings sitting > 30 days — soft ceiling on asking rent; solid renter incomes; 29,883 units permitted in Harris County in 2024 (8,621 in 5+ unit buildings).
- This rent runs 32% of the median local income ($81k/yr) — at the standard rent-burdened threshold; future hikes will face affordability resistance.
Forward outlook
- Local home prices are declining (-1.4%/yr); year-one equity from $2k of loan paydown is wiped out by about $4k of value loss. Plan a longer hold.
- Harris County population projected at +47% by 2050 — long-run rental-demand tailwind backs the buy-and-hold thesis.
Negotiation context
- It's been on market 54 days — a 3% lower offer ($252k) is reasonable based on typical stale-listing flexibility.
- 2 sale attempts with the ask held roughly flat each time — persistent listings suggest the price (not the market) is what's stuck; bring a comps-based counter.
Risks & watch-outs
- Watch-outs: property tax is 3.1% of price.
- Climate carrying-cost: severe wind risk, 99% chance of damaging wind over 30y; extreme-heat days projected 7→23/yr by 2055 (HVAC capex compounding) — expect insurance premiums to compound above CPI over the hold.
Questions for the listing agent
- What do current leases actually rent for vs. the listed asking? Can we see a recent rent roll and the last 12 months of T-12 income?
- It's been on market 54 days. Have you received any prior offers? Is the seller open to a 30% concession, seller financing, or rate buy-down credit?
- Property tax is high relative to price — has the assessment been appealed recently, and will the sale trigger a re-assessment?
- What does the HOA fee cover, when was the last increase, and are there any pending special assessments or reserve-fund shortfalls?
- Is there a deadline driving the sale (1031 exchange, divorce, estate, relocation)? That informs how much negotiation room exists.
- Schools are D-rated, which usually means shorter tenancies and higher turnover. Who's the typical renter profile here, and what's been the actual vacancy rate?
- Crime grade is F in this area — have there been break-ins, vandalism, or insurance claims at this property in the last 3 years? What carrier currently insures it and at what premium?
- The area grade is low — what's the realistic commute time and amenity access for the typical tenant pool here? Any planned neighborhood developments (good or bad) we should know about?
- What's the average days-on-market for RENTAL listings here right now (not sales)? A rising rental-DOM trend means longer vacancies and softer asking-rent achievability than the comps imply.
- What's the recent tenant-quality profile in this submarket — average credit score on applications, eviction rate, late-payment / NSF rate, and stable-employment percentage? A property-management company in the area should have these aggregated.
- How much new for-sale + rental construction is in the pipeline within 1–3 miles? Heavy new supply typically softens prices + rents 12–24 months out; constrained supply supports both.
Investment metrics
- 1% rule
- 0.84% ✗
- Cap rate
- 4.24%
- Cash-on-cash
- -7.34%
- DSCR
- 0.67
- GRM
- 9.9
CMA / ARV
- ARV (median comp)
- $303,166
- List price
- $259,950
- Delta
- -14.25%
- Verdict
- UNDERPRICED
- Comps
- 20 within 1.0 mi
Show comp detail 12 sales within ~0.75 mi
| Address | Dist | Beds/Ba | Sqft | Sold | Price | $/sf | Match |
|---|---|---|---|---|---|---|---|
| 7210 Winding Walk Dr | 0.27mi | 4/2.5 | 2,470 (+2%) | 0mo | $383,900 | $155 | 83 |
| 15011 Moss Boulder Ct | 0.08mi | 4/2.5 | 2,605 (+8%) | 1mo | $315,000 | $121 | 82 |
| 15018 Moss Boulder Ct | 0.08mi | 4/2.5 | 2,692 (+12%) | 1mo | $310,000 | $115 | 76 |
| 7202 Benwich Cir | 0.29mi | 3/2.0 (-1) | 2,274 (-6%) | 3mo | $287,000 | $126 | 68 |
| 7111 Winding Walk Dr | 0.19mi | 3/2.0 (-1) | 2,174 (-10%) | 3mo | $342,500 | $158 | 65 |
| 15111 Possumwood Dr | 0.34mi | 3/2.5 (-1) | 2,228 (-8%) | 3mo | $249,999 | $112 | 64 |
| 15251 Weeping Cedar Ln | 0.51mi | 4/2.5 | 2,228 (-8%) | 0mo | $310,000 | $139 | 64 |
| 7203 W Hearthstone Green Dr | 0.39mi | 3/2.0 (-1) | 2,270 (-6%) | 4mo | $300,000 | $132 | 62 |
| 6714 Cleft Stone Dr | 0.34mi | 4/2.5 | 2,741 (+14%) | 1mo | $359,900 | $131 | 60 |
| 6822 Hertford Park Dr | 0.33mi | 3/2.5 (-1) | 2,100 (-13%) | 0mo | $314,000 | $150 | 58 |
| 6543 Horsepen Bayou Dr | 0.59mi | 3/2.0 (-1) | 2,330 (-3%) | 4mo | $334,900 | $144 | 56 |
| 6511 Harcourt Bridge Dr | 0.63mi | 4/2.5 | 2,756 (+14%) | 1mo | $324,900 | $118 | 46 |
Match score weights: distance 35% · size 25% · config 20% · recency 20%. Top-matched comps best support the ARV.
Projected returns pro-forma
-1.4% appreciation · 0.0% rent growth · sell at horizon
- IRR
- -20.3%
- Equity multiple
- 0.19×
- Total profit
- $-58,688
- Equity at exit
- $57,839
- IRR
- -18.0%
- Equity multiple
- -0.30×
- Total profit
- $-94,764
- Equity at exit
- $56,645
Cash invested: $72,786 (down + closing). Projections, not guarantees.
Landlord ↔ Tenant lean methodology
- Overall (STATE)
- 87 Strongly Landlord-Friendly
- State Texas
- 87 Strongly Landlord-Friendly · R+5
- County
- — inherits STATE
- City
- — inherits STATE
ZIP-level market 77084
- Home prices YoY
- -0.6%
- Rents YoY
- -2.9%
- Active inventory
- 505
- Price-to-rent
- 9.9×
Monthly cashflow live
- Estimated rent
- $2,180 high interval (Pro) →
- Mortgage (P&I)
- −$1,363
- Tax from tax record
- −$661 /mo · $7,931/yr
- Insurance
- −$108
- HOA
- −$35
- Vacancy / Maint / Mgmt
- −$458
- Net cashflow
- $-445
Break-even live
Sensitivity live
| Price | -10% $-298 | -5% $-372 | +0% $-445 | +5% $-519 | +10% $-593 |
|---|---|---|---|---|---|
| Rent | -10% $-618 | -5% $-532 | +0% $-445 | +5% $-359 | +10% $-273 |
| Rate | -1.0pp $-315 | -0.5pp $-379 | base $-445 | +0.5pp $-513 | +1.0pp $-581 |
UW: 25.0% down · 7.5% · 30yr · 1.5% tax · 5.0% vac · 8.0% maint · 8.0% mgmt
Financing live
Cash to close
- Down payment
- $64,988
- Closing costs
- $7,798
- Reserves months
- —
- Total cash needed
- —
Loan-product check · same deal, 3 products live
Conventional
25% down · 7.5% · 30yr
- Down + closing
- —
- Monthly P&I
- —
- Monthly cashflow
- —
- DSCR
- —
- Eligible?
- —
Personal DTI + credit; lowest rate.
DSCR
20% down · 8.5% · 30yr
- Down + closing
- —
- Monthly P&I
- —
- Monthly cashflow
- —
- DSCR
- —
- Eligible?
- —
No personal income docs; deal must DSCR.
Hard money
10% down · 12.0% · 12mo
- Down + closing
- —
- Monthly P&I
- —
- Monthly cashflow
- —
- DSCR
- —
- Eligible?
- —
Short-term bridge; refi at stabilization.
Rent comps 20 comps
| Address | Beds | Baths | Sqft | Rent | $/sqft | DOM | Units | Dist |
|---|---|---|---|---|---|---|---|---|
| 15255 Farm to Market Road 529 #15288 Houston, TX | 3.0 | 2.0 | 1652 | $2,170 | $1.31 | 45d | 1 | 0.29mi |
| 15255 Farm to Market Road 529 #3174 Houston, TX | 3.0 | 2.0 | 1652 | $2,170 | $1.31 | 13d | 1 | 0.29mi |
| 15255 Farm to Market Road 529 #525 Houston, TX | 3.0 | 2.0 | 1652 | $2,119 | $1.28 | 1d | 1 | 0.29mi |
| 14623 Sanour Dr Houston, TX | 3.0 | 2.5 | 2032 | $2,170 | $1.07 | 7d | 1 | 0.33mi |
| 6803 Hedgewick Dr Houston, TX | 4.0 | 2.5 | 2336 | $2,550 | $1.09 | 24d | 1 | 0.35mi |
| 15111 Falmouth Ave Houston, TX | 3.0 | 2.0 | 1674 | $1,850 | $1.11 | 45d | 1 | 0.39mi |
| 15022 Mulberry Meadows Dr Houston, TX | 3.0 | 2.0 | 1832 | $1,905 | $1.04 | 1d | 1 | 0.44mi |
| 6607 Readsland Ln Houston, TX | 4.0 | 2.0 | 1832 | $2,500 | $1.36 | 45d | 1 | 0.50mi |
| 15022 Ringfield Dr Houston, TX | 3.0 | 2.0 | 2064 | $1,975 | $0.96 | 45d | 1 | 0.63mi |
| 6685 Kentwick Dr #210 Houston, TX | 3.0 | 2.5 | 1800 | $1,870 | $1.04 | 9d | 1 | 0.64mi |
| 7451 Tunbury Ln Houston, TX | 4.0 | 2.5 | 2630 | $2,171 | $0.83 | 9d | 1 | 0.66mi |
| 7415 Broken Ridge Dr Houston, TX | 3.0 | 2.5 | 2416 | $2,245 | $0.93 | 45d | 1 | 0.71mi |
| 6427 Waldron Dr Unit A Houston, TX | 3.0 | 2.5 | 1593 | $1,900 | $1.19 | 45d | 1 | 0.87mi |
| 7331 Millbrae Ln Houston, TX | 4.0 | 2.0 | 2481 | $1,779 | $0.72 | 4d | 1 | 0.91mi |
| 6706 Honey Harvest Ln Houston, TX | 3.0 | 3.0 | 1873 | $2,049 | $1.09 | 45d | 1 | 1.13mi |
| 6102 Crakston St Houston, TX | 3.0 | 2.0 | 1862 | $1,850 | $0.99 | 45d | 1 | 1.17mi |
| 14818 Chetland Place Dr Unit CHEP18-1 Houston, TX | 3.0 | 2.5 | 2490 | $2,100 | $0.84 | 45d | 1 | 1.25mi |
| 7511 Stamen Dr Houston, TX | 3.0 | 2.5 | 1575 | $2,350 | $1.49 | 45d | 1 | 1.28mi |
| 16303 Hickory Point Rd Houston, TX | 4.0 | 2.5 | 2556 | $2,400 | $0.94 | 5d | 1 | 1.40mi |
| 8335 Columbia Forest Dr Houston, TX | 3.0 | 3.0 | 1767 | $2,000 | $1.13 | 45d | 1 | 1.45mi |
HOA detail
- Monthly dues
- $35 · $420/yr
Listing history 16 events
-
2026-06-15days on market $259,950 Pending 54 DOM
-
2026-06-13days on market $259,950 Pending 52 DOM
-
2026-06-13statusdays on market $259,950 Pending 51 DOM
-
2026-06-09days on market $259,950 Active 48 DOM
-
2026-06-08days on market $259,950 Active 47 DOM
-
2026-06-07days on market $259,950 Active 46 DOM
-
2026-06-04days on market $259,950 Active 43 DOM
-
2026-06-03days on market $259,950 Active 42 DOM
-
2026-06-02pricedays on market $259,950 Active 41 DOM
-
2026-06-02days on market $269,950 Active 40 DOM
-
2026-05-31days on market $269,950 Active 39 DOM
-
2026-05-11status Active 785-char remark
-
2026-05-05status Pending 785-char remark
-
2026-04-22$269,950 Active 785-char remark
-
2003-12-12soldstatus
-
2001-06-04soldstatus
ⓘ Source: listings_history table (triggers on properties + properties_extension) + one-shot
backfill from property_details.listing_events for pre-trigger history.
Tax reassessment forecast TX · Resets to sale price
- Current annual tax
- $7,931 · $661/mo
- Projected year-2 tax
- $7,931 · $661/mo
- Expected delta
- $0/yr ($0/mo · 0.0%)
ⓘ Screening estimate from a state-policy table — verify with the county assessor before closing.
Climate risk First Street
- Flood 1/10 Low FEMA zone X (unshaded) · 0% chance over 30 yrs
- Wildfire 1/10 Low
- Heat 9/10 Extreme 7 d/yr ≥110°F today · 23 d/yr by 30 yrs out
- Wind 8/10 Severe 99% chance of damaging wind over 30 yrs
- Air quality 3/10 Moderate 2 unhealthy d/yr today · 3 by 30 yrs out
Nearby sold comps map
Loading sold comps map…
Walkable amenities ~0.75 mi
Loading nearby amenities…
Taxation est. · year 1
- Rental income
- $26,156
- − Mortgage interest
- −$14,561
- − Property taxes
- −$7,931
- − Insurance
- −$1,300
- − Repairs & maintenance
- −$2,092
- − Management
- −$2,092
- − HOA
- −$420
- − Depreciation
- −$7,562
- Taxable loss
- −$9,803
- Est. tax savings @ 24.0%
- +$2,353
- After-tax cash flow
- $-2,993/yr
For passive investors: Depreciation is non-cash, so a rental often shows a tax loss while cash-flowing — sheltering income. Rental losses are passive: they offset passive income freely, and up to $25,000/yr can offset ordinary (W-2) income if you actively participate and your MAGI is under $100k (phasing out to $0 by $150k); unused losses carry forward. On sale, claimed depreciation is recaptured at up to 25%, and gains may owe capital-gains tax (a 1031 exchange can defer both). Figures are a year-1 estimate at your 24.0% rate — not tax advice; consult a CPA.
Schools (NCES district)
- District
- Cypress-Fairbanks ISD
- NCES district ID
- 4816110
- Math proficiency
- 45% ▼ -12.00%
- Reading proficiency
- 52% ▼ -2.00%
- Median HH income
- $72,025
- Composite
- 43.63/100
- National rank
- #2968
- State rank
- #161 of 826 in TX
Livability — Houston
- Score
- 74/100
- State rank
- #184
- US rank
- #4771
Category grades
Schools grade is shown separately in the Schools card above.
Census & demographics
- County
- Harris County · 4,702,590 people
- City population
- 3,226,434
- Metro
- Houston-The Woodlands-Sugar Land, TX
- Population (ZIP)
- 110,217
- Household income
- $80,575
- Rent vs Own
- Severe rent burden
- 3257.0
Population outlook (Harris County) Hauer SSP2
- Today (2025)
- 5,571,493 people
- By 2030
- 6,089,821 · +9.3%
- By 2040
- 7,142,806 · +28.2%
- By 2050
- 8,185,864 · +46.9%
- By 2075
- 10,574,329 · +89.8%
- By 2100
- 12,109,958 · +117.4%
Race, ethnicity, and origin ACS 2023
- Neighborhood character
- Diverse neighborhood (Simpson 0.69)
- Race & ethnicity
- Hispanic / Latino 48% Two or more races 22% White 22% Black 16% Asian 11% Native American 2%
- Hispanic origin (detail)
- Mexican 27% Cuban 2%
- Common ancestry
- Lithuanian 1% Romanian 1% Slovak 1%
- Foreign-born
- 32% · Canada, Vietnam, Jamaica
- Languages at home
- 48% English-only · Spanish 38% Other Indo-European 5% Vietnamese 3%
Political lean MEDSL · Harris
- 2024 margin
- Lean D (+5.5) · D 52.0% · R 46.4% · Other 1.6%
- 2008→2024 swing
- +3.9pp toward D · 2008: 1.6pp · 2024: 5.5pp
- All cycles
- 2024: D+5.5 2020: D+13.3 2016: D+12.4 2012: D+0.1 2008: D+1.6
Not yet ingested
- Civics
- —
Market trends
- HPI YoY
- ▼ -1.40%
- Current HPI
- 251.8474
- Rent YoY
- ▼ -2.89%
- Metro
- Houston-The Woodlands-Sugar Land, TX
- State GDP YoY
- ▲ 3.95%
- F500 in state
- 110
Industry mix (Fortune 500 HQ in TX)
| Industry | F500 HQs | Revenue |
|---|---|---|
| Energy | 16 | $1,198B |
|
||
| Technology | 5 | $198B |
|
||
| Engineering / Construction | 4 | $72B |
|
||
| Energy Services | 3 | $60B |
|
||
| Utilities | 3 | $41B |
|
||
| Healthcare | 2 | $330B |
|
||
Price history
-3.7% since first listed8 events — show timeline
- 2026-06-15 Pending — HARMLS
- 2026-06-10 Pending — HARMLS
- 2026-06-02 Price Changed $259,950 HARMLS
- 2026-05-11 Relisted — HARMLS
- 2026-05-05 Pending — HARMLS
- 2026-04-22 Listed $269,950 HARMLS
- 2003-12-12 Sold (Public Records) — Public Records
- 2001-06-04 Sold (Public Records) — Public Records
Property tax history
+5.7%/yrLatest (2025): $7,931 · -7.5% YoY. Source: county tax records.
Cash-flow waterfall
monthlySold comps — $/sqft
last 12 mo · ≤1 miLoading sold comps…