 Duplex
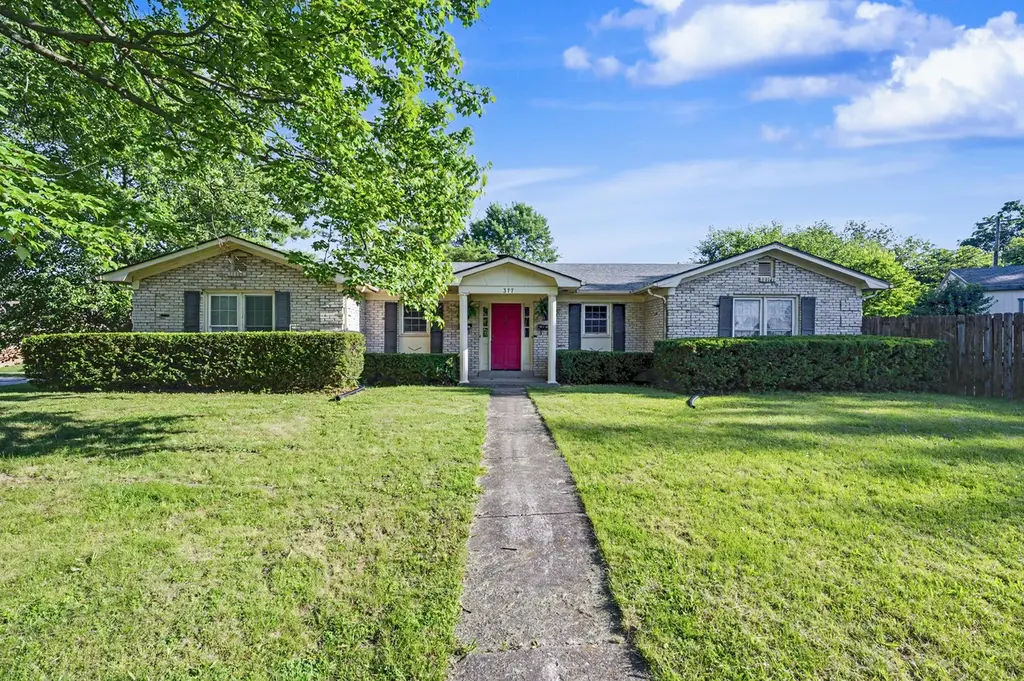
377 Redding Rd · Lexington-Fayette, KY
Flood risk 1/10 · Minimal
- FEMA flood zone
- X (unshaded)
- Chance of flooding over 30 yrs
- 0.0%
- Est. flood insurance / yr
- $507 – $1,088
Fire risk 1/10 · Minimal
- Est. fire insurance / yr
- $839 – $1,559
Heat risk 4/10 · Minor
- Hot days now (above 101°F)
- 7 days/yr
- Hot days in 30 yrs
- 19 days/yr
Wind risk 2/10 · Minimal
- Chance of severe wind over 30 yrs
- 2.0%
Air-quality risk 1/10 · Minimal
- Unhealthy air days now
- 0 days/yr
- Unhealthy air days in 30 yrs
- 0 days/yr
Risk factors via First Street. Map © Google.
Why this score? — see what drove the D grade
The composite is a weighted blend of 9 inputs, each scored 0–100. Each bar is that input's sub-score; the figure is the points it added to the 100-point composite (weight × sub-score).
- Cash flow +14.1/30.0
- ARV discount +7.5/15.0
- DSCR +4.3/10.0
- Rent growth +3.6/5.0
- Schools +3.4/10.0
- 1% rule +2.9/10.0
- Livability +2.5/5.0
- Condition / age +2.5/5.0
- Appreciation +0.0/10.0
$325,000
🖨 Deal sheet (PDF) 📄 Offer letter ✓ Due diligence
Multi-family units
County records classify this as Multi-Family (2-4 Unit). Listing-text estimate: 2 units. confirmed
Listing remarks MLS
Great duplex in south Lexington! Live in one side and rent the other side or rent both sides! Each unit has 2 spacious bedrooms, primary bedroom has a private half bath, full bath in hall way, laundry hookups, nice size family room with fireplace and open to the kitchen. Vinyl replacement windows! Large storage building for owner use or extra storage for tenants. There is some damage to the subfloor in kitchen and full bath of unit A that needs to be repaired. Selling As-Is. Call today to schedule a private showing.
Key facts
- New flooring
- New appliances
- Updated kitchen
Tags
Property features AI
Finance
- Other: Zoning: R-2 (ND-1)
- Financial info: Vacancy allowance rate listed at 50%
Exterior
- Parking: Paved parking
- Utilities: Electricity available; Water available; Sewer connected
- Home design: Single-story duplex
- Exterior features: Shingle roof
Interior
- Bathrooms: Two full bathrooms; Two half bathrooms
- Heating & cooling: Electric heating available; Forced air heating; Heat pump; Natural gas heating; Heat pump cooling; Electric cooling
- Interior features: Duplex with two total units
Neighborhood map
What this means for you Summary
Snapshot
- This is a 2 × 2-bed/2.5-bath units multifamily listed at $325k.
Deal economics
- At list price, monthly cash flow is $46 ($550/yr) — positive. Per door: $23/mo.
- The deal already cash-flows at list — no discount required.
- To meet the 1% rule (rent ≥ 1% of price), the offer needs to be $257k (21.0% below list).
- Recommended offer: $257k (21.0% below list) — sets the bar for 1% rule.
- Cap rate 6.5% vs local median 3.8% in Lexington-Fayette — top-decile yield for the area; either an underpriced asset or a hidden risk that comps aren't pricing in. Stress-test before assuming the spread holds.
Location & tenants
- Location reads: area grade D — affects rentability + tenant quality, not the cash-flow math above.
- Fayette County (urban): math 35% / reading 45% proficiency, ranked #27 of 165 in KY (top 16%) — families likely to look elsewhere, expect single-tenant / working-renter base with shorter leases.
- Zoned schools: Lansdowne Elementary School (math 26% / reading 28%, grade F, #434 of 676 statewide, top 69%, 558 students, 76% FRL); Southern Middle School (math 26% / reading 41%, grade F, #105 of 217 statewide, top 51%, 772 students, 54% FRL); Tates Creek High School (math 29% / reading 32%, grade F, #121 of 254 statewide, top 47%, 1,734 students, 52% FRL) — zoned schools average 60% FRL vs 44% district-wide (16 pts higher); higher-poverty schools than district average — tighter screening recommended.
- Market conditions: Rents rising fast (+4.5%/yr); 104 active listings in the ZIP; 12 comparable units currently listed for rent nearby; rentals at typical pace (median 26d on market — plan ~3-4 weeks tenant-placement turnaround); 1,036 units permitted in Fayette County in 2024 (542 in 5+ unit buildings).
- At $2,569/mo this rent would consume 57% of the median local household income ($54k/yr) (locally 2743% of renters already pay >50% of income on rent) — very limited rent-growth headroom before tenants either downsize or default.
Forward outlook
- Local home prices are declining (-3.0%/yr); year-one equity from $2k of loan paydown is wiped out by about $10k of value loss. Plan a longer hold.
- Fayette County population projected at +35% by 2050 — long-run rental-demand tailwind backs the buy-and-hold thesis.
Negotiation context
- Only 3 days on market — expect competitive offers; lowballing is unlikely to land.
- 6 sale attempts since 27y ago with the ask held roughly flat each time — persistent listings suggest the price (not the market) is what's stuck; bring a comps-based counter.
- Current owner paid $241k; 35% above their basis — modest negotiation headroom, anchor on the comps not their cost.
Questions for the listing agent
- Can we see the unit-by-unit rent roll, current vacancy, and any below-market leases? What's the average tenancy length?
- What capital expenditures (roof, boiler, parking lot, exteriors) have been made in the last 5 years, and what's planned in the next 2?
- Built in 1976 — when were the roof, HVAC, electrical panel, plumbing, and water heater last replaced?
- Is there a deadline driving the sale (1031 exchange, divorce, estate, relocation)? That informs how much negotiation room exists.
- The area grade is low — what's the realistic commute time and amenity access for the typical tenant pool here? Any planned neighborhood developments (good or bad) we should know about?
- What's the average days-on-market for RENTAL listings here right now (not sales)? A rising rental-DOM trend means longer vacancies and softer asking-rent achievability than the comps imply.
- What's the recent tenant-quality profile in this submarket — average credit score on applications, eviction rate, late-payment / NSF rate, and stable-employment percentage? A property-management company in the area should have these aggregated.
- How much new apartment / multifamily construction is in the pipeline within 1–3 miles? Heavy new supply (>2% of stock underway) typically softens rents 12–24 months out; light construction supports rent growth.
Investment metrics
- 1% rule
- 0.79% ✗
- Cap rate
- 6.46%
- Cash-on-cash
- 0.60%
- DSCR
- 1.03
- GRM
- 10.5
CMA / ARV
No comps found within radius.
Projected returns pro-forma
-3.0% appreciation · 4.52% rent growth · sell at horizon
- IRR
- -13.9%
- Equity multiple
- 0.50×
- Total profit
- $-45,877
- Equity at exit
- $48,459
- IRR
- -3.1%
- Equity multiple
- 0.78×
- Total profit
- $-19,804
- Equity at exit
- $28,100
Cash invested: $91,000 (down + closing). Projections, not guarantees.
Landlord ↔ Tenant lean methodology
- Overall (STATE)
- 83 Strongly Landlord-Friendly
- State Kentucky
- 83 Strongly Landlord-Friendly · R+16
- County
- — inherits STATE
- City
- — inherits STATE
ZIP-level market 40517
- Rents YoY
- 4.5%
- Active inventory
- 104
- Price-to-rent
- 21.1×
Monthly cashflow live
- Estimated rent
- $2,569 high interval (Pro) →
- Mortgage (P&I)
- −$1,704
- Tax from tax record
- −$144 /mo · $1,727/yr
- Insurance
- −$135
- HOA
- −$0
- Vacancy / Maint / Mgmt
- −$539
- Net cashflow
- $46
Break-even live
Sensitivity live
| Price | -10% $230 | -5% $138 | +0% $46 | +5% $-46 | +10% $-138 |
|---|---|---|---|---|---|
| Rent | -10% $-157 | -5% $-56 | +0% $46 | +5% $147 | +10% $249 |
| Rate | -1.0pp $210 | -0.5pp $129 | base $46 | +0.5pp $-38 | +1.0pp $-124 |
2-unit breakdown (identical units grouped — click to expand)
| Units | Beds | Baths | Est. rent |
|---|---|---|---|
| 2× units | 2 | 2.5 | $2,570 |
| #1 | 2 | 2.5 | $1,285 |
| #2 | 2 | 2.5 | $1,285 |
| Total (2 units) | $2,569 | ||
UW: 25.0% down · 7.5% · 30yr · 1.5% tax · 5.0% vac · 8.0% maint · 8.0% mgmt
Financing live
Cash to close
- Down payment
- $81,250
- Closing costs
- $9,750
- Reserves months
- —
- Total cash needed
- —
Loan-product check · same deal, 3 products live
Conventional
25% down · 7.5% · 30yr
- Down + closing
- —
- Monthly P&I
- —
- Monthly cashflow
- —
- DSCR
- —
- Eligible?
- —
Personal DTI + credit; lowest rate.
DSCR
20% down · 8.5% · 30yr
- Down + closing
- —
- Monthly P&I
- —
- Monthly cashflow
- —
- DSCR
- —
- Eligible?
- —
No personal income docs; deal must DSCR.
Hard money
10% down · 12.0% · 12mo
- Down + closing
- —
- Monthly P&I
- —
- Monthly cashflow
- —
- DSCR
- —
- Eligible?
- —
Short-term bridge; refi at stabilization.
Rent comps 12 comps
| Address | Beds | Baths | Sqft | Rent | $/sqft | DOM | Units | Dist |
|---|---|---|---|---|---|---|---|---|
| 3573 Laredo Dr Lexington, KY | 2.0–3.0 | 1.5–2.5 | 1172 | $1,399 | $1.19 | 25d | 3 | 0.37mi |
| 248 Medlock Rd Lexington, KY | 3.0 | 2.0 | 1347 | $1,795 | $1.33 | 25d | 1 | 0.61mi |
| 246 Medlock Rd Lexington, KY | 3.0 | 2.0 | 1326 | $1,795 | $1.35 | 25d | 1 | 0.61mi |
| 857 Malabu Dr #8100 Lexington, KY | 3.0 | 2.5 | 1603 | $1,799 | $1.12 | 25d | 1 | 0.64mi |
| 3501 Windgate Way Lexington, KY | 3.0 | 2.0 | 1326 | $2,350 | $1.77 | 25d | 1 | 0.67mi |
| 3732 Old Tates Creek Pike Lexington, KY | 3.0 | 2.5 | 1764 | $2,050 | $1.16 | 25d | 1 | 0.83mi |
| 3260 Commodore Dr Lexington, KY | 1.0–3.0 | 1.0–2.5 | 1229 | $2,625 | $2.14 | 16d | 11 | 0.85mi |
| 3327 Wood Valley Ct Lexington, KY | 3.0 | 1.5 | 1650 | $1,550 | $0.94 | 16d | 1 | 0.99mi |
| 1197 Appian Crossing Way Lexington, KY | 1.0–3.0 | 1.0–2.5 | 1066 | $1,559 | $1.46 | 25d | 5 | 1.29mi |
| 825 Glasford Sq Lexington, KY | 3.0 | 2.5 | 1425 | $1,844 | $1.29 | 25d | 1 | 1.35mi |
| 736 Lori Ln Lexington, KY | 3.0 | 2.5 | 2400 | $2,600 | $1.08 | 25d | 1 | 1.38mi |
| 4057 Mooncoin Way Lexington, KY | 1.0–3.0 | 1.0–2.0 | 1034 | $2,125 | $2.05 | 16d | 33 | 1.46mi |
Listing history 3 events
-
2026-06-07statusdays on market $325,000 Pending 3 DOM
-
2026-06-05remarks 699-char remark
-
2026-06-05$325,000 Active 1 DOM
ⓘ Source: listings_history table (triggers on properties + properties_extension) + one-shot
backfill from property_details.listing_events for pre-trigger history.
Tax reassessment forecast KY · Resets to sale price
- Current annual tax
- $1,727 · $144/mo
- Projected year-2 tax
- $2,795 · $233/mo
- Expected delta
- +$1,068/yr (+$89/mo · 61.9%)
ⓘ Screening estimate from a state-policy table — verify with the county assessor before closing.
Climate risk First Street
- Flood 1/10 Low FEMA zone X (unshaded) · 0% chance over 30 yrs
- Wildfire 1/10 Low
- Heat 4/10 Moderate 7 d/yr ≥101°F today · 19 d/yr by 30 yrs out
- Wind 2/10 Low 2% chance of damaging wind over 30 yrs
- Air quality 1/10 Low 0 unhealthy d/yr today · 0 by 30 yrs out
Nearby sold comps map
Loading sold comps map…
Walkable amenities ~0.75 mi
Loading nearby amenities…
Taxation est. · year 1
- Rental income
- $30,828
- − Mortgage interest
- −$18,205
- − Property taxes
- −$1,727
- − Insurance
- −$1,625
- − Repairs & maintenance
- −$2,466
- − Management
- −$2,466
- − Depreciation
- −$9,455
- Taxable loss
- −$5,116
- Est. tax savings @ 24.0%
- +$1,228
- After-tax cash flow
- $1,778/yr
For passive investors: Depreciation is non-cash, so a rental often shows a tax loss while cash-flowing — sheltering income. Rental losses are passive: they offset passive income freely, and up to $25,000/yr can offset ordinary (W-2) income if you actively participate and your MAGI is under $100k (phasing out to $0 by $150k); unused losses carry forward. On sale, claimed depreciation is recaptured at up to 25%, and gains may owe capital-gains tax (a 1031 exchange can defer both). Figures are a year-1 estimate at your 24.0% rate — not tax advice; consult a CPA.
Schools (NCES district)
- District
- Fayette County
- NCES district ID
- 2101860
- Math proficiency
- 35% ▼ -16.00%
- Reading proficiency
- 45% ▼ -13.00%
- Median HH income
- $49,245
- Composite
- 34.38/100
- National rank
- #5211
- State rank
- #27 of 165 in KY
Livability — Lexington-Fayette
No livability data for this city. (Only ~50 U.S. cities are tracked.)
Census & demographics
- Census place
- Lexington-Fayette, KY
- County
- Fayette County · 317,143 people
- City population
- 321,882
- Metro
- Lexington-Fayette, KY
- Population (ZIP)
- 35,656
- Household income
- $53,670
- Rent vs Own
- Severe rent burden
- 2743.0
Population outlook (Fayette County) Hauer SSP2
- Today (2025)
- 363,454 people
- By 2030
- 388,270 · +6.8%
- By 2040
- 438,688 · +20.7%
- By 2050
- 490,667 · +35.0%
- By 2075
- 625,394 · +72.1%
- By 2100
- 721,354 · +98.5%
Race, ethnicity, and origin ACS 2023
- Neighborhood character
- Diverse neighborhood (Simpson 0.57)
- Race & ethnicity
- White 60% Black 24% Two or more races 9% Hispanic / Latino 8% Asian 2%
- Hispanic origin (detail)
- Mexican 5%
- Common ancestry
- Italian 3% Lithuanian 2% Slovak 1%
- Foreign-born
- 9% · Canada
- Languages at home
- 87% English-only · Spanish 6% Other Indo-European 2% Arabic 1%
Political lean MEDSL · Fayette
- 2024 margin
- D (+18.1) · D 58.0% · R 39.9% · Other 2.1%
- 2008→2024 swing
- +13.3pp toward D · 2008: 4.8pp · 2024: 18.1pp
- All cycles
- 2024: D+18.1 2020: D+20.8 2016: D+9.5 2012: D+1.0 2008: D+4.8
Not yet ingested
- Civics
- —
Market trends
- HPI YoY
- ▼ -182.53%
- Current HPI
- 248.0466
- Rent YoY
- ▲ 4.52%
- Metro
- Lexington-Fayette, KY
- State GDP YoY
- ▲ 1.81%
- F500 in state
- 4
Industry mix (Fortune 500 HQ in KY)
| Industry | F500 HQs | Revenue |
|---|---|---|
| Healthcare | 1 | $118B |
|
||
| Food / Beverage | 1 | $7B |
|
||
Price history
+172.8% since first listed21 events — show timeline
- 2026-06-04 Listed $325,000 ImagineMLS
- 2022-08-15 Sold (Public Records) $241,000 Public Records
- 2022-08-12 Sold (MLS) $241,000 ImagineMLS
- 2022-07-09 Pending — ImagineMLS
- 2022-06-24 Relisted — ImagineMLS
- 2022-06-19 Pending — ImagineMLS
- 2022-06-17 Listing Removed — ImagineMLS
- 2022-06-16 Listed $250,000 ImagineMLS
- 2018-02-15 Sold (Public Records) $387,000 Public Records
- 2012-12-19 Sold (MLS) $143,000 ImagineMLS
- 2012-12-18 Sold (Public Records) $143,000 Public Records
- 2012-11-15 Listing Removed — ImagineMLS
- 2012-09-11 Listed $159,900 ImagineMLS
- 2012-07-10 Sold (Public Records) $105,331 Public Records
- 2005-10-01 Sold (MLS) $150,000 ImagineMLS
- 2005-09-29 Sold (Public Records) $150,000 Public Records
- 2005-08-22 Listed $149,000 ImagineMLS
- 2005-08-22 Listing Removed — ImagineMLS
- 1999-09-27 Sold (MLS) $119,148 ImagineMLS
- 1999-08-19 Listed $119,148 ImagineMLS
- 1999-08-19 Listing Removed — ImagineMLS
Property tax history
+1.8%/yrLatest (2015): $1,727 · +1.8% YoY. Source: county tax records.
Cash-flow waterfall
monthlySold comps — $/sqft
last 12 mo · ≤1 miLoading sold comps…