 Duplex
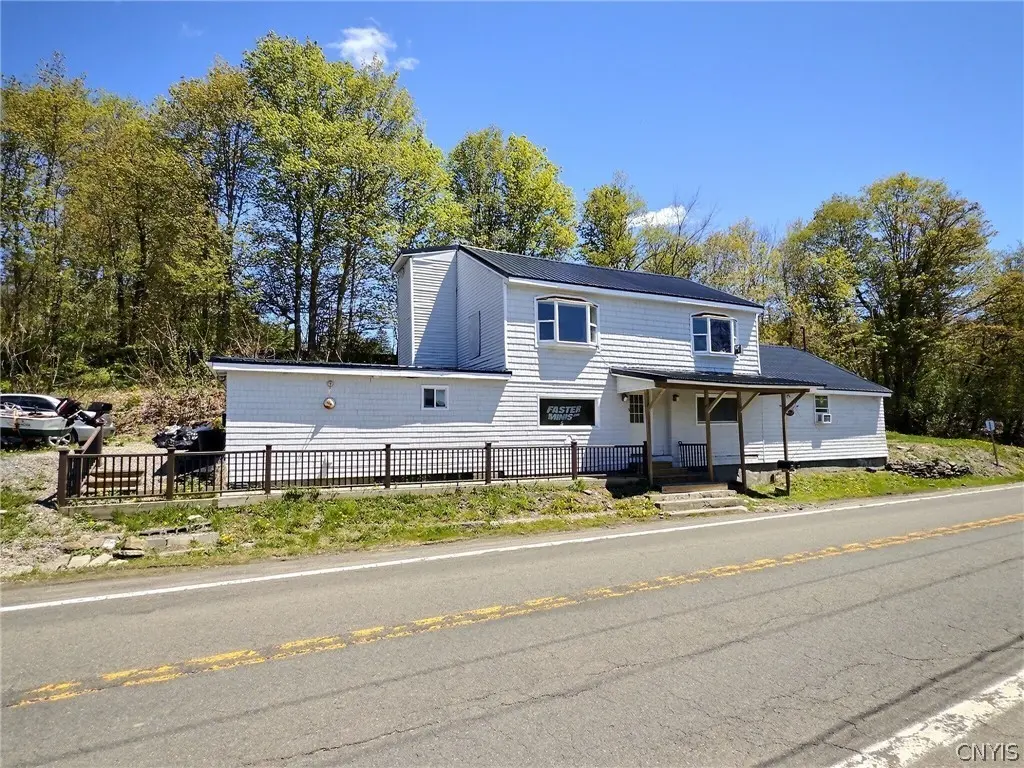
6660 State Route 41 · Homer, NY
Flood risk No data
- FEMA flood zone
- —
- Chance of flooding over 30 yrs
- —
- Est. flood insurance / yr
- —
Fire risk No data
- Est. fire insurance / yr
- —
Heat risk No data
- Hot days now (above threshold)
- —
- Hot days in 30 yrs
- —
Wind risk No data
- Chance of severe wind over 30 yrs
- —
Air-quality risk No data
- Unhealthy air days now
- —
- Unhealthy air days in 30 yrs
- —
Risk factors via First Street. Map © Google.
Why this score? — see what drove the B+ grade
The composite is a weighted blend of 9 inputs, each scored 0–100. Each bar is that input's sub-score; the figure is the points it added to the 100-point composite (weight × sub-score).
- Cash flow +30.0/30.0
- 1% rule +10.0/10.0
- DSCR +10.0/10.0
- Appreciation +8.4/10.0
- ARV discount +7.5/15.0
- Schools +4.7/10.0
- Livability +3.8/5.0
- Rent growth +2.5/5.0
- Condition / age +2.2/5.0
$139,900
🖨 Deal sheet 📄 Offer letter ✓ Due diligence
Multi-family units
County records classify this as Multi-Family (2-4 Unit). Listing-text estimate: 2 units. confirmed
Listing remarks
Opportunity meets versatility in this well-maintained two-family home set on a corner lot. Each residence offers a comfortable layout featuring 2 bedrooms and 1 full bath, making this property ideal for owner-occupants, multi-generational living, or investment potential. This property provides the perfect balance of privacy and convenience. Both apartments offer bright living areas, functional kitchens, and comfortable bedrooms designed for everyday living. Whether you are looking to expand your investment portfolio or enjoy the benefits of rental income while living on-site, this property offers flexibility, and value.
Key facts
- 9,148 sq ft lot
- 2 parking spots
- Built 1910
Property features AI
Finance
- Financial info: Owner pays for water; water is included in rent (for multi-unit); Two-unit property with separate electric meters for each unit; Operating expense details: see remarks
Exterior
- Parking: Two or more parking spaces
- Utilities: Well water; Septic tank
- Home design: 2-story property; Resale
- Construction: Vinyl siding
- Exterior features: Propane tank (owned); Corner and irregular lot
Interior
- Flooring: Ceramic tile; Laminate; Varies
- Bathrooms: 2 full bathrooms
- Heating & cooling: Electric baseboard heating
- Interior features: Ceramic tile and laminate flooring; varied flooring in areas; Electric water heater; Fireplace (1)
Neighborhood map
What this means for you Summary
Snapshot
- This is a 2 × 2-bed/1.0-bath units multifamily listed at $140k. Condition is rated fair.
Deal economics
- At list price, monthly cash flow is $1k ($12k/yr) — positive. Per door: $508/mo.
- The deal already cash-flows at list — no discount required.
- Meets the 1% rule at list price ($3k rent vs $140k).
- Recommended offer: $138k (1.5% below list) — sets the bar for market timing.
- Cap rate 15.0% vs local median 3.4% in Homer — top-decile yield for the area; either an underpriced asset or a hidden risk that comps aren't pricing in. Stress-test before assuming the spread holds.
Location & tenants
- Location reads 76/100 on livability (#229 in NY, #3,609 nationally) — a middle-class / working-renter tenant base. Strengths: housing A+, health & safety A+, cost of living A; Watch: amenities F, commute F.
- Homer Central School District (town): math 49% / reading 59% proficiency, ranked #306 of 590 in NY (top 52%) — acceptable for families but not a draw, mixed tenant base, ~2y average lease.
- Market conditions: 39 active listings in the ZIP; 45 units permitted in Cortland County in 2024 (12 in 5+ unit buildings).
Forward outlook
- In year one you build about $11k of equity ($967 loan paydown + $10k appreciation (6.9% local appreciation)).
- Cortland County population projected at -15% by 2050 — secular population decline; favor cash flow + early exit over multi-decade hold.
- At projected returns (6.9% appreciation + 3.0% rent growth), your $39k cash investment doubles in ~2 years — after that, you're playing with house money.
- By year 4, paydown + projected appreciation supports a ~$36k cash-out refi (75% LTV) — recoverable capital for the next deal without selling this one.
Negotiation context
- It's been on market 27 days — a 2% lower offer ($138k) is reasonable based on typical stale-listing flexibility.
Risks & watch-outs
- Watch-outs: built in 1910 — expect roof / HVAC / electrical / plumbing capex.
Questions for the listing agent
- Can we see the unit-by-unit rent roll, current vacancy, and any below-market leases? What's the average tenancy length?
- What capital expenditures (roof, boiler, parking lot, exteriors) have been made in the last 5 years, and what's planned in the next 2?
- Have any recent inspections been done? Can we get a copy of the seller's disclosures and any deferred-maintenance estimates?
- Built in 1910 — when were the roof, HVAC, electrical panel, plumbing, and water heater last replaced?
- Is there a deadline driving the sale (1031 exchange, divorce, estate, relocation)? That informs how much negotiation room exists.
- Schools are B-rated — typically a magnet for longer-tenancy family renters. What's the average tenant stay here, and is there a school-zone premium baked into asking?
- What's the average days-on-market for RENTAL listings here right now (not sales)? A rising rental-DOM trend means longer vacancies and softer asking-rent achievability than the comps imply.
- What's the recent tenant-quality profile in this submarket — average credit score on applications, eviction rate, late-payment / NSF rate, and stable-employment percentage? A property-management company in the area should have these aggregated.
- How much new apartment / multifamily construction is in the pipeline within 1–3 miles? Heavy new supply (>2% of stock underway) typically softens rents 12–24 months out; light construction supports rent growth.
Investment metrics
- 1% rule
- 1.79% ✓
- Cap rate
- 15.02%
- Cash-on-cash
- 31.15%
- DSCR
- 2.39
- GRM
- 4.6
CMA / ARV
No comps found within radius.
Projected returns pro-forma
6.86% appreciation · 3.0% rent growth · sell at horizon
- IRR
- 43.2%
- Equity multiple
- 3.87×
- Total profit
- $112,416
- Equity at exit
- $95,628
- IRR
- 39.6%
- Equity multiple
- 8.11×
- Total profit
- $278,509
- Equity at exit
- $180,469
Cash invested: $39,172 (down + closing). Projections, not guarantees.
Landlord ↔ Tenant lean methodology
- Overall (STATE)
- 15 Strongly Tenant-Friendly
- State New York
- 15 Strongly Tenant-Friendly · D+10
- County
- — inherits STATE
- City
- — inherits STATE
ZIP-level market 13077
- Home prices YoY
- 2.4%
- Active inventory
- 39
- Price-to-rent
- 9.3×
Monthly cashflow live
- Estimated rent
- $2,511 medium interval (Pro) →
- Mortgage (P&I)
- −$734
- Tax est. 1.5%
- −$175 /mo · $2,098/yr
- Insurance
- −$58
- HOA
- −$0
- Vacancy / Maint / Mgmt
- −$527
- Net cashflow
- $1,017
Break-even live
2-unit breakdown (identical units grouped — click to expand)
| Units | Beds | Baths | Est. rent |
|---|---|---|---|
| 2× units | 2 | 1 | $2,510 |
| #1 | 2 | 1 | $1,255 |
| #2 | 2 | 1 | $1,255 |
| Total (2 units) | $2,511 | ||
UW: 25.0% down · 7.5% · 30yr · 1.5% tax · 5.0% vac · 8.0% maint · 8.0% mgmt
Financing live
Cash to close
- Down payment
- $34,975
- Closing costs
- $4,197
- Reserves months
- —
- Total cash needed
- —
Loan-product check · same deal, 3 products live
Conventional
25% down · 7.5% · 30yr
- Down + closing
- —
- Monthly P&I
- —
- Monthly cashflow
- —
- DSCR
- —
- Eligible?
- —
Personal DTI + credit; lowest rate.
DSCR
20% down · 8.5% · 30yr
- Down + closing
- —
- Monthly P&I
- —
- Monthly cashflow
- —
- DSCR
- —
- Eligible?
- —
No personal income docs; deal must DSCR.
Hard money
10% down · 12.0% · 12mo
- Down + closing
- —
- Monthly P&I
- —
- Monthly cashflow
- —
- DSCR
- —
- Eligible?
- —
Short-term bridge; refi at stabilization.
Listing history 15 events
-
2026-06-19days on market $139,900 Active 27 DOM
-
2026-06-18days on market $139,900 Active 26 DOM
-
2026-06-17days on market $139,900 Active 25 DOM
-
2026-06-16days on market $139,900 Active 24 DOM
-
2026-06-15days on market $139,900 Active 23 DOM
-
2026-06-14days on market $139,900 Active 21 DOM
-
2026-06-12days on market $139,900 Active 20 DOM
-
2026-06-09days on market $139,900 Active 17 DOM
-
2026-06-08days on market $139,900 Active 16 DOM
-
2026-06-07days on market $139,900 Active 15 DOM
-
2026-06-02days on market $139,900 Active 10 DOM
-
2026-06-01days on market $139,900 Active 9 DOM
-
2026-05-31days on market $139,900 Active 8 DOM
-
2026-05-30days on market $139,900 Active 7 DOM
-
2026-05-23$139,900 Active
ⓘ Source: listings_history table (triggers on properties + properties_extension) + one-shot
backfill from property_details.listing_events for pre-trigger history.
Nearby sold comps map
Loading sold comps map…
Walkable amenities ~0.75 mi
Loading nearby amenities…
Taxation est. · year 1
- Rental income
- $30,132
- − Mortgage interest
- −$7,837
- − Property taxes
- −$2,098
- − Insurance
- −$700
- − Repairs & maintenance
- −$2,411
- − Management
- −$2,411
- − Depreciation
- −$4,070
- Taxable income
- $10,606
- Est. tax owed @ 24.0%
- −$2,546
- After-tax cash flow
- $9,657/yr
For passive investors: Depreciation is non-cash, so a rental often shows a tax loss while cash-flowing — sheltering income. Rental losses are passive: they offset passive income freely, and up to $25,000/yr can offset ordinary (W-2) income if you actively participate and your MAGI is under $100k (phasing out to $0 by $150k); unused losses carry forward. On sale, claimed depreciation is recaptured at up to 25%, and gains may owe capital-gains tax (a 1031 exchange can defer both). Figures are a year-1 estimate at your 24.0% rate — not tax advice; consult a CPA.
Condition & rehab AI · 20 photos
This two-family home requires moderate repairs and maintenance to improve its condition and value. Key areas for improvement include the kitchen, bathrooms, exterior, and flooring. Paint and flooring updates would significantly enhance its resale and rental value.
Repairs flagged
- Moderate Kitchen cabinets — Worn condition
- Minor Bathroom countertops — Need cleaning
- Moderate Exterior siding — Weathered appearance
- Moderate Flooring — Worn hardwood floors
- Moderate Interior walls/paint — Faded paint
Value-add opportunities
- Resale Paint interior walls — Fresh paint enhances curb appeal
- Rental Replace worn flooring — New flooring improves comfort and reduces maintenance
- Resale Replace worn kitchen cabinets — Fresh cabinets improve aesthetics and functionality
Renovation cost estimate screening
| Repair item | Severity | Est. cost |
|---|---|---|
| Kitchen cabinets · Worn condition | Moderate | $3,000–15,000 |
| Bathroom countertops · Need cleaning | Minor | $500–3,000 |
| Exterior siding · Weathered appearance | Moderate | $3,000–15,000 |
| Flooring · Worn hardwood floors | Moderate | $3,000–15,000 |
| Interior walls/paint · Faded paint | Moderate | $3,000–15,000 |
| Total estimated repair cost · 5 items | $12,500–63,000 |
Value-add ROI direction
- Resale Paint interior walls — Fresh paint enhances curb appeal ↑
- Rental Replace worn flooring — New flooring improves comfort and reduces maintenance ↑
- Resale Replace worn kitchen cabinets — Fresh cabinets improve aesthetics and functionality ↑
ⓘ Cost ranges are severity-bucket heuristics (US national rule-of-thumb). Get contractor quotes + a written scope before underwriting a rehab budget.
Schools (NCES district)
- District
- Homer Central School District
- NCES district ID
- 3614640
- Math proficiency
- 49% ▼ -1.00%
- Reading proficiency
- 59% ▲ 9.00%
- Median HH income
- $60,122
- Composite
- 47.03/100
- National rank
- #2342
- State rank
- #306 of 590 in NY
Livability — Homer
- Score
- 76/100
- State rank
- #229
- US rank
- #3609
Category grades
Schools grade is shown separately in the Schools card above.
Census & demographics
- Population (ZIP)
- 6,567
Population outlook (Cortland County) Hauer SSP2
- Today (2025)
- 47,543 people
- By 2030
- 46,107 · -3.0%
- By 2040
- 43,122 · -9.3%
- By 2050
- 40,216 · -15.4%
- By 2075
- 34,717 · -27.0%
- By 2100
- 28,953 · -39.1%
Race, ethnicity, and origin ACS 2023
- Neighborhood character
- Predominantly White (95%)
- Race & ethnicity
- White 95% Two or more races 3% Asian 2%
- Common ancestry
- Romanian 3% Slovak 3% Serbian 2%
- Foreign-born
- 2% · China
- Languages at home
- 94% English-only · Other Indo-European 2% French/Haitian/Cajun 2% Chinese 2%
Political lean MEDSL · Cortland
- 2024 margin
- Lean R (+6.4) · D 46.8% · R 53.2%
- 2008→2024 swing
- -16.4pp toward R · 2008: 10.0pp · 2024: -6.4pp
- All cycles
- 2024: R+6.4 2020: R+1.9 2016: R+6.7 2012: D+8.8 2008: D+10.0
Not yet ingested
- Civics
- —
Market trends
- HPI YoY
- ▲ 6.86%
- Current HPI
- 298.7707
- Rent YoY
- —
- Metro
- —
- State GDP YoY
- ▲ 2.60%
- F500 in state
- 92
Industry mix (Fortune 500 HQ in NY)
| Industry | F500 HQs | Revenue |
|---|---|---|
| Financial Services | 10 | $950B |
|
||
| Consumer Goods | 9 | $162B |
|
||
| Insurance | 4 | $225B |
|
||
| Telecommunications | 2 | $144B |
|
||
| Pharmaceuticals | 2 | $112B |
|
||
| Media / Entertainment | 2 | $69B |
|
||
Price history
1 event — show timeline
- 2026-05-23 Listed $139,900 CNYIS
Cash-flow waterfall
monthlySold comps — $/sqft
last 12 mo · ≤1 miLoading sold comps…