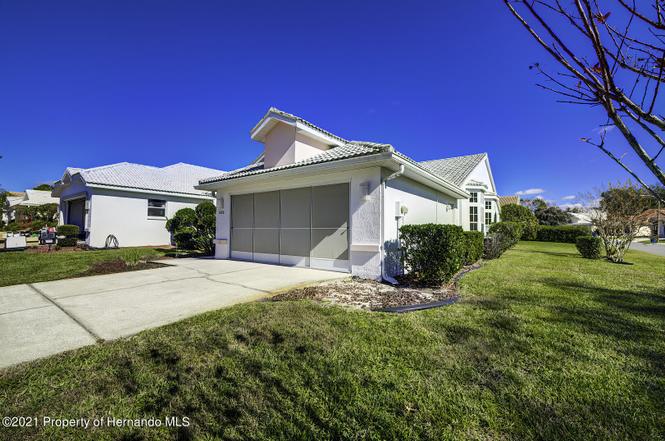
9288 New Orleans Dr · North Weeki Wachee, FL
Flood risk 1/10 · Minimal
- FEMA flood zone
- X (unshaded)
- Chance of flooding over 30 yrs
- 0.0%
- Est. flood insurance / yr
- $507 – $1,088
Fire risk 7/10 · Major
- Est. fire insurance / yr
- $947 – $1,759
Heat risk 10/10 · Severe
- Hot days now (above 110°F)
- 7 days/yr
- Hot days in 30 yrs
- 25 days/yr
Wind risk 10/10 · Severe
- Chance of severe wind over 30 yrs
- 99.0%
Air-quality risk 2/10 · Minimal
- Unhealthy air days now
- 2 days/yr
- Unhealthy air days in 30 yrs
- 2 days/yr
Risk factors via First Street. Map © Google.
Why this score? — see what drove the D grade
The composite is a weighted blend of 9 inputs, each scored 0–100. Each bar is that input's sub-score; the figure is the points it added to the 100-point composite (weight × sub-score).
- Cash flow +12.0/30.0
- ARV discount +10.9/15.0
- 1% rule +4.3/10.0
- Schools +4.2/10.0
- DSCR +3.6/10.0
- Livability +3.4/5.0
- Rent growth +2.5/5.0
- Condition / age +2.5/5.0
- Appreciation +0.0/10.0
$219,000
🖨 Deal sheet 📄 Offer letter ✓ Due diligence
Listing remarks
Under contract-accepting backup offers. One or more photo(s) has been virtually staged. WELCOME TO YOUR VACATION RETREAT located at 9288 New Orleans Dr, Weeki Wachee, FL inside an UPSCALE GATED GOLF COMMUNITY offering LUXURY AMENITIES and an UNMATCHED FLORIDA LIFESTYLE! This BEAUTIFULLY MAINTAINED home features 2 spacious bedrooms, 2 full bathrooms and a 2-car garage with an OPEN, AIRY layout designed for both comfort and entertaining. As you arrive, you’ll be IMPRESSED by the manicured landscaping (maintained by the HOA), elegant front elevation, tropical palms and charming covered & screened entry that create a FABULOUS curb appeal. Step inside and immediately feel the BRIGHT
Key facts
- Luxury amenities
- 7,274 sq ft lot
- 2 garage spots
Tags
Property features AI
Finance
- Other: Association amenities include handicap modifications and wheelchair access
- Financial info: Quarterly association fee listed; Lease restrictions apply
- HOA & community: Has HOA (Glen Lakes / First Services Residential) with approval required; Monthly HOA approximately $377.08 (quarterly fee shown as $1,131.24); HOA includes 24-hour guard, cable TV, internet, grounds maintenance, pool, recreational facilities, security, management, pest control, private road maintenance and escrow reserves; Community features: clubhouse, fitness center, pool, spa/hot tub, tennis, pickleball, shuffleboard, trails, park, sidewalks, street lights, gated community, golf and deed restrictions; Pets allowed (cats and dogs)
Exterior
- Parking: Attached 2-car garage (21 x 22); Covered parking; Driveway; Garage door opener; Ground-level parking; Off-street parking
- Security: Gated community; Security system; Smoke detectors
- Utilities: Public water; Public sewer; Electricity available and connected; Cable available and connected; High-speed internet/BB/HS available; Underground utilities; Water and sewer connected
- Home design: Single family residence; One story; West-facing; Accessible entrance and accessible central living area
- Construction: Block, concrete and stucco construction; Tile roof; Slab foundation; Completed condition; Built with accessible kitchen and washer/dryer access
- Exterior features: Covered, enclosed and screened patios/porches (front and rear); Patio and porch areas including screened rear porch; Awnings; Exterior lighting; Rain gutters; Sidewalk; Sliding doors; Mature landscaping with trees; Level, cleared and landscaped corner lot; Near golf course, marina and public transit; Private lot with paved access and private maintained road
Interior
- Kitchen: Dishwasher; Disposal; Microwave; Range; Refrigerator
- Bedrooms: 2 bedrooms
- Flooring: Carpet; Ceramic tile
- Bathrooms: 2 full bathrooms
- Heating & cooling: Central heating (electric, heat pump); Central air conditioning
- Interior features: Built-in features; Ceiling fans; Eat-in kitchen; High ceilings; Living room/dining room combo; Open floorplan; Solid surface counters; Solid wood cabinets; Split bedroom layout; Thermostat; Walk-in closets; Window treatments (blinds, rods)
- Laundry & utility: Washer hookup; Dryer hookup (electric); Inside laundry with laundry closet; Inside utility
Neighborhood map
What this means for you Summary
Snapshot
- This is a 2-bed/2.0-bath single-family listed at $219k.
Deal economics
- At list price, monthly cash flow is $-51 ($-610/yr) — negative.
- To cash-flow at today's rent, offer at most $210k (4.1% below list).
- To meet the 1% rule (rent ≥ 1% of price), the offer needs to be $203k (7.3% below list).
- Recommended offer: $193k (12.0% below list) — sets the bar for market timing.
- Cap rate 6.0% vs local median 3.9% in North Weeki Wachee — top-decile yield for the area; either an underpriced asset or a hidden risk that comps aren't pricing in. Stress-test before assuming the spread holds.
Location & tenants
- Location reads 68/100 on livability (#534 in FL) — a middle-class / working-renter tenant base. Strengths: cost of living A+, housing A+, crime B+; Watch: health & safety C-, amenities F, commute F.
- Hernando (suburban): math 50% / reading 50% proficiency, ranked #38 of 73 in FL (top 52%) — acceptable for families but not a draw, mixed tenant base, ~2y average lease.
- Zoned schools: Winding Waters K-8 (math 50% / reading 48%, grade D, #1,134 of 2,144 statewide, top 54%, 1,622 students, 56% FRL); Weeki Wachee High School (math 41% / reading 42%, grade F, #284 of 667 statewide, top 43%, 1,435 students, 52% FRL) — zoned schools at 54% FRL track the district average.
- Market conditions: 691 active listings in the ZIP; 3 comparable units currently listed for rent nearby; rentals leasing fast (median 3d on market — plan ~1-2 weeks tenant-placement turnaround); 2,505 units permitted in Hernando County in 2024 (318 in 5+ unit buildings).
- This rent runs 42% of the median local income ($59k/yr) — at the standard rent-burdened threshold; future hikes will face affordability resistance.
Forward outlook
- Local home prices are declining (-3.0%/yr); year-one equity from $2k of loan paydown is wiped out by about $7k of value loss. Plan a longer hold.
- Hernando County population projected at +11% by 2050 — modest demand growth; plan on rents tracking national, not racing it.
Negotiation context
- It's been on market 127 days — a 12% lower offer ($193k) is reasonable based on typical stale-listing flexibility.
- 9 sale attempts since 5y ago; this cycle's ask has dropped $21k (9%) from the opening price — seller is motivated, your offer sets the floor, not the list.
Risks & watch-outs
- Climate carrying-cost: severe wind risk, 99% chance of damaging wind over 30y; major wildfire risk; extreme-heat days projected 7→25/yr by 2055 (HVAC capex compounding) — expect insurance premiums to compound above CPI over the hold.
Questions for the listing agent
- What do current leases actually rent for vs. the listed asking? Can we see a recent rent roll and the last 12 months of T-12 income?
- It's been on market 127 days. Have you received any prior offers? Is the seller open to a 12% concession, seller financing, or rate buy-down credit?
- What does the HOA fee cover, when was the last increase, and are there any pending special assessments or reserve-fund shortfalls?
- Why hasn't it sold? Are there any deal-killer items the seller is aware of (foundation, flood, title, zoning, code violations)?
- Is there a deadline driving the sale (1031 exchange, divorce, estate, relocation)? That informs how much negotiation room exists.
- Schools are F-rated, which usually means shorter tenancies and higher turnover. Who's the typical renter profile here, and what's been the actual vacancy rate?
- The area grade is low — what's the realistic commute time and amenity access for the typical tenant pool here? Any planned neighborhood developments (good or bad) we should know about?
- What's the average days-on-market for RENTAL listings here right now (not sales)? A rising rental-DOM trend means longer vacancies and softer asking-rent achievability than the comps imply.
- What's the recent tenant-quality profile in this submarket — average credit score on applications, eviction rate, late-payment / NSF rate, and stable-employment percentage? A property-management company in the area should have these aggregated.
- How much new for-sale + rental construction is in the pipeline within 1–3 miles? Heavy new supply typically softens prices + rents 12–24 months out; constrained supply supports both.
Investment metrics
- 1% rule
- 0.93% ✗
- Cap rate
- 6.01%
- Cash-on-cash
- -1.00%
- DSCR
- 0.96
- GRM
- 9.0
CMA / ARV
- ARV (on-the-fly)
- $237,016
- Comps found
- 12
Show comp detail 12 sales within ~0.75 mi
| Address | Dist | Beds/Ba | Sqft | Sold | Price | $/sf | Match |
|---|---|---|---|---|---|---|---|
| 9287 New Orleans Dr | 0.03mi | 2/2.0 | 1,391 (+1%) | 11mo | $225,000 | $162 | 88 |
| 9398 Mississippi Run | 0.03mi | 2/2.0 | 1,496 (+9%) | 12mo | $258,000 | $172 | 74 |
| 9411 Burnam Dr | 0.56mi | 2/2.0 | 1,325 (-4%) | 1mo | $215,000 | $162 | 66 |
| 9154 Rhett Ln | 0.71mi | 2/2.0 | 1,378 (0%) | 6mo | $292,000 | $212 | 62 |
| 9407 Burnam Dr | 0.57mi | 2/2.0 | 1,322 (-4%) | 7mo | $235,000 | $178 | 61 |
| 9188 Rhett Ln | 0.70mi | 2/2.0 | 1,378 (0%) | 9mo | $225,000 | $163 | 60 |
| 10155 Duffy Cir | 0.60mi | 2/2.5 | 1,510 (+10%) | 2mo | $250,000 | $166 | 53 |
| 10109 Holly Berry Dr | 0.60mi | 2/2.0 | 1,579 (+15%) | 7mo | $285,000 | $180 | 42 |
| 10105 Holly Berry Dr | 0.59mi | 2/2.0 | 1,579 (+15%) | 12mo | $330,000 | $209 | 38 |
| 10181 Holly Berry Dr | 0.67mi | 2/2.0 | 1,558 (+13%) | 11mo | $264,500 | $170 | 38 |
| 9050 Penelope Dr | 0.73mi | 3/2.0 (+1) | 1,568 (+14%) | 2mo | $297,500 | $190 | 36 |
| 9147 Rhett Ln | 0.74mi | 2/2.0 | 1,576 (+14%) | 8mo | $250,000 | $159 | 35 |
Match score weights: distance 35% · size 25% · config 20% · recency 20%. Top-matched comps best support the ARV.
Projected returns pro-forma
-3.0% appreciation · 3.0% rent growth · sell at horizon
- IRR
- -17.9%
- Equity multiple
- 0.37×
- Total profit
- $-38,610
- Equity at exit
- $32,654
- IRR
- -9.9%
- Equity multiple
- 0.39×
- Total profit
- $-37,315
- Equity at exit
- $18,935
Cash invested: $61,320 (down + closing). Projections, not guarantees.
Landlord ↔ Tenant lean methodology
- Overall (STATE)
- 87 Strongly Landlord-Friendly
- State Florida
- 87 Strongly Landlord-Friendly · R+3
- County
- — inherits STATE
- City
- — inherits STATE
ZIP-level market 34613
- Home prices YoY
- -17.2%
- Active inventory
- 691
- Price-to-rent
- 9.0×
Monthly cashflow live
- Estimated rent
- $2,031 medium interval (Pro) →
- Mortgage (P&I)
- −$1,148
- Tax from tax record
- −$38 /mo · $460/yr
- Insurance
- −$91
- HOA
- −$377
- Vacancy / Maint / Mgmt
- −$426
- Net cashflow
- $-51
Break-even live
UW: 25.0% down · 7.5% · 30yr · 1.5% tax · 5.0% vac · 8.0% maint · 8.0% mgmt
Financing live
Cash to close
- Down payment
- $54,750
- Closing costs
- $6,570
- Reserves months
- —
- Total cash needed
- —
Loan-product check · same deal, 3 products live
Conventional
25% down · 7.5% · 30yr
- Down + closing
- —
- Monthly P&I
- —
- Monthly cashflow
- —
- DSCR
- —
- Eligible?
- —
Personal DTI + credit; lowest rate.
DSCR
20% down · 8.5% · 30yr
- Down + closing
- —
- Monthly P&I
- —
- Monthly cashflow
- —
- DSCR
- —
- Eligible?
- —
No personal income docs; deal must DSCR.
Hard money
10% down · 12.0% · 12mo
- Down + closing
- —
- Monthly P&I
- —
- Monthly cashflow
- —
- DSCR
- —
- Eligible?
- —
Short-term bridge; refi at stabilization.
Rent comps 3 comps
| Address | Beds | Baths | Sqft | Rent | $/sqft | DOM | Units | Dist |
|---|---|---|---|---|---|---|---|---|
| 9408 New Orleans Dr Weeki Wachee, FL | 2.0 | 2.0 | 1650 | $1,995 | $1.21 | 24d | 1 | 0.18mi |
| 9104 Wade St Brooksville, FL | 3.0 | 2.0 | 1550 | $2,195 | $1.42 | 2d | 3 | 0.76mi |
| 8983 Wade St Unit 8388 Brooksville, FL | 3.0 | 2.0 | 1550 | $2,246 | $1.45 | 2d | 1 | 0.78mi |
HOA detail
- Monthly dues
- $377 · $4,524/yr
- Likely covers
- landscapingsecurity
Listing history 30 events
-
2026-05-01price $219,000
-
2026-03-09price $229,000
-
2026-01-30price $235,000
-
2026-01-25historical $2,600
-
2026-01-21$240,000 Active
-
2025-12-25historical
-
2025-12-25historical
-
2025-12-21price $2,600
-
2025-12-19price $250,000
-
2025-12-19price $250,000
-
2025-12-16$2,680
-
2025-10-07$260,000 Active
-
2025-10-07$260,000 Active
-
2024-12-17historical
-
2024-10-22$267,500 Active
-
2022-02-15soldstatus $220,000
-
2022-02-09soldstatus $220,000 Closed
-
2022-02-09soldstatus $220,000
-
2022-02-09soldstatus $218,500 Closed
-
2022-01-27status Pending
-
2022-01-10historical Active Under Contract - Accepting Back Up Offers
-
2022-01-10$220,000 Active
-
2022-01-07status Pending
-
2022-01-07historical Active Under Contract - Accepting Back Up Offers
-
2022-01-07soldstatus $220,000 Closed
-
2021-12-31$220,000 Active
-
2021-12-31$220,000
-
2021-12-31$220,000 Active
-
2002-07-11soldstatus $114,900
-
1991-07-01soldstatus $21,000
ⓘ Source: listings_history table (triggers on properties + properties_extension) + one-shot
backfill from property_details.listing_events for pre-trigger history.
Tax reassessment forecast FL · Resets to sale price
- Current annual tax
- $460 · $38/mo
- Projected year-2 tax
- $1,818 · $151/mo
- Expected delta
- +$1,357/yr (+$113/mo · 294.8%)
ⓘ Screening estimate from a state-policy table — verify with the county assessor before closing.
Climate risk First Street
- Flood 1/10 Low FEMA zone X (unshaded) · 0% chance over 30 yrs
- Wildfire 7/10 Severe
- Heat 10/10 Extreme 7 d/yr ≥110°F today · 25 d/yr by 30 yrs out
- Wind 10/10 Extreme 99% chance of damaging wind over 30 yrs
- Air quality 2/10 Low 2 unhealthy d/yr today · 2 by 30 yrs out
Nearby sold comps map
Loading sold comps map…
Walkable amenities ~0.75 mi
Loading nearby amenities…
Taxation est. · year 1
- Rental income
- $24,368
- − Mortgage interest
- −$12,267
- − Property taxes
- −$460
- − Insurance
- −$1,095
- − Repairs & maintenance
- −$1,949
- − Management
- −$1,949
- − HOA
- −$4,524
- − Depreciation
- −$6,371
- Taxable loss
- −$4,249
- Est. tax savings @ 24.0%
- +$1,020
- After-tax cash flow
- $409/yr
For passive investors: Depreciation is non-cash, so a rental often shows a tax loss while cash-flowing — sheltering income. Rental losses are passive: they offset passive income freely, and up to $25,000/yr can offset ordinary (W-2) income if you actively participate and your MAGI is under $100k (phasing out to $0 by $150k); unused losses carry forward. On sale, claimed depreciation is recaptured at up to 25%, and gains may owe capital-gains tax (a 1031 exchange can defer both). Figures are a year-1 estimate at your 24.0% rate — not tax advice; consult a CPA.
Schools (NCES district)
- District
- Hernando
- NCES district ID
- 1200810
- Math proficiency
- 50% ▼ -8.00%
- Reading proficiency
- 50% ▼ -4.00%
- Median HH income
- $41,985
- Composite
- 42.03/100
- National rank
- #3329
- State rank
- #38 of 73 in FL
Livability — North Weeki Wachee
- Score
- 68/100
- State rank
- #534
- US rank
- #10019
Category grades
Schools grade is shown separately in the Schools card above.
Census & demographics
- Census place
- North Weeki Wachee, FL
- County
- Hernando County · 169,677 people
- Metro
- Tampa-St. Petersburg-Clearwater, FL
- Population (ZIP)
- 19,337
- Household income
- $58,596
- Rent vs Own
- Severe rent burden
- 307.0
Population outlook (Hernando County) Hauer SSP2
- Today (2025)
- 189,218 people
- By 2030
- 194,367 · +2.7%
- By 2040
- 203,398 · +7.5%
- By 2050
- 209,589 · +10.8%
- By 2075
- 218,452 · +15.4%
- By 2100
- 205,923 · +8.8%
Race, ethnicity, and origin ACS 2023
- Neighborhood character
- Predominantly White (88%)
- Race & ethnicity
- White 88% Hispanic / Latino 6% Two or more races 4% Black 2% Asian 1%
- Hispanic origin (detail)
- Mexican 1% Puerto Rican 2% Cuban 1%
- Common ancestry
- Romanian 4% Lithuanian 3% Slovak 2%
- Foreign-born
- 8% · Canada, Vietnam
- Languages at home
- 92% English-only · Spanish 3% French/Haitian/Cajun 1% Russian/Polish/Slavic 1%
Political lean MEDSL · Hernando
- 2024 margin
- Solid R (+37.0) · D 31.1% · R 68.2%
- 2008→2024 swing
- -33.5pp toward R · 2008: -3.6pp · 2024: -37.0pp
- All cycles
- 2024: R+37.0 2020: R+30.2 2016: R+29.0 2012: R+8.5 2008: R+3.6
Not yet ingested
- Civics
- —
Market trends
- HPI YoY
- ▼ -57.51%
- Current HPI
- 276.2229
- Rent YoY
- —
- Metro
- Tampa-St. Petersburg-Clearwater, FL
- State GDP YoY
- ▲ 3.28%
- F500 in state
- 36
Industry mix (Fortune 500 HQ in FL)
| Industry | F500 HQs | Revenue |
|---|---|---|
| Industrial Technology | 2 | $29B |
|
||
| Insurance | 2 | $17B |
|
||
| Retail | 1 | $60B |
|
||
| Technology Distribution | 1 | $58B |
|
||
| Homebuilding | 1 | $35B |
|
||
| Technology Manufacturing | 1 | $35B |
|
||
Price history
+942.9% since first listed30 events — show timeline
- 2026-05-01 Price Changed $219,000 Stellar MLS as Distributed by MLS Grid
- 2026-03-09 Price Changed $229,000 Stellar MLS as Distributed by MLS Grid
- 2026-01-30 Price Changed $235,000 Stellar MLS as Distributed by MLS Grid
- 2026-01-25 Rental Removed $2,600 TURBOTENANT
- 2026-01-21 Listed $240,000 Stellar MLS as Distributed by MLS Grid
- 2025-12-25 Listing Removed — HCAR
- 2025-12-25 Listing Removed — Stellar MLS as Distributed by MLS Grid
- 2025-12-21 Price Changed $2,600 TURBOTENANT
- 2025-12-19 Price Changed $250,000 HCAR
- 2025-12-19 Price Changed $250,000 Stellar MLS as Distributed by MLS Grid
- 2025-12-16 Listed for Rent $2,680 TURBOTENANT
- 2025-10-07 Listed $260,000 HCAR
- 2025-10-07 Listed $260,000 Stellar MLS as Distributed by MLS Grid
- 2024-12-17 Listing Removed — Stellar MLS as Distributed by MLS Grid
- 2024-10-22 Listed $267,500 Stellar MLS as Distributed by MLS Grid
- 2022-02-15 Sold (Public Records) $220,000 Public Records
- 2022-02-09 Sold (MLS) $218,500 Stellar MLS as Distributed by MLS Grid
- 2022-02-09 Sold (MLS) $220,000 St. Augustine and St. Johns County Board of REALTORS®
- 2022-02-09 Sold (MLS) $220,000 HCAR
- 2022-01-27 Pending — HCAR
- 2022-01-10 Contingent — HCAR
- 2022-01-10 Listed $220,000 HCAR
- 2022-01-07 Pending — Stellar MLS as Distributed by MLS Grid
- 2022-01-07 Contingent — HCAR
- 2022-01-07 Sold (MLS) $220,000 HCAR
- 2021-12-31 Listed $220,000 Stellar MLS as Distributed by MLS Grid
- 2021-12-31 Listed $220,000 St. Augustine and St. Johns County Board of REALTORS®
- 2021-12-31 Listed $220,000 HCAR
- 2002-07-11 Sold (Public Records) $114,900 Public Records
- 1991-07-01 Sold (Public Records) $21,000 Public Records
Property tax history
-3.0%/yrLatest (2025): $460 · -0.7% YoY. Source: county tax records.
Cash-flow waterfall
monthlySold comps — $/sqft
last 12 mo · ≤1 miLoading sold comps…