 Duplex
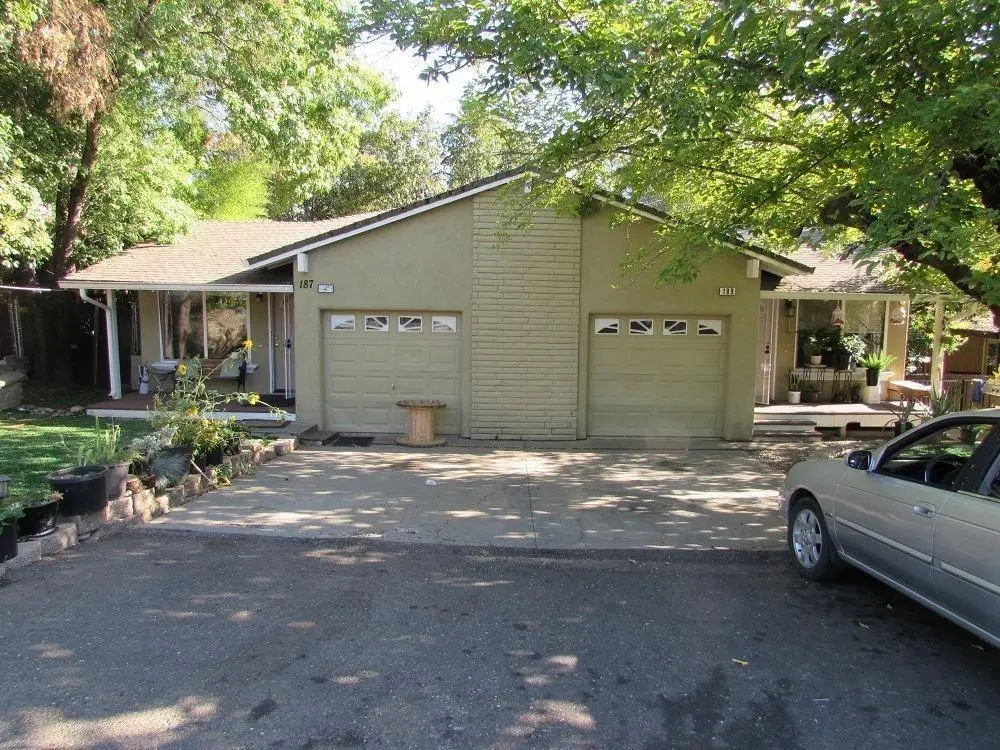
187 - 189 E Hillcrest Dr · North Auburn, CA
Flood risk 1/10 · Minimal
- FEMA flood zone
- X (unshaded)
- Chance of flooding over 30 yrs
- 0.0%
- Est. flood insurance / yr
- $507 – $1,088
Fire risk 9/10 · Severe
- Est. fire insurance / yr
- $659 – $1,223
Heat risk 6/10 · Moderate
- Hot days now (above 99°F)
- 7 days/yr
- Hot days in 30 yrs
- 16 days/yr
Wind risk 1/10 · Minimal
- Chance of severe wind over 30 yrs
- —
Air-quality risk 10/10 · Severe
- Unhealthy air days now
- 34 days/yr
- Unhealthy air days in 30 yrs
- 41 days/yr
Risk factors via First Street. Map © Google.
Why this score? — see what drove the F grade
The composite is a weighted blend of 9 inputs, each scored 0–100. Each bar is that input's sub-score; the figure is the points it added to the 100-point composite (weight × sub-score).
- Cash flow +9.1/30.0
- ARV discount +7.5/15.0
- Schools +4.9/10.0
- Rent growth +3.1/5.0
- Livability +3.1/5.0
- DSCR +2.5/10.0
- Condition / age +2.5/5.0
- 1% rule +2.0/10.0
- Appreciation +0.0/10.0
$625,000
🖨 Deal sheet 📄 Offer letter ✓ Due diligence
Multi-family units
County records classify this as Multi-Family (2-4 Unit). Listing-text estimate: 2 units. confirmed
Listing remarks
Both units occupied for multiple years by the same tenants. 4 bedrooms 2 baths with living room area and kitchen dining room combos.
Key facts
- 6,808 sq ft lot
- 4 parking spots
- Built 1976
Property features AI
Finance
- HOA & community: No association
Exterior
- Parking: Off-street parking for 4 vehicles
- Utilities: Cable available; Natural gas connected; 220 volt electric; Public sewer; Public water with on-site meter
- Home design: Residential income property — duplex (flats); Built in 1976
- Construction: Composition roof
- Exterior features: Yard space; Composition roof
Interior
- Kitchen: Free-standing gas range; Dishwasher; Microwave; Garbage disposal
- Bedrooms: Two 3-bedroom units (each unit has 3 bedrooms)
- Flooring: Carpet; Simulated wood flooring
- Bathrooms: Unit 1: 2 full bathrooms; Unit 2: 1 full bathroom and 1 partial bathroom
- Heating & cooling: Central heating; Central cooling
- Interior features: Covered patio; Dual-pane partial windows; One level / single-story layout
- Laundry & utility: Laundry in each unit
Neighborhood map
What this means for you Summary
Snapshot
- This is a 2 × 2-bed/1-bath units multifamily listed at $625k.
Deal economics
- At list price, monthly cash flow is $-479 ($-6k/yr) — negative. Per door: $-239/mo.
- To cash-flow at today's rent, offer at most $540k (13.5% below list).
- To meet the 1% rule (rent ≥ 1% of price), the offer needs to be $438k (29.9% below list).
- Recommended offer: $438k (29.9% below list) — sets the bar for 1% rule.
- Cap rate 5.4% vs local median 2.6% in North Auburn — top-decile yield for the area; either an underpriced asset or a hidden risk that comps aren't pricing in. Stress-test before assuming the spread holds.
Location & tenants
- Location reads 61/100 on livability (#519 in CA) — a middle-class / working-renter tenant base. Strengths: employment A-, housing A-; Watch: schools F, crime D-, amenities F.
- Placer Union High (suburban): math 39% / reading 72% proficiency, ranked #98 of 517 in CA (top 19%) — acceptable for families but not a draw, mixed tenant base, ~2y average lease.
- Market conditions: Rents rising (+2.3%/yr); 204 active listings in the ZIP; solid renter incomes; 3,535 units permitted in Placer County in 2024 (689 in 5+ unit buildings).
- At $4,384/mo this rent would consume 62% of the median local household income ($85k/yr) (locally 1017% of renters already pay >50% of income on rent) — very limited rent-growth headroom before tenants either downsize or default.
Forward outlook
- Local home prices are declining (-3.0%/yr); year-one equity from $4k of loan paydown is wiped out by about $19k of value loss. Plan a longer hold.
- Placer County population projected at +20% by 2050 — long-run rental-demand tailwind backs the buy-and-hold thesis.
Negotiation context
- It's been on market 71 days — a 6% lower offer ($588k) is reasonable based on typical stale-listing flexibility.
- Current owner paid $220k; list at $625k implies a 184% gain — meaningful room to come down on a strong offer.
Risks & watch-outs
- Climate carrying-cost: severe wildfire risk; extreme-heat days projected 7→16/yr by 2055 (HVAC capex compounding) — expect insurance premiums to compound above CPI over the hold.
Questions for the listing agent
- What do current leases actually rent for vs. the listed asking? Can we see a recent rent roll and the last 12 months of T-12 income?
- It's been on market 71 days. Have you received any prior offers? Is the seller open to a 30% concession, seller financing, or rate buy-down credit?
- Can we see the unit-by-unit rent roll, current vacancy, and any below-market leases? What's the average tenancy length?
- What capital expenditures (roof, boiler, parking lot, exteriors) have been made in the last 5 years, and what's planned in the next 2?
- Built in 1976 — when were the roof, HVAC, electrical panel, plumbing, and water heater last replaced?
- Why hasn't it sold? Are there any deal-killer items the seller is aware of (foundation, flood, title, zoning, code violations)?
- Is there a deadline driving the sale (1031 exchange, divorce, estate, relocation)? That informs how much negotiation room exists.
- Schools are F-rated, which usually means shorter tenancies and higher turnover. Who's the typical renter profile here, and what's been the actual vacancy rate?
- Crime grade is D in this area — have there been break-ins, vandalism, or insurance claims at this property in the last 3 years? What carrier currently insures it and at what premium?
- The area grade is low — what's the realistic commute time and amenity access for the typical tenant pool here? Any planned neighborhood developments (good or bad) we should know about?
- What's the average days-on-market for RENTAL listings here right now (not sales)? A rising rental-DOM trend means longer vacancies and softer asking-rent achievability than the comps imply.
- What's the recent tenant-quality profile in this submarket — average credit score on applications, eviction rate, late-payment / NSF rate, and stable-employment percentage? A property-management company in the area should have these aggregated.
- How much new apartment / multifamily construction is in the pipeline within 1–3 miles? Heavy new supply (>2% of stock underway) typically softens rents 12–24 months out; light construction supports rent growth.
Investment metrics
- 1% rule
- 0.70% ✗
- Cap rate
- 5.37%
- Cash-on-cash
- -3.28%
- DSCR
- 0.85
- GRM
- 11.9
CMA / ARV
No comps found within radius.
Projected returns pro-forma
-3.0% appreciation · 2.34% rent growth · sell at horizon
- IRR
- -22.5%
- Equity multiple
- 0.23×
- Total profit
- $-134,842
- Equity at exit
- $93,190
- IRR
- -18.4%
- Equity multiple
- 0.03×
- Total profit
- $-169,085
- Equity at exit
- $54,039
Cash invested: $175,000 (down + closing). Projections, not guarantees.
Landlord ↔ Tenant lean methodology
- Overall (STATE)
- 18 Strongly Tenant-Friendly
- State California
- 18 Strongly Tenant-Friendly · D+13
- County
- — inherits STATE
- City
- — inherits STATE
ZIP-level market 95603
- Rents YoY
- 2.3%
- Active inventory
- 204
- Price-to-rent
- 23.8×
Monthly cashflow live
- Estimated rent
- $4,384 high interval (Pro) →
- Mortgage (P&I)
- −$3,278
- Tax from tax record
- −$404 /mo · $4,852/yr
- Insurance
- −$260
- HOA
- −$0
- Vacancy / Maint / Mgmt
- −$921
- Net cashflow
- $-479
Break-even live
2-unit breakdown (identical units grouped — click to expand)
| Units | Beds | Baths | Est. rent |
|---|---|---|---|
| 2× units | 2 | 1 | $4,384 |
| #1 | 2 | 1 | $2,192 |
| #2 | 2 | 1 | $2,192 |
| Total (2 units) | $4,384 | ||
UW: 25.0% down · 7.5% · 30yr · 1.5% tax · 5.0% vac · 8.0% maint · 8.0% mgmt
Financing live
Cash to close
- Down payment
- $156,250
- Closing costs
- $18,750
- Reserves months
- —
- Total cash needed
- —
Loan-product check · same deal, 3 products live
Conventional
25% down · 7.5% · 30yr
- Down + closing
- —
- Monthly P&I
- —
- Monthly cashflow
- —
- DSCR
- —
- Eligible?
- —
Personal DTI + credit; lowest rate.
DSCR
20% down · 8.5% · 30yr
- Down + closing
- —
- Monthly P&I
- —
- Monthly cashflow
- —
- DSCR
- —
- Eligible?
- —
No personal income docs; deal must DSCR.
Hard money
10% down · 12.0% · 12mo
- Down + closing
- —
- Monthly P&I
- —
- Monthly cashflow
- —
- DSCR
- —
- Eligible?
- —
Short-term bridge; refi at stabilization.
Listing history 15 events
-
2026-06-18days on market $625,000 Active 71 DOM
-
2026-06-17days on market $625,000 Active 70 DOM
-
2026-06-16days on market $625,000 Active 69 DOM
-
2026-06-15days on market $625,000 Active 68 DOM
-
2026-06-13days on market $625,000 Active 66 DOM
-
2026-06-13days on market $625,000 Active 65 DOM
-
2026-06-09days on market $625,000 Active 62 DOM
-
2026-06-08days on market $625,000 Active 61 DOM
-
2026-06-07days on market $625,000 Active 60 DOM
-
2026-06-03days on market $625,000 Active 56 DOM
-
2026-06-02days on market $625,000 Active 55 DOM
-
2026-06-01days on market $625,000 Active 54 DOM
-
2026-05-31days on market $625,000 Active 53 DOM
-
2002-07-10soldstatus $220,000
-
1992-10-30soldstatus $165,000
ⓘ Source: listings_history table (triggers on properties + properties_extension) + one-shot
backfill from property_details.listing_events for pre-trigger history.
Tax reassessment forecast CA · Resets to sale price
- Current annual tax
- $4,852 · $404/mo
- Projected year-2 tax
- $4,852 · $404/mo
- Expected delta
- $0/yr ($0/mo · 0.0%)
ⓘ Screening estimate from a state-policy table — verify with the county assessor before closing.
Climate risk First Street
- Flood 1/10 Low FEMA zone X (unshaded) · 0% chance over 30 yrs
- Wildfire 9/10 Extreme
- Heat 6/10 Major 7 d/yr ≥99°F today · 16 d/yr by 30 yrs out
- Wind 1/10 Low
- Air quality 10/10 Extreme 34 unhealthy d/yr today · 41 by 30 yrs out
Nearby sold comps map
Loading sold comps map…
Walkable amenities ~0.75 mi
Loading nearby amenities…
Taxation est. · year 1
- Rental income
- $52,608
- − Mortgage interest
- −$35,010
- − Property taxes
- −$4,852
- − Insurance
- −$3,125
- − Repairs & maintenance
- −$4,209
- − Management
- −$4,209
- − Depreciation
- −$18,182
- Taxable loss
- −$16,978
- Est. tax savings @ 24.0%
- +$4,075
- After-tax cash flow
- $-1,673/yr
For passive investors: Depreciation is non-cash, so a rental often shows a tax loss while cash-flowing — sheltering income. Rental losses are passive: they offset passive income freely, and up to $25,000/yr can offset ordinary (W-2) income if you actively participate and your MAGI is under $100k (phasing out to $0 by $150k); unused losses carry forward. On sale, claimed depreciation is recaptured at up to 25%, and gains may owe capital-gains tax (a 1031 exchange can defer both). Figures are a year-1 estimate at your 24.0% rate — not tax advice; consult a CPA.
Schools (NCES district)
- District
- Placer Union High
- NCES district ID
- 0630750
- Math proficiency
- 39% ▲ 1.00%
- Reading proficiency
- 72% ▲ 3.00%
- Median HH income
- $69,119
- Composite
- 49.04/100
- National rank
- #2060
- State rank
- #98 of 517 in CA
Livability — North Auburn
- Score
- 61/100
- State rank
- #519
- US rank
- #17512
Category grades
Schools grade is shown separately in the Schools card above.
Census & demographics
- Census place
- North Auburn, CA
- County
- Placer County · 390,510 people
- City population
- 28,195
- Metro
- Sacramento-Roseville-Folsom, CA
- Population (ZIP)
- 28,432
- Household income
- $85,357
- Rent vs Own
- Severe rent burden
- 1017.0
Population outlook (Placer County) Hauer SSP2
- Today (2025)
- 422,709 people
- By 2030
- 444,249 · +5.1%
- By 2040
- 480,192 · +13.6%
- By 2050
- 506,390 · +19.8%
- By 2075
- 550,219 · +30.2%
- By 2100
- 547,760 · +29.6%
Race, ethnicity, and origin ACS 2023
- Neighborhood character
- Predominantly White (73%)
- Race & ethnicity
- White 73% Hispanic / Latino 17% Two or more races 11% Asian 3%
- Hispanic origin (detail)
- Mexican 12%
- Common ancestry
- Italian 3% Slovak 3% Lithuanian 2%
- Foreign-born
- 9% · Canada, South Korea
- Languages at home
- 88% English-only · Spanish 10% Other Indo-European 1% Tagalog/Filipino 1%
Political lean MEDSL · Placer
- 2024 margin
- Lean R (+8.5) · D 44.3% · R 52.8% · Other 2.9%
- 2008→2024 swing
- +2.8pp toward D · 2008: -11.3pp · 2024: -8.5pp
- All cycles
- 2024: R+8.5 2020: R+6.7 2016: R+11.3 2012: R+20.1 2008: R+11.3
Not yet ingested
- Civics
- —
Market trends
- HPI YoY
- ▼ -500.89%
- Current HPI
- 251.4573
- Rent YoY
- ▲ 2.34%
- Metro
- Sacramento-Roseville-Folsom, CA
- State GDP YoY
- ▲ 3.21%
- F500 in state
- 116
Industry mix (Fortune 500 HQ in CA)
| Industry | F500 HQs | Revenue |
|---|---|---|
| Technology | 27 | $1,492B |
|
||
| Financial Services | 3 | $174B |
|
||
| Retail | 3 | $44B |
|
||
| Insurance | 3 | $26B |
|
||
| Media / Entertainment | 2 | $115B |
|
||
| Pharmaceuticals / Biotech | 2 | $62B |
|
||
Price history
+33.3% since first listed2 events — show timeline
- 2002-07-10 Sold (Public Records) $220,000 Public Records
- 1992-10-30 Sold (Public Records) $165,000 Public Records
Property tax history
+1.4%/yrLatest (2025): $4,852 · +2.0% YoY. Source: county tax records.
Cash-flow waterfall
monthlySold comps — $/sqft
last 12 mo · ≤1 miLoading sold comps…