 Triplex
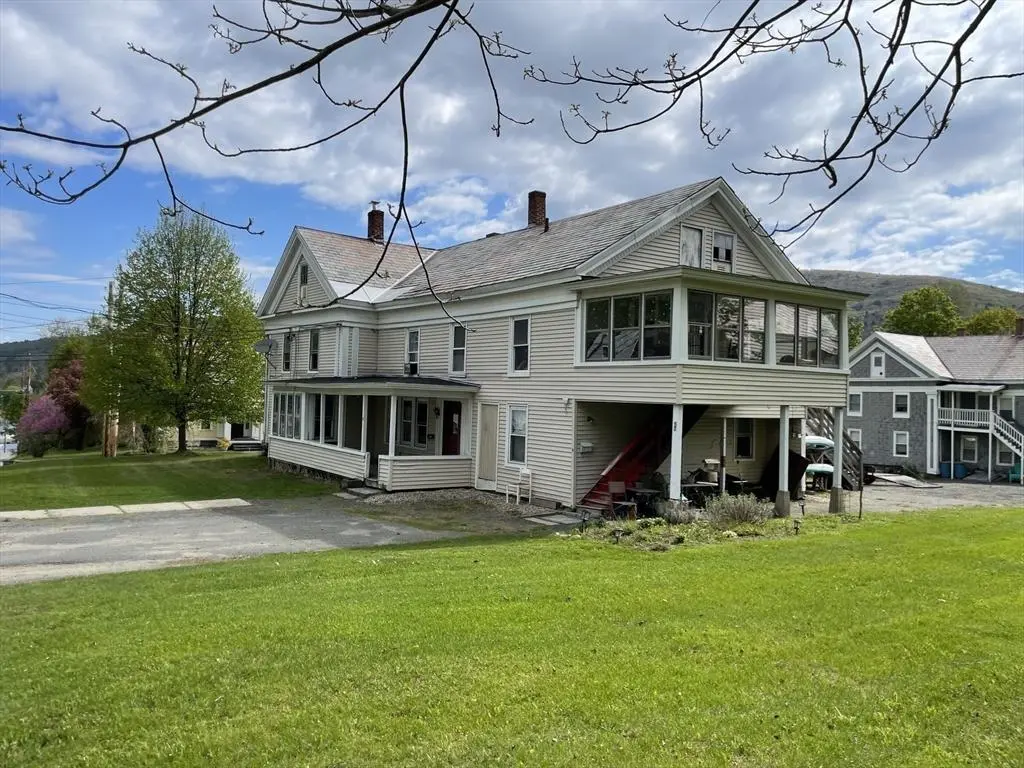
2 Franklin St · Buckland, MA
Flood risk 1/10 · Minimal
- FEMA flood zone
- X
- Chance of flooding over 30 yrs
- 0.0%
- Est. flood insurance / yr
- $473 – $860
Fire risk 1/10 · Minimal
- Est. fire insurance / yr
- $915 – $1,699
Heat risk 3/10 · Minor
- Hot days now (above 92°F)
- 8 days/yr
- Hot days in 30 yrs
- 18 days/yr
Wind risk 4/10 · Minor
- Chance of severe wind over 30 yrs
- 12.0%
Air-quality risk 2/10 · Minimal
- Unhealthy air days now
- 0 days/yr
- Unhealthy air days in 30 yrs
- 1 days/yr
Risk factors via First Street. Map © Google.
Why this score? — see what drove the A- grade
The composite is a weighted blend of 9 inputs, each scored 0–100. Each bar is that input's sub-score; the figure is the points it added to the 100-point composite (weight × sub-score).
- Cash flow +30.0/30.0
- ARV discount +15.0/15.0
- 1% rule +10.0/10.0
- DSCR +10.0/10.0
- Appreciation +7.5/10.0
- Schools +3.1/10.0
- Rent growth +2.5/5.0
- Livability +2.5/5.0
- Condition / age +2.5/5.0
$279,000
🖨 Deal sheet 📄 Offer letter ✓ Due diligence
Multi-family units
County records classify this as Multi-Family (2-4 Unit). Listing-text estimate: 3 units. confirmed
Listing remarks MLS
Investors take note. 3 unit multi-family located on the Buckland side of the village of Shelburne Falls. Easy walk to town. Fully rented, $2150 monthly income, separte utilities, garage nice yard. Handsome building being sold substantially less than assessed value.
Key facts
- 0.29 acre lot
- Garage
- Built 1870
Property features AI
Finance
- Other: Listing exclusions: 1 range and washer/dryer owned by tenant
- HOA & community: Community includes shopping, house of worship, private and public schools; Not a senior community
Exterior
- Parking: 1-car garage (covered); 5 additional open parking spaces; Total of 6 parking spaces; Off-street and common parking
- Utilities: Public water; Public sewer; Electric with circuit breakers; Individually metered electric; Electric range capability
- Home design: 3-family multifamily property; 4 total stories; Yellow exterior; Approximate year built (public records)
- Construction: Frame construction; Stone foundation; Shingle and slate roof; Lead paint: certified treated
- Exterior features: Porch (enclosed); Corner lot; Paved public road frontage; Publicly maintained road
Interior
- Kitchen: Range; Refrigerator
- Bedrooms: Multiple bedrooms across units (see unit layout)
- Flooring: Wood; Vinyl; Carpet; Varies by room
- Bathrooms: 3 full bathrooms
- Heating & cooling: Forced air; Oil heating; Baseboard heating; Property has heating
- Interior features: Ceiling fans; Pantry; Walk-in closets; Bathroom with tub and shower; Living room; Dining room; Kitchen; Total of 15 rooms
- Laundry & utility: Washer hookup; Electric dryer hookup
Neighborhood map
What this means for you Summary
Snapshot
- This is a 3 × 2-bed/1.0-bath units multifamily listed at $279k.
Deal economics
- At list price, monthly cash flow is $2k ($29k/yr) — positive. Per door: $810/mo.
- The deal already cash-flows at list — no discount required.
- Meets the 1% rule at list price ($6k rent vs $279k).
- Recommended offer: $271k (3.0% below list) — sets the bar for market timing.
Location & tenants
- Location reads: area grade A — affects rentability + tenant quality, not the cash-flow math above.
- Mohawk Trail (rural): math 25% / reading 45% proficiency, ranked #235 of 302 in MA (top 78%) — families likely to look elsewhere, expect single-tenant / working-renter base with shorter leases.
- Zoned schools: Mohawk Trail Regional School (math 22% / reading 42%, grade F, #255 of 343 statewide, top 77%, 271 students, 0% FRL) — zoned schools average 0% FRL vs 29% district-wide (29 pts lower); this property's tenant base skews higher-income than the district average.
- Market conditions: 4 active listings in the ZIP; 89 units permitted in Franklin County in 2024 (22 in 5+ unit buildings).
Forward outlook
- In year one you build about $16k of equity ($2k loan paydown + $14k appreciation (5.0% local appreciation)).
- Franklin County population projected at -20% by 2050 — secular population decline; favor cash flow + early exit over multi-decade hold.
- At projected returns (5.0% appreciation + 3.0% rent growth), your $78k cash investment doubles in ~2 years — after that, you're playing with house money.
- By year 3, paydown + projected appreciation supports a ~$40k cash-out refi (75% LTV) — recoverable capital for the next deal without selling this one.
Negotiation context
- It's been on market 38 days — a 3% lower offer ($271k) is reasonable based on typical stale-listing flexibility.
- 3 sale attempts since 17y ago; this cycle's ask has dropped $20k (7%) from the opening price — seller is motivated, your offer sets the floor, not the list.
- Current owner paid $140k; list at $279k implies a 99% gain — meaningful room to come down on a strong offer.
Risks & watch-outs
- Watch-outs: built in 1870 — expect roof / HVAC / electrical / plumbing capex.
Questions for the listing agent
- It's been on market 38 days. Have you received any prior offers? Is the seller open to a 3% concession, seller financing, or rate buy-down credit?
- Can we see the unit-by-unit rent roll, current vacancy, and any below-market leases? What's the average tenancy length?
- What capital expenditures (roof, boiler, parking lot, exteriors) have been made in the last 5 years, and what's planned in the next 2?
- Built in 1870 — when were the roof, HVAC, electrical panel, plumbing, and water heater last replaced?
- Is there a deadline driving the sale (1031 exchange, divorce, estate, relocation)? That informs how much negotiation room exists.
- What's the average days-on-market for RENTAL listings here right now (not sales)? A rising rental-DOM trend means longer vacancies and softer asking-rent achievability than the comps imply.
- What's the recent tenant-quality profile in this submarket — average credit score on applications, eviction rate, late-payment / NSF rate, and stable-employment percentage? A property-management company in the area should have these aggregated.
- How much new apartment / multifamily construction is in the pipeline within 1–3 miles? Heavy new supply (>2% of stock underway) typically softens rents 12–24 months out; light construction supports rent growth.
Investment metrics
- 1% rule
- 1.99% ✓
- Cap rate
- 16.74%
- Cash-on-cash
- 37.33%
- DSCR
- 2.66
- GRM
- 4.2
CMA / ARV
- ARV (median comp)
- $472,748
- List price
- $279,000
- Delta
- -40.98%
- Verdict
- UNDERPRICED
- Comps
- 6 within 1.0 mi
Show comp detail 1 sale within ~0.75 mi
| Address | Dist | Beds/Ba | Sqft | Sold | Price | $/sf | Match |
|---|---|---|---|---|---|---|---|
| 105 - 107 Bridge St | 0.39mi | 6/4.0 (-1) | 3,682 (+3%) | 5mo | $525,000 | $143 | 64 |
Match score weights: distance 35% · size 25% · config 20% · recency 20%. Top-matched comps best support the ARV.
Projected returns pro-forma
5.05% appreciation · 3.0% rent growth · sell at horizon
- IRR
- 46.0%
- Equity multiple
- 3.81×
- Total profit
- $219,899
- Equity at exit
- $158,885
- IRR
- 43.8%
- Equity multiple
- 7.80×
- Total profit
- $530,861
- Equity at exit
- $274,860
Cash invested: $78,120 (down + closing). Projections, not guarantees.
Landlord ↔ Tenant lean methodology
- Overall (STATE)
- 20 Strongly Tenant-Friendly
- State Massachusetts
- 20 Strongly Tenant-Friendly · D+15
- County
- — inherits STATE
- City
- — inherits STATE
ZIP-level market 01338
- Home prices YoY
- 2.3%
- Active inventory
- 4
- Price-to-rent
- 12.6×
Monthly cashflow live
- Estimated rent
- $5,550 medium interval (Pro) →
- Mortgage (P&I)
- −$1,463
- Tax from tax record
- −$375 /mo · $4,503/yr
- Insurance
- −$116
- HOA
- −$0
- Vacancy / Maint / Mgmt
- −$1,166
- Net cashflow
- $2,430
Break-even live
3-unit breakdown (identical units grouped — click to expand)
| Units | Beds | Baths | Est. rent |
|---|---|---|---|
| 3× units | 2 | 1 | $5,550 |
| #1 | 2 | 1 | $1,850 |
| #2 | 2 | 1 | $1,850 |
| #3 | 2 | 1 | $1,850 |
| Total (3 units) | $5,550 | ||
UW: 25.0% down · 7.5% · 30yr · 1.5% tax · 5.0% vac · 8.0% maint · 8.0% mgmt
Financing live
Cash to close
- Down payment
- $69,750
- Closing costs
- $8,370
- Reserves months
- —
- Total cash needed
- —
Loan-product check · same deal, 3 products live
Conventional
25% down · 7.5% · 30yr
- Down + closing
- —
- Monthly P&I
- —
- Monthly cashflow
- —
- DSCR
- —
- Eligible?
- —
Personal DTI + credit; lowest rate.
DSCR
20% down · 8.5% · 30yr
- Down + closing
- —
- Monthly P&I
- —
- Monthly cashflow
- —
- DSCR
- —
- Eligible?
- —
No personal income docs; deal must DSCR.
Hard money
10% down · 12.0% · 12mo
- Down + closing
- —
- Monthly P&I
- —
- Monthly cashflow
- —
- DSCR
- —
- Eligible?
- —
Short-term bridge; refi at stabilization.
Listing history 20 events
-
2026-06-18days on market $279,000 Active 38 DOM
-
2026-06-17days on market $279,000 Active 37 DOM
-
2026-06-16days on market $279,000 Active 36 DOM
-
2026-06-15days on market $279,000 Active 35 DOM
-
2026-06-14days on market $279,000 Active 33 DOM
-
2026-06-10days on market $279,000 Active 30 DOM
-
2026-06-09days on market $279,000 Active 29 DOM
-
2026-06-08days on market $279,000 Active 28 DOM
-
2026-06-07statusdays on market $279,000 Active 27 DOM
-
2026-06-03days on market $279,000 Price Changed 23 DOM
-
2026-06-02days on market $279,000 Price Changed 22 DOM
-
2026-06-01remarks 699-char remark
-
2026-06-01pricestatusdays on market $279,000 Price Changed 21 DOM
-
2026-05-31days on market $299,000 Active 20 DOM
-
2026-05-30statusdays on market $299,000 Active 19 DOM
-
2026-05-11$299,000 New 939-char remark
-
2009-05-12soldstatus $140,000 265-char remark
Show marketing remark (265 chars)
Investors take note. 3 unit multi-family located on the Buckland side of the village of Shelburne Falls. Easy walk to town. Fully rented, $2150 monthly income, separte utilities, garage nice yard. Handsome building being sold substantially less than assessed value.
-
2009-05-11soldstatus $140,000
-
2009-03-09$150,000 265-char remark
Show marketing remark (265 chars)
Investors take note. 3 unit multi-family located on the Buckland side of the village of Shelburne Falls. Easy walk to town. Fully rented, $2150 monthly income, separte utilities, garage nice yard. Handsome building being sold substantially less than assessed value.
-
2003-02-28soldstatus $171,000
ⓘ Source: listings_history table (triggers on properties + properties_extension) + one-shot
backfill from property_details.listing_events for pre-trigger history.
Tax reassessment forecast MA · Partial reset (capped growth)
- Current annual tax
- $4,503 · $375/mo
- Projected year-2 tax
- $4,503 · $375/mo
- Expected delta
- $0/yr ($0/mo · 0.0%)
ⓘ Screening estimate from a state-policy table — verify with the county assessor before closing.
Climate risk First Street
- Flood 1/10 Low FEMA zone X · 0% chance over 30 yrs
- Wildfire 1/10 Low
- Heat 3/10 Moderate 8 d/yr ≥92°F today · 18 d/yr by 30 yrs out
- Wind 4/10 Moderate 12% chance of damaging wind over 30 yrs
- Air quality 2/10 Low 0 unhealthy d/yr today · 1 by 30 yrs out
Nearby sold comps map
Loading sold comps map…
Walkable amenities ~0.75 mi
Loading nearby amenities…
Taxation est. · year 1
- Rental income
- $66,600
- − Mortgage interest
- −$15,628
- − Property taxes
- −$4,503
- − Insurance
- −$1,395
- − Repairs & maintenance
- −$5,328
- − Management
- −$5,328
- − Depreciation
- −$8,116
- Taxable income
- $26,301
- Est. tax owed @ 24.0%
- −$6,312
- After-tax cash flow
- $22,846/yr
For passive investors: Depreciation is non-cash, so a rental often shows a tax loss while cash-flowing — sheltering income. Rental losses are passive: they offset passive income freely, and up to $25,000/yr can offset ordinary (W-2) income if you actively participate and your MAGI is under $100k (phasing out to $0 by $150k); unused losses carry forward. On sale, claimed depreciation is recaptured at up to 25%, and gains may owe capital-gains tax (a 1031 exchange can defer both). Figures are a year-1 estimate at your 24.0% rate — not tax advice; consult a CPA.
Schools (NCES district)
- District
- Mohawk Trail
- NCES district ID
- 2507990
- Math proficiency
- 25% ▼ -15.00%
- Reading proficiency
- 45% ▼ -7.00%
- Median HH income
- $56,668
- Composite
- 30.91/100
- National rank
- #6114
- State rank
- #235 of 302 in MA
Livability — Buckland
No livability data for this city. (Only ~50 U.S. cities are tracked.)
Census & demographics
- Census place
- Shelburne Falls, MA
- Population (ZIP)
- 79
Population outlook (Franklin County) Hauer SSP2
- Today (2025)
- 68,566 people
- By 2030
- 66,543 · -3.0%
- By 2040
- 60,766 · -11.4%
- By 2050
- 54,971 · -19.8%
- By 2075
- 42,642 · -37.8%
- By 2100
- 31,861 · -53.5%
Race, ethnicity, and origin ACS 2023
- Neighborhood character
- Predominantly White (96%)
- Race & ethnicity
- White 96% Hispanic / Latino 4%
- Common ancestry
- Italian 33% Serbian 8% Lithuanian 6%
- Foreign-born
- 4% · Canada
- Languages at home
- 96% English-only · Spanish 4%
Political lean MEDSL · Franklin
- 2024 margin
- Solid D (+37.8) · D 67.3% · R 29.6% · Other 3.1%
- 2008→2024 swing
- -9.9pp toward R · 2008: 47.7pp · 2024: 37.8pp
- All cycles
- 2024: D+37.8 2020: D+44.4 2016: D+37.0 2012: D+47.0 2008: D+47.7
Not yet ingested
- Civics
- —
Market trends
- HPI YoY
- ▲ 5.05%
- Current HPI
- 226.4349
- Rent YoY
- —
- Metro
- —
- State GDP YoY
- ▲ 2.28%
- F500 in state
- 38
Industry mix (Fortune 500 HQ in MA)
| Industry | F500 HQs | Revenue |
|---|---|---|
| Technology | 3 | $17B |
|
||
| Insurance | 2 | $84B |
|
||
| Retail | 2 | $76B |
|
||
| Life Sciences | 1 | $43B |
|
||
| Energy Technology | 1 | $31B |
|
||
| Aerospace / Defense | 1 | $18B |
|
||
Price history
+63.2% since first listed8 events — show timeline
- 2026-06-01 Price Changed $279,000 MLS PIN
- 2026-05-26 Relisted — MLS PIN
- 2026-05-21 Contingent — MLS PIN
- 2026-05-11 Listed $299,000 MLS PIN
- 2009-05-12 Sold (MLS) $140,000 BCMLS
- 2009-05-11 Sold (Public Records) $140,000 Public Records
- 2009-03-09 Listed $150,000 BCMLS
- 2003-02-28 Sold (Public Records) $171,000 Public Records
Property tax history
+2.9%/yrLatest (2023): $4,503 · +1.0% YoY. Source: county tax records.
Cash-flow waterfall
monthlySold comps — $/sqft
last 12 mo · ≤1 miLoading sold comps…