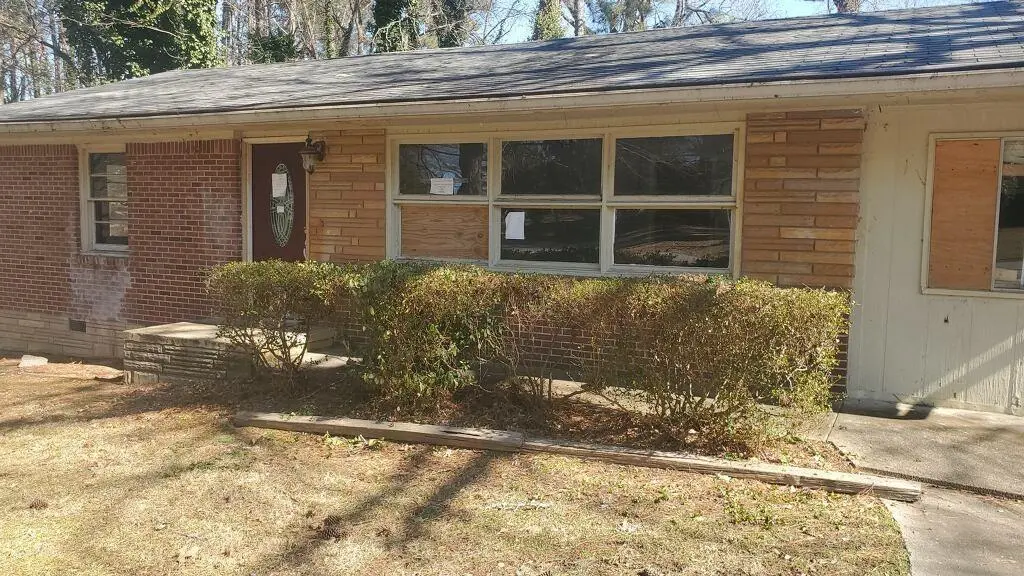
5177 White Blvd SW · Mableton, GA
Flood risk 4/10 · Minor
- FEMA flood zone
- X (unshaded)
- Chance of flooding over 30 yrs
- 0.24%
- Est. flood insurance / yr
- $507 – $1,088
Fire risk 2/10 · Minimal
- Est. fire insurance / yr
- $963 – $1,789
Heat risk 5/10 · Moderate
- Hot days now (above 103°F)
- 7 days/yr
- Hot days in 30 yrs
- 17 days/yr
Wind risk 5/10 · Moderate
- Chance of severe wind over 30 yrs
- 25.0%
Air-quality risk 4/10 · Minor
- Unhealthy air days now
- 4 days/yr
- Unhealthy air days in 30 yrs
- 5 days/yr
Risk factors via First Street. Map © Google.
Why this score? — see what drove the B+ grade
The composite is a weighted blend of 9 inputs, each scored 0–100. Each bar is that input's sub-score; the figure is the points it added to the 100-point composite (weight × sub-score).
- Cash flow +29.3/30.0
- ARV discount +15.0/15.0
- DSCR +10.0/10.0
- 1% rule +8.7/10.0
- Schools +3.8/10.0
- Livability +3.5/5.0
- Rent growth +3.4/5.0
- Condition / age +2.5/5.0
- Appreciation +0.0/10.0
$144,900
🖨 Deal sheet 📄 Offer letter ✓ Due diligence
Listing remarks MLS
Great opportunity for a ranch home in Clay Manor subdivision! Spacious living room with plenty of natural lighting! Large kitchen with stained cabinets! Den or bonus room off kitchen could also be used as a dining room and includes brick fireplace! Three spacious bedrooms and a full bathroom! Sliding doors off den lead to driveway with patio space! Fenced backyard! Don't miss out!
Key facts
- Ranch home
- Brick fireplace
- Large kitchen
Tags
Neighborhood map
What this means for you Summary
Snapshot
- This is a 3-bed/1.0-bath single-family listed at $145k.
Deal economics
- At list price, monthly cash flow is $509 ($6k/yr) — positive.
- The deal already cash-flows at list — no discount required.
- Meets the 1% rule at list price ($2k rent vs $145k).
- Recommended offer: $141k (3.0% below list) — sets the bar for market timing.
- Cap rate 10.5% vs local median 4.0% in Mableton — top-decile yield for the area; either an underpriced asset or a hidden risk that comps aren't pricing in. Stress-test before assuming the spread holds.
Location & tenants
- Location reads 70/100 on livability (#94 in GA) — a middle-class / working-renter tenant base. Strengths: housing A+, cost of living A-, crime B+; Watch: schools F, amenities F, commute D-.
- Cobb County (suburban): math 39% / reading 45% proficiency, ranked #25 of 174 in GA (top 14%) — families likely to look elsewhere, expect single-tenant / working-renter base with shorter leases.
- Market conditions: Rents rising (+3.7%/yr); 398 active listings in the ZIP; 17 comparable units currently listed for rent nearby; rentals at typical pace (median 25d on market — plan ~3-4 weeks tenant-placement turnaround); solid renter incomes; 1,625 units permitted in Cobb County in 2024 (389 in 5+ unit buildings).
Forward outlook
- Local home prices are declining (-3.0%/yr); year-one equity from $1k of loan paydown is wiped out by about $4k of value loss. Plan a longer hold.
- Cobb County population projected at +33% by 2050 — long-run rental-demand tailwind backs the buy-and-hold thesis.
- At projected returns (-3.0% appreciation + 3.7% rent growth), your $41k cash investment doubles in ~8 years — after that, you're playing with house money.
Negotiation context
- It's been on market 56 days — a 3% lower offer ($141k) is reasonable based on typical stale-listing flexibility.
- 7 sale attempts since 20y ago with the ask held roughly flat each time — persistent listings suggest the price (not the market) is what's stuck; bring a comps-based counter.
- Current owner paid $110k; 32% above their basis — modest negotiation headroom, anchor on the comps not their cost.
Risks & watch-outs
- Watch-outs: built in 1957 — expect roof / HVAC / electrical / plumbing capex.
- Climate carrying-cost: moderate wind risk, 25% chance of damaging wind over 30y; extreme-heat days projected 7→17/yr by 2055 (HVAC capex compounding) — expect insurance premiums to compound above CPI over the hold.
Questions for the listing agent
- It's been on market 56 days. Have you received any prior offers? Is the seller open to a 3% concession, seller financing, or rate buy-down credit?
- Built in 1957 — when were the roof, HVAC, electrical panel, plumbing, and water heater last replaced?
- Is there a deadline driving the sale (1031 exchange, divorce, estate, relocation)? That informs how much negotiation room exists.
- Schools are F-rated, which usually means shorter tenancies and higher turnover. Who's the typical renter profile here, and what's been the actual vacancy rate?
- What's the average days-on-market for RENTAL listings here right now (not sales)? A rising rental-DOM trend means longer vacancies and softer asking-rent achievability than the comps imply.
- What's the recent tenant-quality profile in this submarket — average credit score on applications, eviction rate, late-payment / NSF rate, and stable-employment percentage? A property-management company in the area should have these aggregated.
- How much new for-sale + rental construction is in the pipeline within 1–3 miles? Heavy new supply typically softens prices + rents 12–24 months out; constrained supply supports both.
Investment metrics
- 1% rule
- 1.37% ✓
- Cap rate
- 10.50%
- Cash-on-cash
- 15.04%
- DSCR
- 1.67
- GRM
- 6.1
CMA / ARV
- ARV (median comp)
- $266,872
- List price
- $144,900
- Delta
- -45.70%
- Verdict
- UNDERPRICED
- Comps
- 20 within 1.0 mi
Show comp detail 12 sales within ~0.75 mi
| Address | Dist | Beds/Ba | Sqft | Sold | Price | $/sf | Match |
|---|---|---|---|---|---|---|---|
| 5177 White Blvd SW | 0.00mi | 3/1.0 | 1,169 (0%) | 0mo | $138,600 | $119 | 100 |
| 1091 Luther Dr SW | 0.35mi | 3/1.0 | 1,125 (-4%) | 11mo | $225,000 | $200 | 68 |
| 1180 Deborah Dr SW | 0.44mi | 3/2.0 | 1,248 (+7%) | 5mo | $304,000 | $244 | 60 |
| 1093 Grace St SW | 0.40mi | 3/1.0 | 1,075 (-8%) | 10mo | $215,000 | $200 | 59 |
| 640 Monticello Dr SW | 0.49mi | 3/1.5 | 1,075 (-8%) | 4mo | $275,000 | $256 | 58 |
| 4973 White Blvd | 0.41mi | 3/2.0 | 1,032 (-12%) | 1mo | $268,000 | $260 | 57 |
| 4925 Sugar Valley Rd SW | 0.42mi | 3/1.5 | 1,050 (-10%) | 8mo | $271,000 | $258 | 55 |
| 968 Woodward Cir SW | 0.57mi | 3/1.5 | 1,050 (-10%) | 2mo | $245,000 | $233 | 53 |
| 1180 Center St SW | 0.53mi | 3/1.0 | 1,000 (-14%) | 1mo | $224,500 | $225 | 51 |
| 4905 Sweet Valley Rd SW | 0.46mi | 3/2.0 | 1,050 (-10%) | 11mo | $325,000 | $310 | 49 |
| 581 Maran Ln | 0.58mi | 3/2.0 | 1,000 (-14%) | 2mo | $250,000 | $250 | 44 |
| 510 Pineland Rd SW | 0.72mi | 3/2.0 | 1,251 (+7%) | 11mo | $285,000 | $228 | 42 |
Match score weights: distance 35% · size 25% · config 20% · recency 20%. Top-matched comps best support the ARV.
Projected returns pro-forma
-3.0% appreciation · 3.66% rent growth · sell at horizon
- IRR
- 6.5%
- Equity multiple
- 1.25×
- Total profit
- $10,298
- Equity at exit
- $21,605
- IRR
- 16.4%
- Equity multiple
- 2.39×
- Total profit
- $56,446
- Equity at exit
- $12,528
Cash invested: $40,572 (down + closing). Projections, not guarantees.
Landlord ↔ Tenant lean methodology
- Overall (STATE)
- 90 Strongly Landlord-Friendly
- State Georgia
- 90 Strongly Landlord-Friendly · R+3
- County
- — inherits STATE
- City
- — inherits STATE
ZIP-level market 30126
- Rents YoY
- 3.7%
- Active inventory
- 398
- Price-to-rent
- 6.1×
Monthly cashflow live
- Estimated rent
- $1,983 high interval (Pro) →
- Mortgage (P&I)
- −$760
- Tax from tax record
- −$238 /mo · $2,851/yr
- Insurance
- −$60
- HOA
- −$0
- Vacancy / Maint / Mgmt
- −$416
- Net cashflow
- $509
Break-even live
UW: 25.0% down · 7.5% · 30yr · 1.5% tax · 5.0% vac · 8.0% maint · 8.0% mgmt
Financing live
Cash to close
- Down payment
- $36,225
- Closing costs
- $4,347
- Reserves months
- —
- Total cash needed
- —
Loan-product check · same deal, 3 products live
Conventional
25% down · 7.5% · 30yr
- Down + closing
- —
- Monthly P&I
- —
- Monthly cashflow
- —
- DSCR
- —
- Eligible?
- —
Personal DTI + credit; lowest rate.
DSCR
20% down · 8.5% · 30yr
- Down + closing
- —
- Monthly P&I
- —
- Monthly cashflow
- —
- DSCR
- —
- Eligible?
- —
No personal income docs; deal must DSCR.
Hard money
10% down · 12.0% · 12mo
- Down + closing
- —
- Monthly P&I
- —
- Monthly cashflow
- —
- DSCR
- —
- Eligible?
- —
Short-term bridge; refi at stabilization.
Rent comps 17 comps
| Address | Beds | Baths | Sqft | Rent | $/sqft | DOM | Units | Dist |
|---|---|---|---|---|---|---|---|---|
| 5205 Silhouette Ln SW Mableton, GA | 3.0 | 2.0 | 1200 | $1,825 | $1.52 | 44d | 1 | 0.10mi |
| 785 Joseph Club Dr SW Mableton, GA | 2.0 | 2.5 | 1200 | $1,800 | $1.50 | 10d | 1 | 0.30mi |
| 875 Joseph Club Dr SW Mableton, GA | 3.0 | 2.5 | 1332 | $1,890 | $1.42 | 44d | 1 | 0.37mi |
| 770 Nickajack Rd SW Mableton, GA | 1.0–3.0 | 1.0–2.0 | 939 | $2,275 | $2.42 | 1d | 14 | 0.44mi |
| 5362 Montezuma Dr SW Mableton, GA | 3.0 | 2.0 | 1286 | $1,995 | $1.55 | 22d | 1 | 0.49mi |
| 580 Pineland Cir SW Mableton, GA | 3.0 | 2.0 | 1373 | $2,100 | $1.53 | 24d | 1 | 0.60mi |
| 1138 Gerald Pl SW Unit B Mableton, GA | 2.0 | 1.0 | 1318 | $1,495 | $1.13 | 5d | 1 | 0.69mi |
| 1204 Veterans Memorial Hwy SW Mableton, GA | 1.0–2.0 | 1.0 | 960 | $1,266 | $1.32 | 22d | 2 | 0.89mi |
| 362 Pine Valley Rd SW Mableton, GA | 3.0 | 1.0 | 1458 | $2,161 | $1.48 | 5d | 1 | 1.01mi |
| 586 Ridge Ave SW Mableton, GA | 3.0 | 2.0 | 1340 | $1,925 | $1.44 | 24d | 1 | 1.05mi |
| 5750 Old Gordon Rd Mableton, GA | 2.0 | 1.5 | 1165 | $3,200 | $2.75 | 44d | 1 | 1.14mi |
| 4578 Oakland Ter SW Mableton, GA | 3.0 | 2.0 | 1425 | $1,800 | $1.26 | 19d | 1 | 1.15mi |
| 3509 Cardinal Dr SW Mableton, GA | 3.0 | 2.5 | 1421 | $1,829 | $1.29 | 44d | 1 | 1.16mi |
| 5575 Burrus Rd Austell, GA | 3.0 | 2.0 | 1301 | $1,500 | $1.15 | 13d | 1 | 1.18mi |
| 811 Old Powder Springs Rd SW Mableton, GA | 2.0 | 1.0 | 1100 | $3,400 | $3.09 | 44d | 1 | 1.25mi |
| 56 Charlotte Dr SW Mableton, GA | 3.0 | 1.5 | 1100 | $1,800 | $1.64 | 44d | 1 | 1.45mi |
| 1707 Virginia Cir SW Mableton, GA | 3.0 | 2.0 | 1235 | $1,835 | $1.49 | 24d | 1 | 1.46mi |
Listing history 16 events
-
2026-04-26status Active 383-char remark
Show marketing remark (383 chars)
Great opportunity for a ranch home in Clay Manor subdivision! Spacious living room with plenty of natural lighting! Large kitchen with stained cabinets! Den or bonus room off kitchen could also be used as a dining room and includes brick fireplace! Three spacious bedrooms and a full bathroom! Sliding doors off den lead to driveway with patio space! Fenced backyard! Don't miss out!
-
2026-04-26status Back On Market 383-char remark
Show marketing remark (383 chars)
Great opportunity for a ranch home in Clay Manor subdivision! Spacious living room with plenty of natural lighting! Large kitchen with stained cabinets! Den or bonus room off kitchen could also be used as a dining room and includes brick fireplace! Three spacious bedrooms and a full bathroom! Sliding doors off den lead to driveway with patio space! Fenced backyard! Don't miss out!
-
2026-03-13status Under Contract 383-char remark
Show marketing remark (383 chars)
Great opportunity for a ranch home in Clay Manor subdivision! Spacious living room with plenty of natural lighting! Large kitchen with stained cabinets! Den or bonus room off kitchen could also be used as a dining room and includes brick fireplace! Three spacious bedrooms and a full bathroom! Sliding doors off den lead to driveway with patio space! Fenced backyard! Don't miss out!
-
2026-03-13status Pending 383-char remark
Show marketing remark (383 chars)
Great opportunity for a ranch home in Clay Manor subdivision! Spacious living room with plenty of natural lighting! Large kitchen with stained cabinets! Den or bonus room off kitchen could also be used as a dining room and includes brick fireplace! Three spacious bedrooms and a full bathroom! Sliding doors off den lead to driveway with patio space! Fenced backyard! Don't miss out!
-
2026-02-10$144,900 New 383-char remark
Show marketing remark (383 chars)
Great opportunity for a ranch home in Clay Manor subdivision! Spacious living room with plenty of natural lighting! Large kitchen with stained cabinets! Den or bonus room off kitchen could also be used as a dining room and includes brick fireplace! Three spacious bedrooms and a full bathroom! Sliding doors off den lead to driveway with patio space! Fenced backyard! Don't miss out!
-
2026-02-10$144,900 Active 383-char remark
Show marketing remark (383 chars)
Great opportunity for a ranch home in Clay Manor subdivision! Spacious living room with plenty of natural lighting! Large kitchen with stained cabinets! Den or bonus room off kitchen could also be used as a dining room and includes brick fireplace! Three spacious bedrooms and a full bathroom! Sliding doors off den lead to driveway with patio space! Fenced backyard! Don't miss out!
-
2024-07-02status Active
-
2024-07-02historical
-
2024-06-01status Pending
-
2024-05-30$184,578 Active
-
2007-03-30soldstatus $110,000
-
2007-02-27soldstatus $110,000
-
2006-11-11$109,900
-
2006-11-10soldstatus $80,400
-
1984-04-01soldstatus $26,000
-
1977-04-01soldstatus $26,000
ⓘ Source: listings_history table (triggers on properties + properties_extension) + one-shot
backfill from property_details.listing_events for pre-trigger history.
Tax reassessment forecast GA · Resets to sale price
- Current annual tax
- $2,851 · $238/mo
- Projected year-2 tax
- $2,851 · $238/mo
- Expected delta
- $0/yr ($0/mo · 0.0%)
ⓘ Screening estimate from a state-policy table — verify with the county assessor before closing.
Climate risk First Street
- Flood 4/10 Moderate FEMA zone X (unshaded) · 24% chance over 30 yrs
- Wildfire 2/10 Low
- Heat 5/10 Major 7 d/yr ≥103°F today · 17 d/yr by 30 yrs out
- Wind 5/10 Major 25% chance of damaging wind over 30 yrs
- Air quality 4/10 Moderate 4 unhealthy d/yr today · 5 by 30 yrs out
Nearby sold comps map
Loading sold comps map…
Walkable amenities ~0.75 mi
Loading nearby amenities…
Taxation est. · year 1
- Rental income
- $23,792
- − Mortgage interest
- −$8,117
- − Property taxes
- −$2,851
- − Insurance
- −$724
- − Repairs & maintenance
- −$1,903
- − Management
- −$1,903
- − Depreciation
- −$4,215
- Taxable income
- $4,078
- Est. tax owed @ 24.0%
- −$979
- After-tax cash flow
- $5,123/yr
For passive investors: Depreciation is non-cash, so a rental often shows a tax loss while cash-flowing — sheltering income. Rental losses are passive: they offset passive income freely, and up to $25,000/yr can offset ordinary (W-2) income if you actively participate and your MAGI is under $100k (phasing out to $0 by $150k); unused losses carry forward. On sale, claimed depreciation is recaptured at up to 25%, and gains may owe capital-gains tax (a 1031 exchange can defer both). Figures are a year-1 estimate at your 24.0% rate — not tax advice; consult a CPA.
Schools (NCES district)
- District
- Cobb County
- NCES district ID
- 1301290
- Math proficiency
- 39% ▼ -15.00%
- Reading proficiency
- 45% ▼ -10.00%
- Median HH income
- $68,845
- Composite
- 37.93/100
- National rank
- #4308
- State rank
- #25 of 174 in GA
Livability — Mableton
- Score
- 70/100
- State rank
- #94
- US rank
- #7534
Category grades
Schools grade is shown separately in the Schools card above.
Census & demographics
- Census place
- Mableton, GA
- County
- Cobb County · 777,758 people
- City population
- 41,829
- Metro
- Atlanta-Sandy Springs-Alpharetta, GA
- Population (ZIP)
- 41,829
- Household income
- $101,891
- Rent vs Own
- Severe rent burden
- 1046.0
Population outlook (Cobb County) Hauer SSP2
- Today (2025)
- 868,385 people
- By 2030
- 929,614 · +7.1%
- By 2040
- 1,047,533 · +20.6%
- By 2050
- 1,155,537 · +33.1%
- By 2075
- 1,405,030 · +61.8%
- By 2100
- 1,555,058 · +79.1%
Race, ethnicity, and origin ACS 2023
- Neighborhood character
- Diverse neighborhood (Simpson 0.69)
- Race & ethnicity
- Black 42% White 30% Hispanic / Latino 20% Two or more races 8% Asian 4% Native American 1%
- Hispanic origin (detail)
- Mexican 11% Cuban 1%
- Common ancestry
- Slovak 1% Italian 1% Lithuanian 1%
- Foreign-born
- 16% · Canada, China
- Languages at home
- 77% English-only · Spanish 17% Other Indo-European 3% French/Haitian/Cajun 1%
Political lean MEDSL · Cobb
- 2024 margin
- D (+14.9) · D 56.9% · R 42.0% · Other 1.1%
- 2008→2024 swing
- +24.3pp toward D · 2008: -9.4pp · 2024: 14.9pp
- All cycles
- 2024: D+14.9 2020: D+14.3 2016: D+2.1 2012: R+12.6 2008: R+9.4
Not yet ingested
- Civics
- —
Market trends
- HPI YoY
- ▼ -239.35%
- Current HPI
- 230.378
- Rent YoY
- ▲ 3.66%
- Metro
- Atlanta-Sandy Springs-Alpharetta, GA
- State GDP YoY
- ▲ 2.66%
- F500 in state
- 28
Industry mix (Fortune 500 HQ in GA)
| Industry | F500 HQs | Revenue |
|---|---|---|
| Paper / Packaging | 2 | $29B |
|
||
| Retail | 1 | $160B |
|
||
| Transportation / Logistics | 1 | $91B |
|
||
| Airlines | 1 | $62B |
|
||
| Consumer Goods | 1 | $47B |
|
||
| Utilities | 1 | $25B |
|
||
Price history
+457.3% since first listed16 events — show timeline
- 2026-04-26 Relisted — FMLS
- 2026-04-26 Relisted — GAMLS
- 2026-03-13 Pending — GAMLS
- 2026-03-13 Pending — FMLS
- 2026-02-10 Listed $144,900 FMLS
- 2026-02-10 Listed $144,900 GAMLS
- 2024-07-02 Relisted — FMLS
- 2024-07-02 Listing Removed — FMLS
- 2024-06-01 Pending — FMLS
- 2024-05-30 Listed $184,578 FMLS
- 2007-03-30 Sold (Public Records) $110,000 Public Records
- 2007-02-27 Sold (MLS) $110,000 FMLS
- 2006-11-11 Listed $109,900 FMLS
- 2006-11-10 Sold (Public Records) $80,400 Public Records
- 1984-04-01 Sold (Public Records) $26,000 Public Records
- 1977-04-01 Sold (Public Records) $26,000 Public Records
Property tax history
+8.4%/yrLatest (2025): $2,851 · +33.5% YoY. Source: county tax records.
Cash-flow waterfall
monthlySold comps — $/sqft
last 12 mo · ≤1 miLoading sold comps…