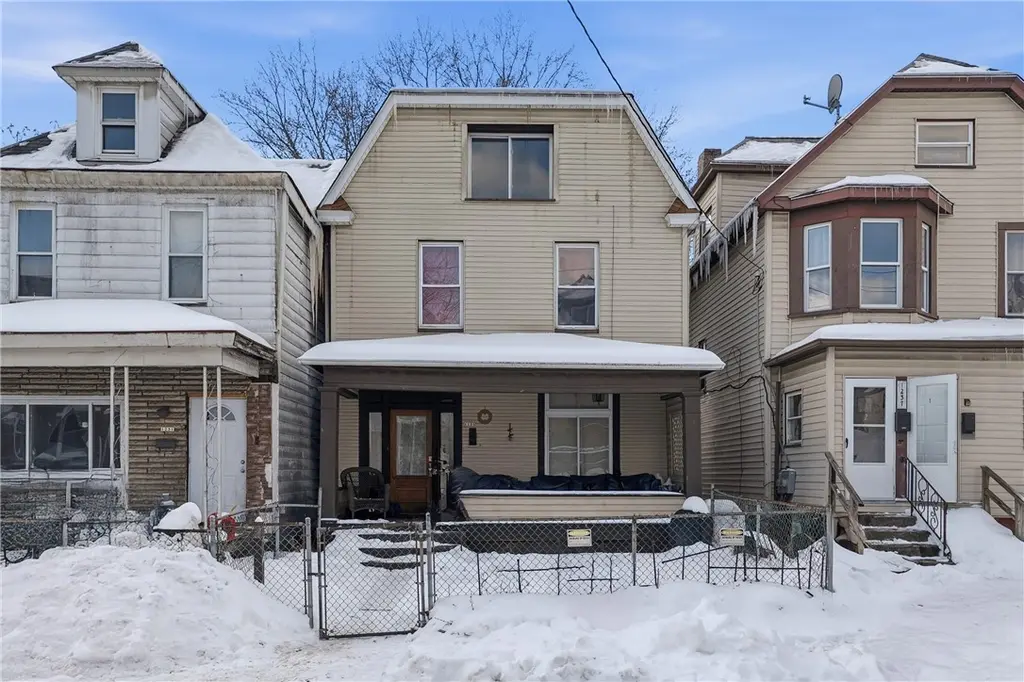
1233 Kenneth Ave · New Kensington, PA
Flood risk 1/10 · Minimal
- FEMA flood zone
- X (unshaded)
- Chance of flooding over 30 yrs
- 0.0%
- Est. flood insurance / yr
- $507 – $1,088
Fire risk 1/10 · Minimal
- Est. fire insurance / yr
- $511 – $949
Heat risk 4/10 · Minor
- Hot days now (above 97°F)
- 7 days/yr
- Hot days in 30 yrs
- 19 days/yr
Wind risk 2/10 · Minimal
- Chance of severe wind over 30 yrs
- 0.0%
Air-quality risk 4/10 · Minor
- Unhealthy air days now
- 5 days/yr
- Unhealthy air days in 30 yrs
- 6 days/yr
Risk factors via First Street. Map © Google.
Why this score? — see what drove the B grade
The composite is a weighted blend of 9 inputs, each scored 0–100. Each bar is that input's sub-score; the figure is the points it added to the 100-point composite (weight × sub-score).
- Cash flow +30.0/30.0
- ARV discount +11.0/15.0
- 1% rule +10.0/10.0
- DSCR +10.0/10.0
- Livability +3.5/5.0
- Rent growth +3.0/5.0
- Condition / age +2.5/5.0
- Schools +1.9/10.0
- Appreciation +0.0/10.0
$94,000
🖨 Deal sheet (PDF) 📄 Offer letter ✓ Due diligence
Listing remarks MLS
Welcome to 1233 Kenneth Ave. This single-family residence is perfect for any investor wanting to add to their portfolio or any first-time home buyer looking to purchase. This home has ample space to live, with a total of 5 bedrooms and 1 bath! Plenty of space to relax on the front porch, and nice size yard for summer time fun. Currently rented with good tenants that would love to stay if you're looking for a good investment this year.
Key facts
- 3,118 sq ft lot
- 2 parking spots
- Built 1930
Neighborhood map
What this means for you Summary
Snapshot
- This is a 5-bed/1.0-bath other listed at $94k.
Deal economics
- At list price, monthly cash flow is $822 ($10k/yr) — positive.
- The deal already cash-flows at list — no discount required.
- Meets the 1% rule at list price ($2k rent vs $94k).
- Recommended offer: $83k (12.0% below list) — sets the bar for market timing.
- Cap rate 16.8% vs local median 7.2% in New Kensington — top-decile yield for the area; either an underpriced asset or a hidden risk that comps aren't pricing in. Stress-test before assuming the spread holds.
Location & tenants
- Location reads 69/100 on livability (#840 in PA) — a middle-class / working-renter tenant base. Strengths: cost of living A+, housing A+; Watch: schools C-, employment D, crime F.
- New Kensington-Arnold SD (suburban): math 16% / reading 31% proficiency, ranked #483 of 539 in PA (top 90%) — low school quality limits family demand, transient renter base, plan for 1-2y turnover.
- Market conditions: Rents rising (+1.9%/yr); 167 active listings in the ZIP; 3 comparable units currently listed for rent nearby; rentals leasing fast (median 2d on market — plan ~1-2 weeks tenant-placement turnaround); 415 units permitted in Westmoreland County in 2024 (10 in 5+ unit buildings).
- This rent runs 35% of the median local income ($63k/yr) — at the standard rent-burdened threshold; future hikes will face affordability resistance.
Forward outlook
- Local home prices are declining (-3.0%/yr); year-one equity from $650 of loan paydown is wiped out by about $3k of value loss. Plan a longer hold.
- Westmoreland County population projected at -19% by 2050 — secular population decline; favor cash flow + early exit over multi-decade hold.
- At projected returns (-3.0% appreciation + 1.9% rent growth), your $26k cash investment doubles in ~4 years — after that, you're playing with house money.
Negotiation context
- It's been on market 125 days — a 12% lower offer ($83k) is reasonable based on typical stale-listing flexibility.
- 2 sale attempts with the ask held roughly flat each time — persistent listings suggest the price (not the market) is what's stuck; bring a comps-based counter.
- Current owner paid $22k; list at $94k implies a 327% gain — meaningful room to come down on a strong offer.
Risks & watch-outs
- Watch-outs: built in 1930 — expect roof / HVAC / electrical / plumbing capex.
Questions for the listing agent
- It's been on market 125 days. Have you received any prior offers? Is the seller open to a 12% concession, seller financing, or rate buy-down credit?
- Built in 1930 — when were the roof, HVAC, electrical panel, plumbing, and water heater last replaced?
- Why hasn't it sold? Are there any deal-killer items the seller is aware of (foundation, flood, title, zoning, code violations)?
- Is there a deadline driving the sale (1031 exchange, divorce, estate, relocation)? That informs how much negotiation room exists.
- Crime grade is F in this area — have there been break-ins, vandalism, or insurance claims at this property in the last 3 years? What carrier currently insures it and at what premium?
- What's the average days-on-market for RENTAL listings here right now (not sales)? A rising rental-DOM trend means longer vacancies and softer asking-rent achievability than the comps imply.
- What's the recent tenant-quality profile in this submarket — average credit score on applications, eviction rate, late-payment / NSF rate, and stable-employment percentage? A property-management company in the area should have these aggregated.
- How much new for-sale + rental construction is in the pipeline within 1–3 miles? Heavy new supply typically softens prices + rents 12–24 months out; constrained supply supports both.
Investment metrics
- 1% rule
- 1.97% ✓
- Cap rate
- 16.78%
- Cash-on-cash
- 37.46%
- DSCR
- 2.67
- GRM
- 4.2
CMA / ARV
- ARV (median comp)
- $101,855
- List price
- $94,000
- Delta
- -7.71%
- Verdict
- FAIR
- Comps
- 19 within 1.0 mi
Projected returns pro-forma
-3.0% appreciation · 1.9% rent growth · sell at horizon
- IRR
- 32.2%
- Equity multiple
- 2.33×
- Total profit
- $35,089
- Equity at exit
- $14,016
- IRR
- 38.6%
- Equity multiple
- 4.42×
- Total profit
- $89,896
- Equity at exit
- $8,127
Cash invested: $26,320 (down + closing). Projections, not guarantees.
Landlord ↔ Tenant lean methodology
- Overall (STATE)
- 62 Landlord-Friendly
- State Pennsylvania
- 62 Landlord-Friendly · EVEN
- County
- — inherits STATE
- City
- — inherits STATE
ZIP-level market 15068
- Home prices YoY
- -12.2%
- Rents YoY
- 1.9%
- Active inventory
- 167
- Price-to-rent
- 4.2×
Monthly cashflow live
- Estimated rent
- $1,847 medium interval (Pro) →
- Mortgage (P&I)
- −$493
- Tax from tax record
- −$106 /mo · $1,267/yr
- Insurance
- −$39
- HOA
- −$0
- Vacancy / Maint / Mgmt
- −$388
- Net cashflow
- $822
Break-even live
Sensitivity live
| Price | -10% $875 | -5% $848 | +0% $822 | +5% $795 | +10% $768 |
|---|---|---|---|---|---|
| Rent | -10% $676 | -5% $749 | +0% $822 | +5% $894 | +10% $967 |
| Rate | -1.0pp $869 | -0.5pp $845 | base $822 | +0.5pp $797 | +1.0pp $772 |
UW: 25.0% down · 7.5% · 30yr · 1.5% tax · 5.0% vac · 8.0% maint · 8.0% mgmt
Financing live
Cash to close
- Down payment
- $23,500
- Closing costs
- $2,820
- Reserves months
- —
- Total cash needed
- —
Loan-product check · same deal, 3 products live
Conventional
25% down · 7.5% · 30yr
- Down + closing
- —
- Monthly P&I
- —
- Monthly cashflow
- —
- DSCR
- —
- Eligible?
- —
Personal DTI + credit; lowest rate.
DSCR
20% down · 8.5% · 30yr
- Down + closing
- —
- Monthly P&I
- —
- Monthly cashflow
- —
- DSCR
- —
- Eligible?
- —
No personal income docs; deal must DSCR.
Hard money
10% down · 12.0% · 12mo
- Down + closing
- —
- Monthly P&I
- —
- Monthly cashflow
- —
- DSCR
- —
- Eligible?
- —
Short-term bridge; refi at stabilization.
Rent comps 3 comps
| Address | Beds | Baths | Sqft | Rent | $/sqft | DOM | Units | Dist |
|---|---|---|---|---|---|---|---|---|
| 826 North St New Kensington, PA | 4.0 | 1.5 | 1250 | $1,495 | $1.20 | 2d | 1 | 0.42mi |
| 1922 Kenneth Ave New Kensington, PA | 5.0 | 2.0 | 1800 | $2,150 | $1.19 | 8d | 1 | 0.67mi |
| 1922 Kenneth Ave New Kensington, PA | 5.0 | 2.0 | 1800 | $2,100 | $1.17 | 2d | 1 | 0.67mi |
Listing history 19 events
-
2026-06-18days on market $94,000 Active 125 DOM
-
2026-06-17days on market $94,000 Active 124 DOM
-
2026-06-16days on market $94,000 Active 123 DOM
-
2026-06-15days on market $94,000 Active 122 DOM
-
2026-06-13days on market $94,000 Active 120 DOM
-
2026-06-09days on market $94,000 Active 116 DOM
-
2026-06-08days on market $94,000 Active 115 DOM
-
2026-06-07days on market $94,000 Active 114 DOM
-
2026-06-05days on market $94,000 Active 111 DOM
-
2026-06-03days on market $94,000 Active 110 DOM
-
2026-06-02days on market $94,000 Active 109 DOM
-
2026-06-01days on market $94,000 Active 108 DOM
-
2026-05-31days on market $94,000 Active 107 DOM
-
2026-02-11$94,000 Active 438-char remark
Show marketing remark (438 chars)
Welcome to 1233 Kenneth Ave. This single-family residence is perfect for any investor wanting to add to their portfolio or any first-time home buyer looking to purchase. This home has ample space to live, with a total of 5 bedrooms and 1 bath! Plenty of space to relax on the front porch, and nice size yard for summer time fun. Currently rented with good tenants that would love to stay if you're looking for a good investment this year.
-
2025-05-08price $94,000 443-char remark
Show marketing remark (443 chars)
Welcome to 1233 Kenneth Ave. This single-family residence is perfect for any investor wanting to add to their portfolio or any first-time home buyer looking to purchase. This home has ample space to live, with a total of 5 bedrooms and 1 bath! Plenty of space to relax on the front porch, and nice size yard for summertime fun. It is currently rented with good tenants who would love to stay if you are looking for a good investment this year.
-
2025-04-07price $99,000 443-char remark
Show marketing remark (443 chars)
Welcome to 1233 Kenneth Ave. This single-family residence is perfect for any investor wanting to add to their portfolio or any first-time home buyer looking to purchase. This home has ample space to live, with a total of 5 bedrooms and 1 bath! Plenty of space to relax on the front porch, and nice size yard for summertime fun. It is currently rented with good tenants who would love to stay if you are looking for a good investment this year.
-
2025-03-08price $100,000 443-char remark
Show marketing remark (443 chars)
Welcome to 1233 Kenneth Ave. This single-family residence is perfect for any investor wanting to add to their portfolio or any first-time home buyer looking to purchase. This home has ample space to live, with a total of 5 bedrooms and 1 bath! Plenty of space to relax on the front porch, and nice size yard for summertime fun. It is currently rented with good tenants who would love to stay if you are looking for a good investment this year.
-
2025-02-07$105,000 Active 443-char remark
Show marketing remark (443 chars)
Welcome to 1233 Kenneth Ave. This single-family residence is perfect for any investor wanting to add to their portfolio or any first-time home buyer looking to purchase. This home has ample space to live, with a total of 5 bedrooms and 1 bath! Plenty of space to relax on the front porch, and nice size yard for summertime fun. It is currently rented with good tenants who would love to stay if you are looking for a good investment this year.
-
2001-03-01soldstatus $22,000
ⓘ Source: listings_history table (triggers on properties + properties_extension) + one-shot
backfill from property_details.listing_events for pre-trigger history.
Tax reassessment forecast PA · Partial reset (capped growth)
- Current annual tax
- $1,267 · $106/mo
- Projected year-2 tax
- $1,376 · $115/mo
- Expected delta
- +$109/yr (+$9/mo · 8.6%)
ⓘ Screening estimate from a state-policy table — verify with the county assessor before closing.
Climate risk First Street
- Flood 1/10 Low FEMA zone X (unshaded) · 0% chance over 30 yrs
- Wildfire 1/10 Low
- Heat 4/10 Moderate 7 d/yr ≥97°F today · 19 d/yr by 30 yrs out
- Wind 2/10 Low 0% chance of damaging wind over 30 yrs
- Air quality 4/10 Moderate 5 unhealthy d/yr today · 6 by 30 yrs out
Nearby sold comps map
Loading sold comps map…
Walkable amenities ~0.75 mi
Loading nearby amenities…
Taxation est. · year 1
- Rental income
- $22,165
- − Mortgage interest
- −$5,265
- − Property taxes
- −$1,267
- − Insurance
- −$470
- − Repairs & maintenance
- −$1,773
- − Management
- −$1,773
- − Depreciation
- −$2,735
- Taxable income
- $8,882
- Est. tax owed @ 24.0%
- −$2,132
- After-tax cash flow
- $7,727/yr
For passive investors: Depreciation is non-cash, so a rental often shows a tax loss while cash-flowing — sheltering income. Rental losses are passive: they offset passive income freely, and up to $25,000/yr can offset ordinary (W-2) income if you actively participate and your MAGI is under $100k (phasing out to $0 by $150k); unused losses carry forward. On sale, claimed depreciation is recaptured at up to 25%, and gains may owe capital-gains tax (a 1031 exchange can defer both). Figures are a year-1 estimate at your 24.0% rate — not tax advice; consult a CPA.
Schools (NCES district)
- District
- New Kensington-Arnold SD
- NCES district ID
- 4216740
- Math proficiency
- 16% ▼ -7.00%
- Reading proficiency
- 31% ▼ -13.00%
- Median HH income
- $34,386
- Composite
- 19.26/100
- National rank
- #8805
- State rank
- #483 of 539 in PA
Livability — New Kensington
- Score
- 69/100
- State rank
- #840
- US rank
- #8791
Category grades
Schools grade is shown separately in the Schools card above.
Census & demographics
- Census place
- New Kensington, PA
- County
- Westmoreland County · 183,777 people
- City population
- 36,203
- Metro
- Pittsburgh, PA
- Population (ZIP)
- 36,203
- Household income
- $63,426
- Rent vs Own
- Severe rent burden
- 967.0
Population outlook (Westmoreland County) Hauer SSP2
- Today (2025)
- 342,555 people
- By 2030
- 331,717 · -3.2%
- By 2040
- 304,976 · -11.0%
- By 2050
- 277,444 · -19.0%
- By 2075
- 224,607 · -34.4%
- By 2100
- 171,084 · -50.1%
Race, ethnicity, and origin ACS 2023
- Neighborhood character
- Predominantly White (88%)
- Race & ethnicity
- White 88% Black 8% Two or more races 3% Hispanic / Latino 1%
- Common ancestry
- Romanian 12% Subsaharan African 2% Serbian 1%
- Foreign-born
- 1%
- Languages at home
- 97% English-only · Spanish 1% Other Indo-European 0%
Political lean MEDSL · Westmoreland
- 2024 margin
- Strong R (+28.4) · D 35.4% · R 63.9%
- 2008→2024 swing
- -11.7pp toward R · 2008: -16.7pp · 2024: -28.4pp
- All cycles
- 2024: R+28.4 2020: R+28.3 2016: R+31.3 2012: R+23.7 2008: R+16.7
Not yet ingested
- Civics
- —
Market trends
- HPI YoY
- ▼ -42.50%
- Current HPI
- 305.926
- Rent YoY
- ▲ 1.90%
- Metro
- Pittsburgh, PA
- State GDP YoY
- ▲ 1.68%
- F500 in state
- 34
Industry mix (Fortune 500 HQ in PA)
| Industry | F500 HQs | Revenue |
|---|---|---|
| Healthcare | 2 | $309B |
|
||
| Insurance | 2 | $27B |
|
||
| Telecommunications / Media | 1 | $124B |
|
||
| Industrial Distribution | 1 | $22B |
|
||
| Financial Services | 1 | $20B |
|
||
| Chemicals / Materials | 1 | $18B |
|
||
Price history
+327.3% since first listed6 events — show timeline
- 2026-02-11 Listed $94,000 West Penn MLS
- 2025-05-08 Price Changed $94,000 West Penn MLS
- 2025-04-07 Price Changed $99,000 West Penn MLS
- 2025-03-08 Price Changed $100,000 West Penn MLS
- 2025-02-07 Listed $105,000 West Penn MLS
- 2001-03-01 Sold (Public Records) $22,000 Public Records
Property tax history
-2.0%/yrLatest (2026): $1,267 · +0.0% YoY. Source: county tax records.
Cash-flow waterfall
monthlySold comps — $/sqft
last 12 mo · ≤1 miLoading sold comps…