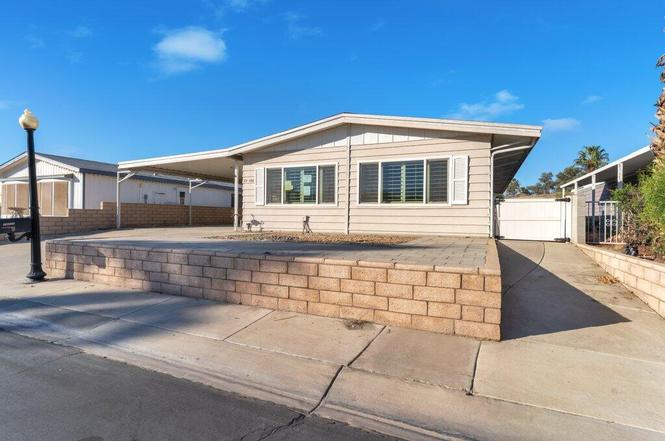
73330 Desert Greens Dr N · Palm Desert, CA
Flood risk 1/10 · Minimal
- FEMA flood zone
- X (unshaded)
- Chance of flooding over 30 yrs
- 0.0%
- Est. flood insurance / yr
- $507 – $1,088
Fire risk 1/10 · Minimal
- Est. fire insurance / yr
- $659 – $1,223
Heat risk 9/10 · Severe
- Hot days now (above 114°F)
- 7 days/yr
- Hot days in 30 yrs
- 20 days/yr
Wind risk 1/10 · Minimal
- Chance of severe wind over 30 yrs
- —
Air-quality risk 4/10 · Minor
- Unhealthy air days now
- 5 days/yr
- Unhealthy air days in 30 yrs
- 7 days/yr
Risk factors via First Street. Map © Google.
Why this score? — see what drove the B+ grade
The composite is a weighted blend of 9 inputs, each scored 0–100. Each bar is that input's sub-score; the figure is the points it added to the 100-point composite (weight × sub-score).
- Cash flow +30.0/30.0
- ARV discount +15.0/15.0
- 1% rule +10.0/10.0
- DSCR +10.0/10.0
- Schools +3.8/10.0
- Rent growth +2.9/5.0
- Livability +2.6/5.0
- Condition / age +2.5/5.0
- Appreciation +0.0/10.0
$229,080
🖨 Deal sheet (PDF) 📄 Offer letter ✓ Due diligence
Listing remarks
Live the desert resort lifestyle you deserve in Palm Desert Greens Country Club. This beautiful 2-bedroom home offers comfort and style in a vibrant 55+ gated golf community. Enjoy golf course views, lush surroundings, and access to exclusive amenities including a clubhouse, pools, fitness center, and more—all just minutes from Palm Desert's premier shopping and dining on El Paseo.
Key facts
- Fitness center
- Clubhouse
- Exclusive amenities
Tags
Neighborhood map
What this means for you Summary
Snapshot
- This is a 3-bed/2.0-bath manufactured listed at $229k.
Deal economics
- At list price, monthly cash flow is $981 ($12k/yr) — positive.
- The deal already cash-flows at list — no discount required.
- Meets the 1% rule at list price ($4k rent vs $229k).
- Recommended offer: $202k (12.0% below list) — sets the bar for market timing.
- Cap rate 11.4% vs local median 3.4% in Palm Desert — top-decile yield for the area; either an underpriced asset or a hidden risk that comps aren't pricing in. Stress-test before assuming the spread holds.
Location & tenants
- Location reads 51/100 on livability (#1,050 in CA) — a working-class tenant base; expect higher turnover. Strengths: employment B+, housing B; Watch: crime D, amenities F, commute F.
- Desert Sands Unified (suburban): math 31% / reading 56% proficiency, ranked #199 of 517 in CA (top 38%) — families likely to look elsewhere, expect single-tenant / working-renter base with shorter leases.
- Zoned schools: James Earl Carter Elementary (516 students, 53% FRL); Colonel Mitchell Paige Middle (math 10% / reading 10%, grade F, #474 of 498 statewide, top 99%, 436 students, 74% FRL); Palm Desert High (math 42% / reading 67%, grade C-, #256 of 1,170 statewide, top 24%, 2,050 students, 57% FRL).
- Market conditions: Rents rising (+1.6%/yr); 551 active listings in the ZIP; 40 comparable units currently listed for rent nearby; rentals lingering (median 45d on market — plan ~5-8 weeks vacancy on turnover, expect pricing pressure); 60% of comp listings sitting > 30 days — soft ceiling on asking rent; 9,195 units permitted in Riverside County in 2024 (1,512 in 5+ unit buildings).
- At $3,763/mo this rent would consume 64% of the median local household income ($70k/yr) (locally 1734% of renters already pay >50% of income on rent) — very limited rent-growth headroom before tenants either downsize or default.
Forward outlook
- Local home prices are declining (-3.0%/yr); year-one equity from $2k of loan paydown is wiped out by about $7k of value loss. Plan a longer hold.
- Riverside County population projected at +22% by 2050 — long-run rental-demand tailwind backs the buy-and-hold thesis.
- At projected returns (-3.0% appreciation + 1.6% rent growth), your $64k cash investment doubles in ~8 years — after that, you're playing with house money.
Negotiation context
- It's been on market 132 days — a 12% lower offer ($202k) is reasonable based on typical stale-listing flexibility.
- 5 sale attempts since 22y ago; this cycle's ask has dropped $20k (8%) from the opening price — seller is motivated, your offer sets the floor, not the list.
Risks & watch-outs
- Climate carrying-cost: extreme-heat days projected 7→20/yr by 2055 (HVAC capex compounding) — expect insurance premiums to compound above CPI over the hold.
Questions for the listing agent
- It's been on market 132 days. Have you received any prior offers? Is the seller open to a 12% concession, seller financing, or rate buy-down credit?
- Built in 1978 — when were the roof, HVAC, electrical panel, plumbing, and water heater last replaced?
- What does the HOA fee cover, when was the last increase, and are there any pending special assessments or reserve-fund shortfalls?
- Why hasn't it sold? Are there any deal-killer items the seller is aware of (foundation, flood, title, zoning, code violations)?
- Is there a deadline driving the sale (1031 exchange, divorce, estate, relocation)? That informs how much negotiation room exists.
- Schools are A-rated — typically a magnet for longer-tenancy family renters. What's the average tenant stay here, and is there a school-zone premium baked into asking?
- Crime grade is D in this area — have there been break-ins, vandalism, or insurance claims at this property in the last 3 years? What carrier currently insures it and at what premium?
- What's the average days-on-market for RENTAL listings here right now (not sales)? A rising rental-DOM trend means longer vacancies and softer asking-rent achievability than the comps imply.
- What's the recent tenant-quality profile in this submarket — average credit score on applications, eviction rate, late-payment / NSF rate, and stable-employment percentage? A property-management company in the area should have these aggregated.
- How much new for-sale + rental construction is in the pipeline within 1–3 miles? Heavy new supply typically softens prices + rents 12–24 months out; constrained supply supports both.
Investment metrics
- 1% rule
- 1.64% ✓
- Cap rate
- 11.43%
- Cash-on-cash
- 18.35%
- DSCR
- 1.82
- GRM
- 5.1
CMA / ARV
- ARV (on-the-fly)
- $327,120
- Comps found
- 12
Show comp detail 12 sales within ~0.75 mi
| Address | Dist | Beds/Ba | Sqft | Sold | Price | $/sf | Match |
|---|---|---|---|---|---|---|---|
| 73330 Desert Greens Dr N | 0.00mi | 2/2.0 (-1) | 1,740 (0%) | 1mo | $229,080 | $132 | 94 |
| 38235 Poppet Canyon Dr | 0.17mi | 2/2.0 (-1) | 1,680 (-3%) | 0mo | $355,000 | $211 | 81 |
| 73297 Highland Springs Dr #2 | 0.33mi | 2/2.0 (-1) | 1,800 (+3%) | 0mo | $275,000 | $153 | 74 |
| 38251 Desert Greens Dr E | 0.39mi | 2/2.0 (-1) | 1,780 (+2%) | 1mo | $253,000 | $142 | 72 |
| 38785 Bautista Canyon Way | 0.48mi | 2/2.0 (-1) | 1,760 (+1%) | 2mo | $330,000 | $188 | 69 |
| 38668 Fawn Springs Dr | 0.35mi | 3/2.5 | 1,600 (-8%) | 0mo | $410,000 | $256 | 68 |
| 73045 Buck Springs Dr | 0.43mi | 2/2.0 (-1) | 1,680 (-3%) | 2mo | $468,000 | $279 | 68 |
| 38521 Little Way | 0.28mi | 2/2.5 (-1) | 1,600 (-8%) | 3mo | $439,000 | $274 | 64 |
| 73450 Country Club Dr Unit Sp. 91 | 0.67mi | 2/2.0 (-1) | 1,788 (+3%) | 0mo | $255,000 | $143 | 59 |
| 73450 Country Club Dr #87 | 0.67mi | 3/2.0 | 1,636 (-6%) | 2mo | $222,500 | $136 | 57 |
| 73651 Adobe Dr | 0.35mi | 2/2.0 (-1) | 1,488 (-14%) | 1mo | $199,000 | $134 | 54 |
| 73701 Half Way Dr | 0.57mi | 2/2.5 (-1) | 1,890 (+9%) | 2mo | $400,000 | $212 | 50 |
Match score weights: distance 35% · size 25% · config 20% · recency 20%. Top-matched comps best support the ARV.
Projected returns pro-forma
-3.0% appreciation · 1.6% rent growth · sell at horizon
- IRR
- 8.3%
- Equity multiple
- 1.32×
- Total profit
- $20,431
- Equity at exit
- $34,157
- IRR
- 16.2%
- Equity multiple
- 2.23×
- Total profit
- $78,629
- Equity at exit
- $19,807
Cash invested: $64,142 (down + closing). Projections, not guarantees.
Landlord ↔ Tenant lean methodology
- Overall (STATE)
- 18 Strongly Tenant-Friendly
- State California
- 18 Strongly Tenant-Friendly · D+13
- County
- — inherits STATE
- City
- — inherits STATE
ZIP-level market 92260
- Rents YoY
- 1.6%
- Active inventory
- 551
- Price-to-rent
- 5.1×
Monthly cashflow live
- Estimated rent
- $3,763 high interval (Pro) →
- Mortgage (P&I)
- −$1,201
- Tax from tax record
- −$295 /mo · $3,541/yr
- Insurance
- −$95
- HOA
- −$400
- Vacancy / Maint / Mgmt
- −$790
- Net cashflow
- $981
Break-even live
Sensitivity live
| Price | -10% $1,111 | -5% $1,046 | +0% $981 | +5% $916 | +10% $851 |
|---|---|---|---|---|---|
| Rent | -10% $684 | -5% $832 | +0% $981 | +5% $1,130 | +10% $1,278 |
| Rate | -1.0pp $1,096 | -0.5pp $1,039 | base $981 | +0.5pp $922 | +1.0pp $861 |
UW: 25.0% down · 7.5% · 30yr · 1.5% tax · 5.0% vac · 8.0% maint · 8.0% mgmt
Financing live
Cash to close
- Down payment
- $57,270
- Closing costs
- $6,872
- Reserves months
- —
- Total cash needed
- —
Loan-product check · same deal, 3 products live
Conventional
25% down · 7.5% · 30yr
- Down + closing
- —
- Monthly P&I
- —
- Monthly cashflow
- —
- DSCR
- —
- Eligible?
- —
Personal DTI + credit; lowest rate.
DSCR
20% down · 8.5% · 30yr
- Down + closing
- —
- Monthly P&I
- —
- Monthly cashflow
- —
- DSCR
- —
- Eligible?
- —
No personal income docs; deal must DSCR.
Hard money
10% down · 12.0% · 12mo
- Down + closing
- —
- Monthly P&I
- —
- Monthly cashflow
- —
- DSCR
- —
- Eligible?
- —
Short-term bridge; refi at stabilization.
Rent comps 40 comps
| Address | Beds | Baths | Sqft | Rent | $/sqft | DOM | Units | Dist |
|---|---|---|---|---|---|---|---|---|
| 38250 Azalea Dr Palm Desert, CA | 2.0 | 2.0 | 1806 | $5,500 | $3.05 | 45d | 1 | 0.15mi |
| 38520 Poppet Canyon Dr Palm Desert, CA | 2.0 | 2.0 | 1392 | $3,700 | $2.66 | 45d | 1 | 0.24mi |
| 73639 Cabazon Peak Dr Palm Desert, CA | 2.0 | 2.0 | 1717 | $2,400 | $1.40 | 45d | 1 | 0.33mi |
| 37762 Drexell Dr Palm Desert, CA | 4.0 | 2.0 | 1724 | $4,495 | $2.61 | 25d | 1 | 0.40mi |
| 73075 Buck Springs Dr Palm Desert, CA | 2.0 | 2.0 | 1440 | $1,950 | $1.35 | 45d | 1 | 0.41mi |
| 37677 Emerson Dr Palm Desert, CA | 3.0 | 2.0 | 1896 | $3,600 | $1.90 | 45d | 1 | 0.48mi |
| 37760 Driscoll St Palm Desert, CA | 4.0 | 2.0 | 1896 | $5,200 | $2.74 | 45d | 1 | 0.54mi |
| 37772 Hollister Dr Palm Desert, CA | 3.0 | 2.0 | 1271 | $3,200 | $2.52 | 45d | 1 | 0.58mi |
| 73450 Country Club Dr #120 Palm Desert, CA | 2.0 | 2.0 | 1856 | $2,995 | $1.61 | 13d | 1 | 0.65mi |
| 73843 Line Canyon Ln Palm Desert, CA | 2.0 | 2.0 | 1570 | $2,100 | $1.34 | 13d | 1 | 0.75mi |
| 73774 Mojave Desert Dr Palm Desert, CA | 3.0 | 2.0 | 2235 | $4,950 | $2.21 | 45d | 1 | 0.78mi |
| 74079 Kingston Ct W Palm Desert, CA | 4.0 | 3.0 | 1937 | $9,980 | $5.15 | 45d | 1 | 0.78mi |
| 4162 Via Mattina Palm Desert, CA | 2.0 | 2.0 | 1867 | $2,950 | $1.58 | 14d | 1 | 0.79mi |
| 1701 Retreat Cir Palm Desert, CA | 3.0 | 2.5 | 2034 | $5,300 | $2.61 | 45d | 1 | 0.80mi |
| 73759 Julie Ln Palm Desert, CA | 2.0 | 2.0 | 1366 | $3,249 | $2.38 | 45d | 1 | 0.82mi |
| 170 Via Tramonto Palm Desert, CA | 3.0 | 2.0 | 1910 | $3,900 | $2.04 | 12d | 1 | 0.84mi |
| 170 Via Tramonto Palm Desert, CA | 3.0 | 2.0 | 1910 | $4,000 | $2.09 | 45d | 1 | 0.84mi |
| 3253 Via Giorna Palm Desert, CA | 2.0 | 2.0 | 1961 | $4,500 | $2.29 | 25d | 1 | 0.84mi |
| 248 Strada Fortuna Palm Desert, CA | 2.0 | 2.0 | 1400 | $2,500 | $1.79 | 45d | 1 | 0.86mi |
| 302 Retreat Cir Palm Desert, CA | 3.0 | 3.0 | 2184 | $6,000 | $2.75 | 45d | 1 | 0.89mi |
| 502 Retreat Cir Palm Desert, CA | 3.0 | 3.0 | 2188 | $5,200 | $2.38 | 45d | 1 | 0.93mi |
| 105 Kavenish Dr Rancho Mirage, CA | 3.0 | 3.0 | 1724 | $4,200 | $2.44 | 45d | 1 | 0.93mi |
| 93 Kavenish Dr Rancho Mirage, CA | 3.0 | 3.0 | 2136 | $6,800 | $3.18 | 4d | 1 | 0.98mi |
| 40064 Silktree Ct Palm Desert, CA | 3.0 | 2.0 | 1712 | $3,200 | $1.87 | 25d | 1 | 1.07mi |
| 2701 Via Calderia Palm Desert, CA | 2.0 | 2.0 | 1559 | $2,850 | $1.83 | 25d | 1 | 1.09mi |
| 73983 Munn Cir Palm Desert, CA | 3.0 | 2.0 | 2064 | $3,400 | $1.65 | 45d | 1 | 1.13mi |
| 35751 Gateway Dr Palm Desert, CA | 1.0–3.0 | 1.0–2.0 | 1170 | $3,245 | $2.77 | 45d | 1 | 1.15mi |
| 1803 Via San Martino Palm Desert, CA | 2.0 | 2.0 | 1559 | $3,900 | $2.50 | 45d | 1 | 1.15mi |
| 40255 Sagewood Dr Palm Desert, CA | 3.0 | 2.0 | 1712 | $3,300 | $1.93 | 20d | 1 | 1.18mi |
| 35515 Bains Ave Palm Desert, CA | 3.0 | 2.5 | 1705 | $3,399 | $1.99 | 45d | 1 | 1.18mi |
| 35460 Domani Dr Palm Desert, CA | 3.0 | 3.0 | 1705 | $2,800 | $1.64 | 9d | 1 | 1.20mi |
| 40605 Ventana Ct Palm Desert, CA | 3.0 | 2.5 | 2093 | $4,500 | $2.15 | 20d | 1 | 1.24mi |
| 41517 Armanac Ct Palm Desert, CA | 3.0 | 2.0 | 1537 | $3,400 | $2.21 | 4d | 1 | 1.27mi |
| 72460 Rodeo Way Rancho Mirage, CA | 2.0 | 2.0 | 1851 | $2,500 | $1.35 | 6d | 1 | 1.27mi |
| 72385 Beverly Way Rancho Mirage, CA | 2.0 | 2.0 | 1851 | $2,500 | $1.35 | 20d | 1 | 1.27mi |
| 40556 Clover Ln Palm Desert, CA | 3.0 | 2.5 | 1880 | $4,200 | $2.23 | 45d | 1 | 1.28mi |
| 35722 McCarthy St Palm Desert, CA | 4.0 | 2.0 | 2189 | $3,800 | $1.74 | 45d | 1 | 1.28mi |
| 34 Paris Way Rancho Mirage, CA | 3.0 | 3.0 | 2101 | $6,000 | $2.86 | 45d | 1 | 1.28mi |
| 40560 Glenwood Ln Palm Desert, CA | 3.0 | 3.0 | 2052 | $6,500 | $3.17 | 45d | 1 | 1.28mi |
| 73528 Cierra St Palm Desert, CA | 3.0 | 2.0 | 1547 | $2,995 | $1.94 | 16d | 1 | 1.28mi |
HOA detail
- Monthly dues
- $400 · $4,800/yr
- Likely covers
- poolgymsecurity
Listing history 14 events
-
2026-03-26status Pending
-
2026-02-09historical Active Under Contract
-
2026-02-06price $229,080
-
2026-01-30status Active
-
2026-01-07historical Active Under Contract
-
2025-11-13$249,000 Active
-
2008-04-17soldstatus $210,000
-
2008-03-23historical
-
2007-11-08$224,500
-
2007-09-11historical
-
2007-05-11$249,900
-
2004-06-28soldstatus $162,500
-
2004-06-02historical
-
2004-06-01$165,000
ⓘ Source: listings_history table (triggers on properties + properties_extension) + one-shot
backfill from property_details.listing_events for pre-trigger history.
Tax reassessment forecast CA · Resets to sale price
- Current annual tax
- $3,541 · $295/mo
- Projected year-2 tax
- $3,541 · $295/mo
- Expected delta
- $0/yr ($0/mo · 0.0%)
ⓘ Screening estimate from a state-policy table — verify with the county assessor before closing.
Climate risk First Street
- Flood 1/10 Low FEMA zone X (unshaded) · 0% chance over 30 yrs
- Wildfire 1/10 Low
- Heat 9/10 Extreme 7 d/yr ≥114°F today · 20 d/yr by 30 yrs out
- Wind 1/10 Low
- Air quality 4/10 Moderate 5 unhealthy d/yr today · 7 by 30 yrs out
Nearby sold comps map
Loading sold comps map…
Walkable amenities ~0.75 mi
Loading nearby amenities…
Taxation est. · year 1
- Rental income
- $45,156
- − Mortgage interest
- −$12,832
- − Property taxes
- −$3,541
- − Insurance
- −$1,145
- − Repairs & maintenance
- −$3,612
- − Management
- −$3,612
- − HOA
- −$4,800
- − Depreciation
- −$6,664
- Taxable income
- $8,948
- Est. tax owed @ 24.0%
- −$2,148
- After-tax cash flow
- $9,623/yr
For passive investors: Depreciation is non-cash, so a rental often shows a tax loss while cash-flowing — sheltering income. Rental losses are passive: they offset passive income freely, and up to $25,000/yr can offset ordinary (W-2) income if you actively participate and your MAGI is under $100k (phasing out to $0 by $150k); unused losses carry forward. On sale, claimed depreciation is recaptured at up to 25%, and gains may owe capital-gains tax (a 1031 exchange can defer both). Figures are a year-1 estimate at your 24.0% rate — not tax advice; consult a CPA.
Schools (NCES district)
- District
- Desert Sands Unified
- NCES district ID
- 0611110
- Math proficiency
- 31% ▼ -4.00%
- Reading proficiency
- 56% ▲ 7.00%
- Median HH income
- $54,957
- Composite
- 37.77/100
- National rank
- #4346
- State rank
- #199 of 517 in CA
Livability — Palm Desert
- Score
- 51/100
- State rank
- #1050
- US rank
- #25164
Category grades
Schools grade is shown separately in the Schools card above.
Census & demographics
- Census place
- Palm Desert, CA
- County
- Riverside County · 2,287,001 people
- City population
- 58,615
- Metro
- Riverside-San Bernardino-Ontario, CA
- Population (ZIP)
- 30,523
- Household income
- $70,091
- Rent vs Own
- Severe rent burden
- 1734.0
Population outlook (Riverside County) Hauer SSP2
- Today (2025)
- 2,664,475 people
- By 2030
- 2,802,692 · +5.2%
- By 2040
- 3,050,904 · +14.5%
- By 2050
- 3,256,783 · +22.2%
- By 2075
- 3,655,058 · +37.2%
- By 2100
- 3,766,594 · +41.4%
Race, ethnicity, and origin ACS 2023
- Neighborhood character
- Majority White (61%)
- Race & ethnicity
- White 61% Hispanic / Latino 31% Two or more races 20% Asian 4% Black 2%
- Hispanic origin (detail)
- Mexican 25%
- Common ancestry
- Italian 4% Lithuanian 3% Slovak 2%
- Foreign-born
- 18% · Canada, South Korea, Vietnam
- Languages at home
- 73% English-only · Spanish 22% French/Haitian/Cajun 1% Other Indo-European 1%
Political lean MEDSL · Riverside
- 2024 margin
- Toss-up / Even · D 48.0% · R 49.3% · Other 2.6%
- 2008→2024 swing
- -3.6pp toward R · 2008: 2.3pp · 2024: -1.3pp
- All cycles
- 2024: R+1.3 2020: D+8.0 2016: D+4.3 2012: R+0.4 2008: D+2.3
Not yet ingested
- Civics
- —
Market trends
- HPI YoY
- ▼ -364.94%
- Current HPI
- 294.9425
- Rent YoY
- ▲ 1.60%
- Metro
- Riverside-San Bernardino-Ontario, CA
- State GDP YoY
- ▲ 3.21%
- F500 in state
- 116
Industry mix (Fortune 500 HQ in CA)
| Industry | F500 HQs | Revenue |
|---|---|---|
| Technology | 27 | $1,492B |
|
||
| Financial Services | 3 | $174B |
|
||
| Retail | 3 | $44B |
|
||
| Insurance | 3 | $26B |
|
||
| Media / Entertainment | 2 | $115B |
|
||
| Pharmaceuticals / Biotech | 2 | $62B |
|
||
Price history
+38.8% since first listed14 events — show timeline
- 2026-03-26 Pending — GPSMLS
- 2026-02-09 Contingent — GPSMLS
- 2026-02-06 Price Changed $229,080 GPSMLS
- 2026-01-30 Relisted — GPSMLS
- 2026-01-07 Contingent — GPSMLS
- 2025-11-13 Listed $249,000 GPSMLS
- 2008-04-17 Sold (Public Records) $210,000 Public Records
- 2008-03-23 Listing Removed — GPSMLS
- 2007-11-08 Listed $224,500 GPSMLS
- 2007-09-11 Listing Removed — GPSMLS
- 2007-05-11 Listed $249,900 GPSMLS
- 2004-06-28 Sold (Public Records) $162,500 Public Records
- 2004-06-02 Listing Removed — GPSMLS
- 2004-06-01 Listed $165,000 GPSMLS
Property tax history
+5.9%/yrLatest (2025): $3,541 · +7.2% YoY. Source: county tax records.
Cash-flow waterfall
monthlySold comps — $/sqft
last 12 mo · ≤1 miLoading sold comps…