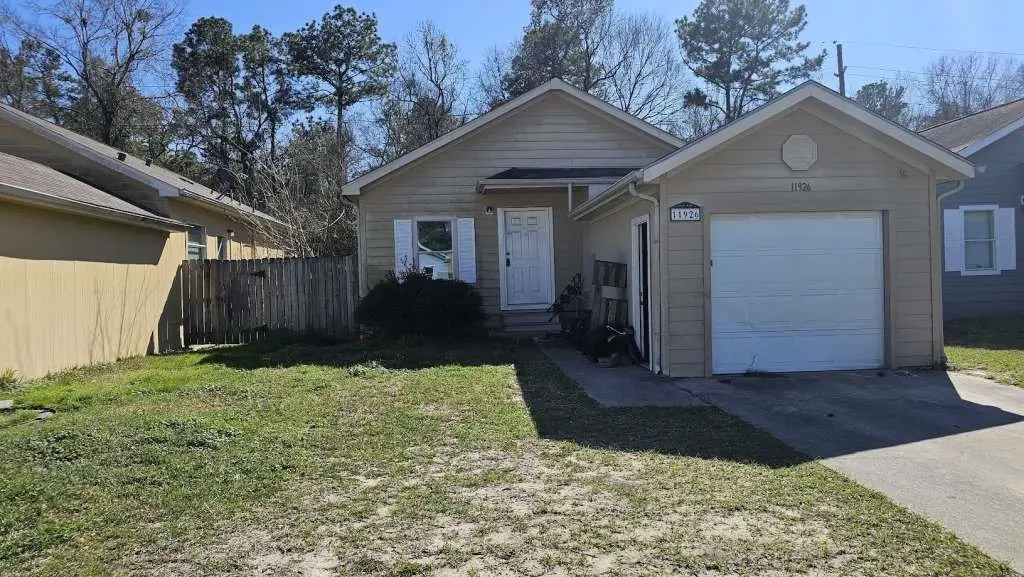
11926 Greensbrook Forest Dr · Houston, TX
Flood risk 6/10 · Moderate
- FEMA flood zone
- X (shaded)
- Chance of flooding over 30 yrs
- 0.7%
- Est. flood insurance / yr
- $507 – $1,088
Fire risk 5/10 · Moderate
- Est. fire insurance / yr
- $1,222 – $2,270
Heat risk 9/10 · Severe
- Hot days now (above 110°F)
- 7 days/yr
- Hot days in 30 yrs
- 25 days/yr
Wind risk 9/10 · Severe
- Chance of severe wind over 30 yrs
- 99.0%
Air-quality risk 3/10 · Minor
- Unhealthy air days now
- 2 days/yr
- Unhealthy air days in 30 yrs
- 3 days/yr
Risk factors via First Street. Map © Google.
Why this score? — see what drove the C- grade
The composite is a weighted blend of 9 inputs, each scored 0–100. Each bar is that input's sub-score; the figure is the points it added to the 100-point composite (weight × sub-score).
- Cash flow +18.7/30.0
- DSCR +5.9/10.0
- 1% rule +5.8/10.0
- ARV discount +4.7/15.0
- Appreciation +4.2/10.0
- Livability +3.7/5.0
- Rent growth +2.7/5.0
- Condition / age +2.5/5.0
- Schools +2.0/10.0
$165,999
🖨 Deal sheet 📄 Offer letter ✓ Due diligence
Listing remarks MLS
BIG BRIGHT KITCHEN! Lovely single-story home available in the Northeast Houston area. 11926 Greensbrook Forest Dr boasts three bedrooms, two bathrooms, and 1,188 Sq. Ft. of living space, this is the perfect starter home for an. The family room is a cozy space, and the kitchen is fully functional with white cabinets, vinyl flooring, and a center island. Coming with new roof. This location offers you so many amenities and attractions. Sheldon Lake State Park and Eisenhower Park are within 6 miles. There is a Showbiz Cinema with a bowling alley down the road and the Westlake Marketplace and Redemption Square are less than 10 minutes away where you will be able to enjoy some quality shopping and upscale dining. Easy access to Beltway 8 and Alt-90. WE MAKE IT EASY TO OWN. This is a great opportunity! Don't wait, call us today to get more information on the owner's easy terms and smooth process that may be able to put the deed in your name and make this your dream home.
Key facts
- Eisenhower park
- Vinyl flooring
- Single-story home
Tags
Neighborhood map
What this means for you Summary
Snapshot
- This is a 3-bed/2.0-bath single-family listed at $166k.
Deal economics
- At list price, monthly cash flow is $165 ($2k/yr) — positive.
- The deal already cash-flows at list — no discount required.
- Meets the 1% rule at list price ($2k rent vs $166k).
- Recommended offer: $146k (12.0% below list) — sets the bar for market timing.
- Cap rate 7.5% vs local median 3.2% in Houston — top-decile yield for the area; either an underpriced asset or a hidden risk that comps aren't pricing in. Stress-test before assuming the spread holds.
Location & tenants
- Location reads 74/100 on livability (#184 in TX, #4,771 nationally) — a middle-class / working-renter tenant base. Strengths: amenities A+, cost of living A+, housing A+; Watch: schools D, crime F.
- Sheldon ISD (suburban): math 19% / reading 25% proficiency, ranked #746 of 826 in TX (top 90%) — low school quality limits family demand, transient renter base, plan for 1-2y turnover; 72% free/reduced lunch — lower-income household profile, screen leases tightly.
- Market conditions: Rents flat; 337 active listings in the ZIP; 3 comparable units currently listed for rent nearby; rentals leasing fast (median 3d on market — plan ~1-2 weeks tenant-placement turnaround); solid renter incomes; 29,883 units permitted in Harris County in 2024 (8,621 in 5+ unit buildings).
Forward outlook
- Local home prices are declining (-1.6%/yr); year-one equity from $1k of loan paydown is wiped out by about $3k of value loss. Plan a longer hold.
- Harris County population projected at +47% by 2050 — long-run rental-demand tailwind backs the buy-and-hold thesis.
Negotiation context
- It's been on market 645 days — a 12% lower offer ($146k) is reasonable based on typical stale-listing flexibility.
- 5 sale attempts since 9y ago; this cycle's ask is 9127% above the opening price — seller raised mid-cycle; expect resistance to lowballs.
Risks & watch-outs
- Climate carrying-cost: major flood risk; severe wind risk, 99% chance of damaging wind over 30y; moderate wildfire risk; extreme-heat days projected 7→25/yr by 2055 (HVAC capex compounding) — expect insurance premiums to compound above CPI over the hold.
Questions for the listing agent
- It's been on market 645 days. Have you received any prior offers? Is the seller open to a 12% concession, seller financing, or rate buy-down credit?
- What does the HOA fee cover, when was the last increase, and are there any pending special assessments or reserve-fund shortfalls?
- Why hasn't it sold? Are there any deal-killer items the seller is aware of (foundation, flood, title, zoning, code violations)?
- Is there a deadline driving the sale (1031 exchange, divorce, estate, relocation)? That informs how much negotiation room exists.
- Schools are D-rated, which usually means shorter tenancies and higher turnover. Who's the typical renter profile here, and what's been the actual vacancy rate?
- Crime grade is F in this area — have there been break-ins, vandalism, or insurance claims at this property in the last 3 years? What carrier currently insures it and at what premium?
- What's the average days-on-market for RENTAL listings here right now (not sales)? A rising rental-DOM trend means longer vacancies and softer asking-rent achievability than the comps imply.
- What's the recent tenant-quality profile in this submarket — average credit score on applications, eviction rate, late-payment / NSF rate, and stable-employment percentage? A property-management company in the area should have these aggregated.
- How much new for-sale + rental construction is in the pipeline within 1–3 miles? Heavy new supply typically softens prices + rents 12–24 months out; constrained supply supports both.
Investment metrics
- 1% rule
- 1.08% ✓
- Cap rate
- 7.48%
- Cash-on-cash
- 4.25%
- DSCR
- 1.19
- GRM
- 7.7
CMA / ARV
- ARV (median comp)
- $156,318
- List price
- $165,999
- Delta
- 6.19%
- Verdict
- FAIR
- Comps
- 20 within 1.0 mi
Show comp detail 12 sales within ~0.75 mi
| Address | Dist | Beds/Ba | Sqft | Sold | Price | $/sf | Match |
|---|---|---|---|---|---|---|---|
| 11954 Greensbrook Forest Dr | 0.05mi | 3/2.0 | 1,188 (0%) | 4mo | $125,000 | $105 | 95 |
| 11818 Kingslake Forest Dr | 0.13mi | 3/2.0 | 1,188 (0%) | 1mo | $68,000 | $57 | 93 |
| 11722 Greenglen Dr | 0.17mi | 3/2.0 | 1,188 (0%) | 1mo | $169,000 | $142 | 91 |
| 11835 Greensbrook Forest Dr | 0.06mi | 3/2.0 | 1,188 (0%) | 11mo | $135,000 | $114 | 88 |
| 11738 Greencanyon Dr | 0.22mi | 3/2.0 | 1,232 (+4%) | 4mo | $159,900 | $130 | 80 |
| 11850 Greencanyon Dr | 0.17mi | 3/2.5 | 1,128 (-5%) | 2mo | $185,000 | $164 | 80 |
| 11907 Greensbrook Forest Dr | 0.05mi | 3/2.0 | 1,080 (-9%) | 3mo | $159,000 | $147 | 80 |
| 11950 Greensbrook Forest Dr | 0.05mi | 3/2.0 | 1,080 (-9%) | 10mo | $139,900 | $130 | 75 |
| 11839 Greencanyon Dr | 0.21mi | 3/1.0 | 1,136 (-4%) | 8mo | $90,000 | $79 | 72 |
| 11715 Greenglen Dr | 0.19mi | 3/2.0 | 1,080 (-9%) | 5mo | $140,000 | $130 | 72 |
| 11915 Greenmesa Dr | 0.14mi | 3/1.0 | 1,050 (-12%) | 10mo | $130,000 | $124 | 62 |
| 11718 Greenmesa Dr | 0.20mi | 3/1.0 | 1,036 (-13%) | 10mo | $135,000 | $130 | 57 |
Match score weights: distance 35% · size 25% · config 20% · recency 20%. Top-matched comps best support the ARV.
Projected returns pro-forma
-1.59% appreciation · 0.92% rent growth · sell at horizon
- IRR
- -5.2%
- Equity multiple
- 0.79×
- Total profit
- $-9,945
- Equity at exit
- $35,452
- IRR
- -0.0%
- Equity multiple
- 1.00×
- Total profit
- $-126
- Equity at exit
- $33,421
Cash invested: $46,480 (down + closing). Projections, not guarantees.
Landlord ↔ Tenant lean methodology
- Overall (STATE)
- 87 Strongly Landlord-Friendly
- State Texas
- 87 Strongly Landlord-Friendly · R+5
- County
- — inherits STATE
- City
- — inherits STATE
ZIP-level market 77044
- Home prices YoY
- -0.7%
- Rents YoY
- 0.9%
- Active inventory
- 337
- Price-to-rent
- 7.7×
Monthly cashflow live
- Estimated rent
- $1,800 medium interval (Pro) →
- Mortgage (P&I)
- −$871
- Tax from tax record
- −$300 /mo · $3,597/yr
- Insurance
- −$69
- HOA
- −$18
- Vacancy / Maint / Mgmt
- −$378
- Net cashflow
- $165
Break-even live
UW: 25.0% down · 7.5% · 30yr · 1.5% tax · 5.0% vac · 8.0% maint · 8.0% mgmt
Financing live
Cash to close
- Down payment
- $41,500
- Closing costs
- $4,980
- Reserves months
- —
- Total cash needed
- —
Loan-product check · same deal, 3 products live
Conventional
25% down · 7.5% · 30yr
- Down + closing
- —
- Monthly P&I
- —
- Monthly cashflow
- —
- DSCR
- —
- Eligible?
- —
Personal DTI + credit; lowest rate.
DSCR
20% down · 8.5% · 30yr
- Down + closing
- —
- Monthly P&I
- —
- Monthly cashflow
- —
- DSCR
- —
- Eligible?
- —
No personal income docs; deal must DSCR.
Hard money
10% down · 12.0% · 12mo
- Down + closing
- —
- Monthly P&I
- —
- Monthly cashflow
- —
- DSCR
- —
- Eligible?
- —
Short-term bridge; refi at stabilization.
Rent comps 3 comps
| Address | Beds | Baths | Sqft | Rent | $/sqft | DOM | Units | Dist |
|---|---|---|---|---|---|---|---|---|
| 11950 Greensbrook Forest Dr Houston, TX | 3.0 | 2.0 | 1080 | $1,500 | $1.39 | 18d | 1 | 0.07mi |
| 11711 Greenglen Dr Houston, TX | 3.0 | 2.0 | 1080 | $1,603 | $1.48 | 1d | 1 | 0.17mi |
| 12211 Haroldson Forest Dr Houston, TX | 3.0 | 2.0 | 958 | $1,619 | $1.69 | 2d | 1 | 0.38mi |
HOA detail
- Monthly dues
- $18 · $216/yr
Listing history 30 events
-
2026-06-18days on market $165,999 Active 645 DOM
-
2026-06-17days on market $165,999 Active 644 DOM
-
2026-06-16days on market $165,999 Active 643 DOM
-
2026-06-15days on market $165,999 Active 642 DOM
-
2026-06-13days on market $165,999 Active 640 DOM
-
2026-06-09days on market $165,999 Active 636 DOM
-
2026-06-08days on market $165,999 Active 635 DOM
-
2026-06-07days on market $165,999 Active 634 DOM
-
2026-06-04days on market $165,999 Active 631 DOM
-
2026-06-03days on market $165,999 Active 630 DOM
-
2026-06-02days on market $165,999 Active 629 DOM
-
2026-06-01days on market $165,999 Active 628 DOM
-
2026-05-31days on market $165,999 Active 627 DOM
-
2026-04-11$1,799
-
2026-03-25price $165,999 978-char remark
Show marketing remark (978 chars)
BIG BRIGHT KITCHEN! Lovely single-story home available in the Northeast Houston area. 11926 Greensbrook Forest Dr boasts three bedrooms, two bathrooms, and 1,188 Sq. Ft. of living space, this is the perfect starter home for an. The family room is a cozy space, and the kitchen is fully functional with white cabinets, vinyl flooring, and a center island. Coming with new roof. This location offers you so many amenities and attractions. Sheldon Lake State Park and Eisenhower Park are within 6 miles. There is a Showbiz Cinema with a bowling alley down the road and the Westlake Marketplace and Redemption Square are less than 10 minutes away where you will be able to enjoy some quality shopping and upscale dining. Easy access to Beltway 8 and Alt-90. WE MAKE IT EASY TO OWN. This is a great opportunity! Don't wait, call us today to get more information on the owner's easy terms and smooth process that may be able to put the deed in your name and make this your dream home.
-
2024-09-11$159,079 Active 978-char remark
Show marketing remark (978 chars)
BIG BRIGHT KITCHEN! Lovely single-story home available in the Northeast Houston area. 11926 Greensbrook Forest Dr boasts three bedrooms, two bathrooms, and 1,188 Sq. Ft. of living space, this is the perfect starter home for an. The family room is a cozy space, and the kitchen is fully functional with white cabinets, vinyl flooring, and a center island. Coming with new roof. This location offers you so many amenities and attractions. Sheldon Lake State Park and Eisenhower Park are within 6 miles. There is a Showbiz Cinema with a bowling alley down the road and the Westlake Marketplace and Redemption Square are less than 10 minutes away where you will be able to enjoy some quality shopping and upscale dining. Easy access to Beltway 8 and Alt-90. WE MAKE IT EASY TO OWN. This is a great opportunity! Don't wait, call us today to get more information on the owner's easy terms and smooth process that may be able to put the deed in your name and make this your dream home.
-
2023-08-08soldstatus
-
2019-08-21status Pending
-
2019-08-21historical
-
2019-08-01$127,900 Active
-
2019-05-30soldstatus
-
2017-07-18soldstatus
-
2017-07-07soldstatus Sold
-
2017-06-18status Pending
-
2017-05-18status Option Pending
-
2017-03-07$79,900 Active
-
2017-03-04historical
-
2017-02-08$79,900 Active
-
2013-05-10soldstatus
-
1997-06-25soldstatus
ⓘ Source: listings_history table (triggers on properties + properties_extension) + one-shot
backfill from property_details.listing_events for pre-trigger history.
Tax reassessment forecast TX · Resets to sale price
- Current annual tax
- $3,597 · $300/mo
- Projected year-2 tax
- $3,597 · $300/mo
- Expected delta
- $0/yr ($0/mo · 0.0%)
ⓘ Screening estimate from a state-policy table — verify with the county assessor before closing.
Climate risk First Street
- Flood 6/10 Major FEMA zone X (shaded) · 70% chance over 30 yrs
- Wildfire 5/10 Major
- Heat 9/10 Extreme 7 d/yr ≥110°F today · 25 d/yr by 30 yrs out
- Wind 9/10 Extreme 99% chance of damaging wind over 30 yrs
- Air quality 3/10 Moderate 2 unhealthy d/yr today · 3 by 30 yrs out
Nearby sold comps map
Loading sold comps map…
Walkable amenities ~0.75 mi
Loading nearby amenities…
Taxation est. · year 1
- Rental income
- $21,603
- − Mortgage interest
- −$9,299
- − Property taxes
- −$3,597
- − Insurance
- −$830
- − Repairs & maintenance
- −$1,728
- − Management
- −$1,728
- − HOA
- −$216
- − Depreciation
- −$4,829
- Taxable loss
- −$625
- Est. tax savings @ 24.0%
- +$150
- After-tax cash flow
- $2,127/yr
For passive investors: Depreciation is non-cash, so a rental often shows a tax loss while cash-flowing — sheltering income. Rental losses are passive: they offset passive income freely, and up to $25,000/yr can offset ordinary (W-2) income if you actively participate and your MAGI is under $100k (phasing out to $0 by $150k); unused losses carry forward. On sale, claimed depreciation is recaptured at up to 25%, and gains may owe capital-gains tax (a 1031 exchange can defer both). Figures are a year-1 estimate at your 24.0% rate — not tax advice; consult a CPA.
Schools (NCES district)
- District
- Sheldon ISD
- NCES district ID
- 4839990
- Math proficiency
- 19% ▼ -18.00%
- Reading proficiency
- 25% ▼ -10.00%
- Median HH income
- $49,443
- Composite
- 19.5/100
- National rank
- #8772
- State rank
- #746 of 826 in TX
Livability — Houston
- Score
- 74/100
- State rank
- #184
- US rank
- #4771
Category grades
Schools grade is shown separately in the Schools card above.
Census & demographics
- County
- Harris County · 4,702,590 people
- City population
- 3,226,434
- Metro
- Houston-The Woodlands-Sugar Land, TX
- Population (ZIP)
- 58,347
- Household income
- $95,000
- Rent vs Own
- Severe rent burden
- 1332.0
Population outlook (Harris County) Hauer SSP2
- Today (2025)
- 5,571,493 people
- By 2030
- 6,089,821 · +9.3%
- By 2040
- 7,142,806 · +28.2%
- By 2050
- 8,185,864 · +46.9%
- By 2075
- 10,574,329 · +89.8%
- By 2100
- 12,109,958 · +117.4%
Race, ethnicity, and origin ACS 2023
- Neighborhood character
- Diverse neighborhood (Simpson 0.66)
- Race & ethnicity
- Hispanic / Latino 44% Black 32% White 19% Two or more races 18% Native American 2% Asian 1%
- Hispanic origin (detail)
- Mexican 36%
- Common ancestry
- Lithuanian 1% Romanian 1% Iranian 1%
- Foreign-born
- 18% · Canada
- Languages at home
- 61% English-only · Spanish 35% French/Haitian/Cajun 1% Other Indo-European 1%
Political lean MEDSL · Harris
- 2024 margin
- Lean D (+5.5) · D 52.0% · R 46.4% · Other 1.6%
- 2008→2024 swing
- +3.9pp toward D · 2008: 1.6pp · 2024: 5.5pp
- All cycles
- 2024: D+5.5 2020: D+13.3 2016: D+12.4 2012: D+0.1 2008: D+1.6
Not yet ingested
- Civics
- —
Market trends
- HPI YoY
- ▼ -1.59%
- Current HPI
- 215.5736
- Rent YoY
- ▲ 0.92%
- Metro
- Houston-The Woodlands-Sugar Land, TX
- State GDP YoY
- ▲ 3.95%
- F500 in state
- 110
Industry mix (Fortune 500 HQ in TX)
| Industry | F500 HQs | Revenue |
|---|---|---|
| Energy | 16 | $1,198B |
|
||
| Technology | 5 | $198B |
|
||
| Engineering / Construction | 4 | $72B |
|
||
| Energy Services | 3 | $60B |
|
||
| Utilities | 3 | $41B |
|
||
| Healthcare | 2 | $330B |
|
||
Price history
-97.7% since first listed17 events — show timeline
- 2026-04-11 Listed for Rent $1,799 HARMLS
- 2026-03-25 Price Changed $165,999 HARMLS
- 2024-09-11 Listed $159,079 HARMLS
- 2023-08-08 Sold (Public Records) — Public Records
- 2019-08-21 Pending — HARMLS
- 2019-08-21 Listing Removed — HARMLS
- 2019-08-01 Listed $127,900 HARMLS
- 2019-05-30 Sold (Public Records) — Public Records
- 2017-07-18 Sold (Public Records) — Public Records
- 2017-07-07 Sold (MLS) — HARMLS
- 2017-06-18 Pending — HARMLS
- 2017-05-18 Pending — HARMLS
- 2017-03-07 Listed $79,900 HARMLS
- 2017-03-04 Listing Removed — HARMLS
- 2017-02-08 Listed $79,900 HARMLS
- 2013-05-10 Sold (Public Records) — Public Records
- 1997-06-25 Sold (Public Records) — Public Records
Property tax history
+4.7%/yrLatest (2025): $3,597 · -15.8% YoY. Source: county tax records.
Cash-flow waterfall
monthlySold comps — $/sqft
last 12 mo · ≤1 miLoading sold comps…