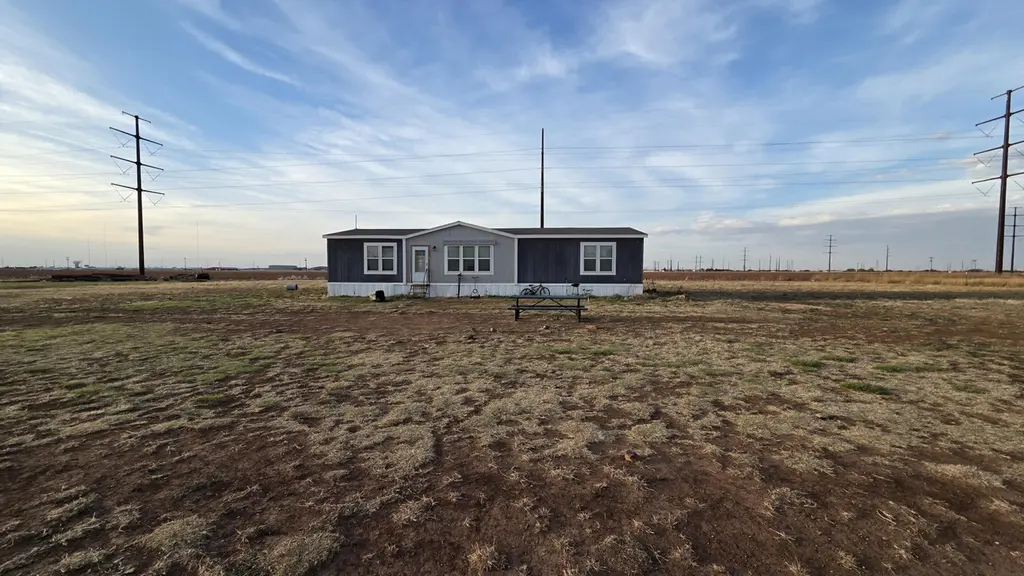
605 E Private Road 7240 · Lubbock, TX
Flood risk 1/10 · Minimal
- FEMA flood zone
- X (unshaded)
- Chance of flooding over 30 yrs
- 0.0%
- Est. flood insurance / yr
- $507 – $1,088
Fire risk 1/10 · Minimal
- Est. fire insurance / yr
- $1,222 – $2,270
Heat risk 5/10 · Moderate
- Hot days now (above 99°F)
- 7 days/yr
- Hot days in 30 yrs
- 21 days/yr
Wind risk 2/10 · Minimal
- Chance of severe wind over 30 yrs
- 2.0%
Air-quality risk 1/10 · Minimal
- Unhealthy air days now
- 0 days/yr
- Unhealthy air days in 30 yrs
- 0 days/yr
Risk factors via First Street. Map © Google.
Why this score? — see what drove the D- grade
The composite is a weighted blend of 9 inputs, each scored 0–100. Each bar is that input's sub-score; the figure is the points it added to the 100-point composite (weight × sub-score).
- ARV discount +7.5/15.0
- Cash flow +7.0/30.0
- Appreciation +6.6/10.0
- Schools +4.8/10.0
- Livability +4.0/5.0
- Rent growth +2.5/5.0
- Condition / age +2.5/5.0
- 1% rule +1.9/10.0
- DSCR +1.2/10.0
$210,000
🖨 Deal sheet 📄 Offer letter ✓ Due diligence
Listing remarks MLS
Sellers offering $5,000 in Flex Cash with an acceptable offer! This 2021-built home in the highly sought-after Lubbock-Cooper ISD sits on a massive 1.46-acre lot, offering the perfect blend of space and opportunity. With nearly 2,000 sq. ft. of living area, the functional layout includes a spacious primary suite featuring dual walk-in closets and well-maintained bathrooms throughout. While the home is ready for a few personal finishing touches (TLC), it presents a rare chance to build immediate equity in a prime location. The expansive acreage provides endless possibilities for a shop, pool, or garden. Don't miss this chance to secure a modern country retreat with a significant financial head start—schedule your showing today!
Key facts
- Dual walk-in closets
- Expansive acreage
- 1.46 acre lot
Tags
Neighborhood map
What this means for you Summary
Snapshot
- This is a 3-bed/2.0-bath manufactured listed at $210k.
Deal economics
- At list price, monthly cash flow is $-312 ($-4k/yr) — negative.
- To cash-flow at today's rent, offer at most $165k (21.5% below list).
- To meet the 1% rule (rent ≥ 1% of price), the offer needs to be $144k (31.3% below list).
- Recommended offer: $144k (31.3% below list) — sets the bar for 1% rule.
Location & tenants
- Location reads 80/100 on livability (#37 in TX, #1,749 nationally) — a professional / high-income tenant draw. Strengths: commute A+, cost of living A+, housing A+; Watch: employment C-, schools D+, crime F.
- Lubbock-Cooper ISD (rural): math 54% / reading 52% proficiency, ranked #98 of 826 in TX (top 12%) — acceptable for families but not a draw, mixed tenant base, ~2y average lease.
- Market conditions: 91 active listings in the ZIP; 1 comparable units currently listed for rent nearby; 2,219 units permitted in Lubbock County in 2024 (252 in 5+ unit buildings).
- This rent runs 34% of the median local income ($52k/yr) — at the standard rent-burdened threshold; future hikes will face affordability resistance.
Forward outlook
- In year one you build about $8k of equity ($1k loan paydown + $7k appreciation (3.2% local appreciation)).
- Lubbock County population projected at +39% by 2050 — long-run rental-demand tailwind backs the buy-and-hold thesis.
- By year 5, paydown + projected appreciation supports a ~$36k cash-out refi (75% LTV) — recoverable capital for the next deal without selling this one.
Negotiation context
- It's been on market 78 days — a 6% lower offer ($197k) is reasonable based on typical stale-listing flexibility.
Risks & watch-outs
- Climate carrying-cost: extreme-heat days projected 7→21/yr by 2055 (HVAC capex compounding) — expect insurance premiums to compound above CPI over the hold.
Questions for the listing agent
- What do current leases actually rent for vs. the listed asking? Can we see a recent rent roll and the last 12 months of T-12 income?
- It's been on market 78 days. Have you received any prior offers? Is the seller open to a 31% concession, seller financing, or rate buy-down credit?
- Why hasn't it sold? Are there any deal-killer items the seller is aware of (foundation, flood, title, zoning, code violations)?
- Is there a deadline driving the sale (1031 exchange, divorce, estate, relocation)? That informs how much negotiation room exists.
- Schools are D-rated, which usually means shorter tenancies and higher turnover. Who's the typical renter profile here, and what's been the actual vacancy rate?
- Crime grade is F in this area — have there been break-ins, vandalism, or insurance claims at this property in the last 3 years? What carrier currently insures it and at what premium?
- The area grade is low — what's the realistic commute time and amenity access for the typical tenant pool here? Any planned neighborhood developments (good or bad) we should know about?
- What's the average days-on-market for RENTAL listings here right now (not sales)? A rising rental-DOM trend means longer vacancies and softer asking-rent achievability than the comps imply.
- What's the recent tenant-quality profile in this submarket — average credit score on applications, eviction rate, late-payment / NSF rate, and stable-employment percentage? A property-management company in the area should have these aggregated.
- How much new for-sale + rental construction is in the pipeline within 1–3 miles? Heavy new supply typically softens prices + rents 12–24 months out; constrained supply supports both.
Investment metrics
- 1% rule
- 0.69% ✗
- Cap rate
- 4.51%
- Cash-on-cash
- -6.37%
- DSCR
- 0.72
- GRM
- 12.1
CMA / ARV
No comps found within radius.
Projected returns pro-forma
3.22% appreciation · 3.0% rent growth · sell at horizon
- IRR
- 2.3%
- Equity multiple
- 1.13×
- Total profit
- $7,934
- Equity at exit
- $97,078
- IRR
- 5.8%
- Equity multiple
- 1.90×
- Total profit
- $53,102
- Equity at exit
- $151,704
Cash invested: $58,800 (down + closing). Projections, not guarantees.
Landlord ↔ Tenant lean methodology
- Overall (STATE)
- 87 Strongly Landlord-Friendly
- State Texas
- 87 Strongly Landlord-Friendly · R+5
- County
- — inherits STATE
- City
- — inherits STATE
ZIP-level market 79404
- Home prices YoY
- 2.0%
- Active inventory
- 91
- Price-to-rent
- 12.1×
Monthly cashflow live
- Estimated rent
- $1,442 medium interval (Pro) →
- Mortgage (P&I)
- −$1,101
- Tax est. 1.5%
- −$262 /mo · $3,150/yr
- Insurance
- −$88
- HOA
- −$0
- Vacancy / Maint / Mgmt
- −$303
- Net cashflow
- $-312
Break-even live
UW: 25.0% down · 7.5% · 30yr · 1.5% tax · 5.0% vac · 8.0% maint · 8.0% mgmt
Financing live
Cash to close
- Down payment
- $52,500
- Closing costs
- $6,300
- Reserves months
- —
- Total cash needed
- —
Loan-product check · same deal, 3 products live
Conventional
25% down · 7.5% · 30yr
- Down + closing
- —
- Monthly P&I
- —
- Monthly cashflow
- —
- DSCR
- —
- Eligible?
- —
Personal DTI + credit; lowest rate.
DSCR
20% down · 8.5% · 30yr
- Down + closing
- —
- Monthly P&I
- —
- Monthly cashflow
- —
- DSCR
- —
- Eligible?
- —
No personal income docs; deal must DSCR.
Hard money
10% down · 12.0% · 12mo
- Down + closing
- —
- Monthly P&I
- —
- Monthly cashflow
- —
- DSCR
- —
- Eligible?
- —
Short-term bridge; refi at stabilization.
Rent comps 1 comps
| Address | Beds | Baths | Sqft | Rent | $/sqft | DOM | Units | Dist |
|---|---|---|---|---|---|---|---|---|
| 1702 102nd St Lubbock, TX | 3.0 | 2.0 | 1487 | $1,499 | $1.01 | 21d | 1 | 1.50mi |
Listing history 17 events
-
2026-06-18days on market $210,000 Active 78 DOM
-
2026-06-17days on market $210,000 Active 77 DOM
-
2026-06-16days on market $210,000 Active 76 DOM
-
2026-06-15days on market $210,000 Active 75 DOM
-
2026-06-14days on market $210,000 Active 73 DOM
-
2026-06-13days on market $210,000 Active 72 DOM
-
2026-06-10days on market $210,000 Active 70 DOM
-
2026-06-09days on market $210,000 Active 69 DOM
-
2026-06-08days on market $210,000 Active 68 DOM
-
2026-06-07days on market $210,000 Active 67 DOM
-
2026-06-05days on market $210,000 Active 64 DOM
-
2026-06-03days on market $210,000 Active 63 DOM
-
2026-06-02days on market $210,000 Active 62 DOM
-
2026-06-01days on market $210,000 Active 61 DOM
-
2026-05-31days on market $210,000 Active 60 DOM
-
2026-05-30days on market $210,000 Active 59 DOM
-
2026-04-01$232,500 Active 742-char remark
Show marketing remark (742 chars)
Sellers offering $5,000 in Flex Cash with an acceptable offer! This 2021-built home in the highly sought-after Lubbock-Cooper ISD sits on a massive 1.46-acre lot, offering the perfect blend of space and opportunity. With nearly 2,000 sq. ft. of living area, the functional layout includes a spacious primary suite featuring dual walk-in closets and well-maintained bathrooms throughout. While the home is ready for a few personal finishing touches (TLC), it presents a rare chance to build immediate equity in a prime location. The expansive acreage provides endless possibilities for a shop, pool, or garden. Don't miss this chance to secure a modern country retreat with a significant financial head start—schedule your showing today!
ⓘ Source: listings_history table (triggers on properties + properties_extension) + one-shot
backfill from property_details.listing_events for pre-trigger history.
Climate risk First Street
- Flood 1/10 Low FEMA zone X (unshaded) · 0% chance over 30 yrs
- Wildfire 1/10 Low
- Heat 5/10 Major 7 d/yr ≥99°F today · 21 d/yr by 30 yrs out
- Wind 2/10 Low 2% chance of damaging wind over 30 yrs
- Air quality 1/10 Low 0 unhealthy d/yr today · 0 by 30 yrs out
Nearby sold comps map
Loading sold comps map…
Walkable amenities ~0.75 mi
Loading nearby amenities…
Taxation est. · year 1
- Rental income
- $17,303
- − Mortgage interest
- −$11,763
- − Property taxes
- −$3,150
- − Insurance
- −$1,050
- − Repairs & maintenance
- −$1,384
- − Management
- −$1,384
- − Depreciation
- −$6,109
- Taxable loss
- −$7,537
- Est. tax savings @ 24.0%
- +$1,809
- After-tax cash flow
- $-1,936/yr
For passive investors: Depreciation is non-cash, so a rental often shows a tax loss while cash-flowing — sheltering income. Rental losses are passive: they offset passive income freely, and up to $25,000/yr can offset ordinary (W-2) income if you actively participate and your MAGI is under $100k (phasing out to $0 by $150k); unused losses carry forward. On sale, claimed depreciation is recaptured at up to 25%, and gains may owe capital-gains tax (a 1031 exchange can defer both). Figures are a year-1 estimate at your 24.0% rate — not tax advice; consult a CPA.
Schools (NCES district)
- District
- Lubbock-Cooper ISD
- NCES district ID
- 4815180
- Math proficiency
- 54% ▼ -7.00%
- Reading proficiency
- 52% ▼ -3.00%
- Median HH income
- $77,347
- Composite
- 47.9/100
- National rank
- #2214
- State rank
- #98 of 826 in TX
Livability — Lubbock
- Score
- 80/100
- State rank
- #37
- US rank
- #1749
Category grades
Schools grade is shown separately in the Schools card above.
Census & demographics
- County
- Lubbock County · 293,542 people
- City population
- 283,030
- Metro
- Lubbock, TX
- Population (ZIP)
- 8,529
- Household income
- $51,630
- Rent vs Own
- Severe rent burden
- 366.0
Population outlook (Lubbock County) Hauer SSP2
- Today (2025)
- 345,960 people
- By 2030
- 371,449 · +7.4%
- By 2040
- 424,539 · +22.7%
- By 2050
- 481,150 · +39.1%
- By 2075
- 633,467 · +83.1%
- By 2100
- 746,853 · +115.9%
Race, ethnicity, and origin ACS 2023
- Neighborhood character
- Diverse neighborhood (Simpson 0.60)
- Race & ethnicity
- Hispanic / Latino 55% Black 22% White 20% Two or more races 17% Native American 2%
- Hispanic origin (detail)
- Mexican 46%
- Common ancestry
- Romanian 1% Lithuanian 0%
- Foreign-born
- 5% · Canada
- Languages at home
- 64% English-only · Spanish 36%
Political lean MEDSL · Lubbock
- 2024 margin
- Solid R (+39.5) · D 29.7% · R 69.2% · Other 1.0%
- 2008→2024 swing
- -2.8pp toward R · 2008: -36.7pp · 2024: -39.5pp
- All cycles
- 2024: R+39.5 2020: R+32.2 2016: R+38.4 2012: R+40.9 2008: R+36.7
Not yet ingested
- Civics
- —
Market trends
- HPI YoY
- ▲ 3.22%
- Current HPI
- 163.854
- Rent YoY
- —
- Metro
- Lubbock, TX
- State GDP YoY
- ▲ 3.95%
- F500 in state
- 110
Industry mix (Fortune 500 HQ in TX)
| Industry | F500 HQs | Revenue |
|---|---|---|
| Energy | 16 | $1,198B |
|
||
| Technology | 5 | $198B |
|
||
| Engineering / Construction | 4 | $72B |
|
||
| Energy Services | 3 | $60B |
|
||
| Utilities | 3 | $41B |
|
||
| Healthcare | 2 | $330B |
|
||
Price history
1 event — show timeline
- 2026-04-01 Listed $232,500 LARMLS
Cash-flow waterfall
monthlySold comps — $/sqft
last 12 mo · ≤1 miLoading sold comps…