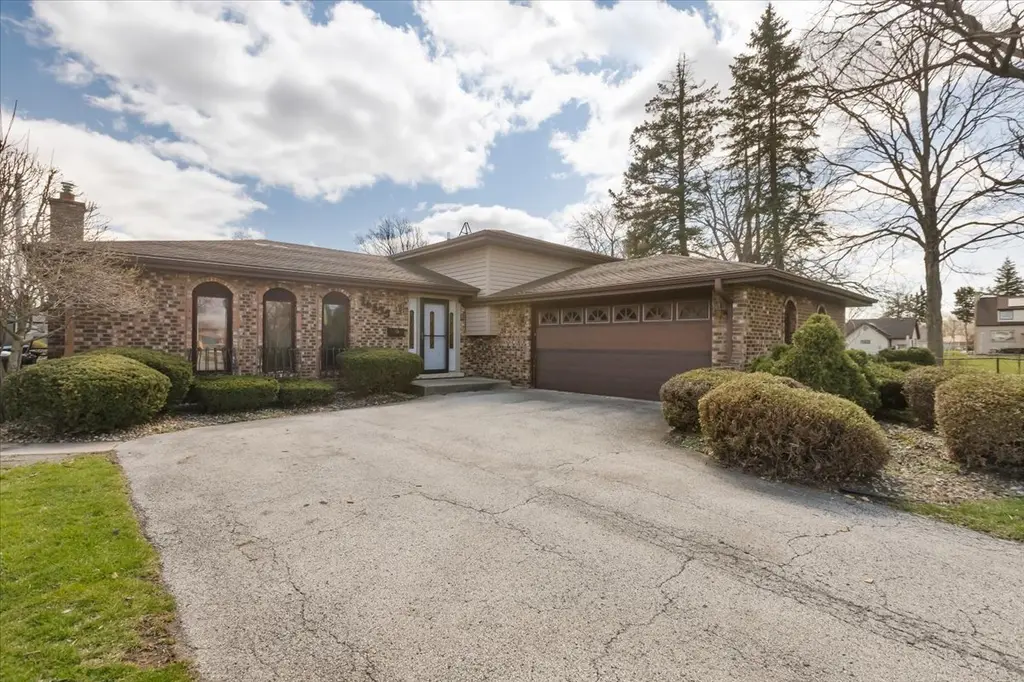
16533 Louis Ave · South Holland, IL
Flood risk 1/10 · Minimal
- FEMA flood zone
- X (unshaded)
- Chance of flooding over 30 yrs
- 0.0%
- Est. flood insurance / yr
- $473 – $860
Fire risk 1/10 · Minimal
- Est. fire insurance / yr
- $804 – $1,492
Heat risk 3/10 · Minor
- Hot days now (above 102°F)
- 7 days/yr
- Hot days in 30 yrs
- 15 days/yr
Wind risk 2/10 · Minimal
- Chance of severe wind over 30 yrs
- —
Air-quality risk 4/10 · Minor
- Unhealthy air days now
- 4 days/yr
- Unhealthy air days in 30 yrs
- 5 days/yr
Risk factors via First Street. Map © Google.
Why this score? — see what drove the D+ grade
The composite is a weighted blend of 9 inputs, each scored 0–100. Each bar is that input's sub-score; the figure is the points it added to the 100-point composite (weight × sub-score).
- Cash flow +23.2/30.0
- 1% rule +7.8/10.0
- DSCR +7.5/10.0
- Livability +3.9/5.0
- Rent growth +2.5/5.0
- Condition / age +2.5/5.0
- ARV discount +1.9/15.0
- Schools +0.7/10.0
- Appreciation +0.0/10.0
$239,900
🖨 Deal sheet (PDF) 📄 Offer letter ✓ Due diligence
Listing remarks
Welcome to this spacious and well-maintained 4-bedroom, 1.5-bath home in the heart of South Holland! This charming property offers three levels of comfortable living space, plus a fully finished basement. The home features a desirable primary bedroom with an en suite full bath. The main and lower levels boast a bright and inviting layout with ample natural light, while the upper level offer generously sized bedrooms with plenty of closet space. Other highlights include a detached 2.5 car garage, large front and backyard, new furnace and Generac generator, and easy access to parks, schools, shopping, and major highways. Move-in ready and waiting for you to make it home!
Key facts
- 2,500 sq ft lot
- 2 garage spots
- Built 1978
Neighborhood map
What this means for you Summary
Snapshot
- This is a 4-bed/2.0-bath single-family listed at $240k.
Deal economics
- At list price, monthly cash flow is $436 ($5k/yr) — positive.
- The deal already cash-flows at list — no discount required.
- Meets the 1% rule at list price ($3k rent vs $240k).
Location & tenants
- Location reads 77/100 on livability (#167 in IL, #3,071 nationally) — a middle-class / working-renter tenant base. Strengths: commute A+, housing A+, cost of living A; Watch: crime C-, amenities C-.
- Thornton Twp Hsd 205 (suburban): math 7% / reading 8% proficiency, ranked #594 of 620 in IL (top 96%) — low school quality limits family demand, transient renter base, plan for 1-2y turnover.
- Zoned schools: Taft School (364 students, 0% FRL); Coolidge Middle School (math 3% / reading 7%, grade F, #636 of 665 statewide, top 98%, 507 students, 0% FRL); Thornwood High School (math 8% / reading 9%, grade F, #584 of 693 statewide, top 85%, 1,996 students, 0% FRL).
- Market conditions: 135 active listings in the ZIP; 5 comparable units currently listed for rent nearby; rentals leasing fast (median 9d on market — plan ~1-2 weeks tenant-placement turnaround); 6,272 units permitted in Cook County in 2024 (4,658 in 5+ unit buildings).
Forward outlook
- Local home prices are declining (-3.0%/yr); year-one equity from $2k of loan paydown is wiped out by about $7k of value loss. Plan a longer hold.
Negotiation context
- Only 11 days on market — expect competitive offers; lowballing is unlikely to land.
- Current owner paid $126k; list at $240k implies a 90% gain — meaningful room to come down on a strong offer.
Risks & watch-outs
- Watch-outs: property tax is 3.1% of price.
Questions for the listing agent
- Built in 1978 — when were the roof, HVAC, electrical panel, plumbing, and water heater last replaced?
- Property tax is high relative to price — has the assessment been appealed recently, and will the sale trigger a re-assessment?
- Is there a deadline driving the sale (1031 exchange, divorce, estate, relocation)? That informs how much negotiation room exists.
- Schools are D-rated, which usually means shorter tenancies and higher turnover. Who's the typical renter profile here, and what's been the actual vacancy rate?
- The area grade is low — what's the realistic commute time and amenity access for the typical tenant pool here? Any planned neighborhood developments (good or bad) we should know about?
- What's the average days-on-market for RENTAL listings here right now (not sales)? A rising rental-DOM trend means longer vacancies and softer asking-rent achievability than the comps imply.
- What's the recent tenant-quality profile in this submarket — average credit score on applications, eviction rate, late-payment / NSF rate, and stable-employment percentage? A property-management company in the area should have these aggregated.
- How much new for-sale + rental construction is in the pipeline within 1–3 miles? Heavy new supply typically softens prices + rents 12–24 months out; constrained supply supports both.
Investment metrics
- 1% rule
- 1.28% ✓
- Cap rate
- 8.47%
- Cash-on-cash
- 7.79%
- DSCR
- 1.35
- GRM
- 6.5
CMA / ARV
- ARV (on-the-fly)
- $213,360
- Comps found
- 12
Show comp detail 12 sales within ~0.75 mi
| Address | Dist | Beds/Ba | Sqft | Sold | Price | $/sf | Match |
|---|---|---|---|---|---|---|---|
| 459 E 166th St | 0.18mi | 4/2.0 | 1,300 (+2%) | 1mo | $235,000 | $181 | 87 |
| 16417 Claire Ln | 0.28mi | 3/2.5 (-1) | 1,209 (-5%) | 2mo | $254,995 | $211 | 71 |
| 239 E 165th St | 0.15mi | 4/2.0 | 1,438 (+13%) | 2mo | $260,100 | $181 | 69 |
| 16721 School St | 0.40mi | 3/1.5 (-1) | 1,344 (+6%) | 3mo | $102,000 | $76 | 62 |
| 16927 Langley Ave | 0.62mi | 3/1.5 (-1) | 1,288 (+1%) | 1mo | $179,900 | $140 | 60 |
| 16728 School St | 0.39mi | 3/1.5 (-1) | 1,170 (-8%) | 2mo | $196,000 | $168 | 60 |
| 16712 Elm St | 0.23mi | 3/2.0 (-1) | 1,446 (+14%) | 2mo | $191,000 | $132 | 60 |
| 702 E 162nd Pl | 0.57mi | 3/2.0 (-1) | 1,400 (+10%) | 1mo | $230,000 | $164 | 50 |
| 823 E 163rd St | 0.66mi | 3/1.0 (-1) | 1,184 (-7%) | 1mo | $197,500 | $167 | 48 |
| 16645 Cottage Grove Ave | 0.58mi | 3/2.0 (-1) | 1,120 (-12%) | 1mo | $211,894 | $189 | 47 |
| 16549 Cottage Grove Ave | 0.57mi | 3/2.0 (-1) | 1,426 (+12%) | 2mo | $219,500 | $154 | 47 |
| 112 E 160th Pl | 0.70mi | 3/2.0 (-1) | 1,141 (-10%) | 2mo | $210,000 | $184 | 44 |
Match score weights: distance 35% · size 25% · config 20% · recency 20%. Top-matched comps best support the ARV.
Projected returns pro-forma
-3.0% appreciation · 3.0% rent growth · sell at horizon
- IRR
- -4.3%
- Equity multiple
- 0.84×
- Total profit
- $-10,866
- Equity at exit
- $35,770
- IRR
- 5.5%
- Equity multiple
- 1.41×
- Total profit
- $27,283
- Equity at exit
- $20,742
Cash invested: $67,172 (down + closing). Projections, not guarantees.
Landlord ↔ Tenant lean methodology
- Overall (STATE)
- 43 Moderately Tenant-Leaning
- State Illinois
- 43 Moderately Tenant-Leaning · D+7
- County
- — inherits STATE
- City
- — inherits STATE
ZIP-level market 60473
- Active inventory
- 135
- Price-to-rent
- 6.5×
Monthly cashflow live
- Estimated rent
- $3,060 high interval (Pro) →
- Mortgage (P&I)
- −$1,258
- Tax from tax record
- −$624 /mo · $7,484/yr
- Insurance
- −$100
- HOA
- −$0
- Vacancy / Maint / Mgmt
- −$643
- Net cashflow
- $436
Break-even live
Sensitivity live
| Price | -10% $572 | -5% $504 | +0% $436 | +5% $368 | +10% $300 |
|---|---|---|---|---|---|
| Rent | -10% $194 | -5% $315 | +0% $436 | +5% $557 | +10% $678 |
| Rate | -1.0pp $557 | -0.5pp $497 | base $436 | +0.5pp $374 | +1.0pp $310 |
UW: 25.0% down · 7.5% · 30yr · 1.5% tax · 5.0% vac · 8.0% maint · 8.0% mgmt
Financing live
Cash to close
- Down payment
- $59,975
- Closing costs
- $7,197
- Reserves months
- —
- Total cash needed
- —
Loan-product check · same deal, 3 products live
Conventional
25% down · 7.5% · 30yr
- Down + closing
- —
- Monthly P&I
- —
- Monthly cashflow
- —
- DSCR
- —
- Eligible?
- —
Personal DTI + credit; lowest rate.
DSCR
20% down · 8.5% · 30yr
- Down + closing
- —
- Monthly P&I
- —
- Monthly cashflow
- —
- DSCR
- —
- Eligible?
- —
No personal income docs; deal must DSCR.
Hard money
10% down · 12.0% · 12mo
- Down + closing
- —
- Monthly P&I
- —
- Monthly cashflow
- —
- DSCR
- —
- Eligible?
- —
Short-term bridge; refi at stabilization.
Rent comps 5 comps
| Address | Beds | Baths | Sqft | Rent | $/sqft | DOM | Units | Dist |
|---|---|---|---|---|---|---|---|---|
| 16246 Dobson Ave South Holland, IL | 3.0 | 2.0 | 1250 | $3,170 | $2.54 | 0d | 1 | 0.86mi |
| 16001 Avalon Ave South Holland, IL | 3.0 | 2.0 | 1136 | $3,330 | $2.93 | 7d | 1 | 1.28mi |
| 15509 Park Ln South Holland, IL | 4.0 | 1.5 | 1200 | $3,400 | $2.83 | 9d | 1 | 1.30mi |
| 15509 Park Ln South Holland, IL | 4.0 | 1.5 | 1200 | $3,400 | $2.83 | 26d | 1 | 1.30mi |
| 16048 Halsted St Unit 2 Harvey, IL | 3.0 | 1.0 | 1091 | $1,650 | $1.51 | 26d | 1 | 1.50mi |
Listing history 7 events
-
2026-06-21days on market $239,900 Active 11 DOM
-
2026-06-18days on market $239,900 Active 8 DOM
-
2026-06-17statusdays on market $239,900 Active 7 DOM
-
2026-04-21status Pending
-
2026-04-14$239,900 Active
-
1990-08-24soldstatus $126,000
-
1990-08-01soldstatus $126,000
ⓘ Source: listings_history table (triggers on properties + properties_extension) + one-shot
backfill from property_details.listing_events for pre-trigger history.
Tax reassessment forecast IL · Partial reset (capped growth)
- Current annual tax
- $7,484 · $624/mo
- Projected year-2 tax
- $7,484 · $624/mo
- Expected delta
- $0/yr ($0/mo · 0.0%)
ⓘ Screening estimate from a state-policy table — verify with the county assessor before closing.
Climate risk First Street
- Flood 1/10 Low FEMA zone X (unshaded) · 0% chance over 30 yrs
- Wildfire 1/10 Low
- Heat 3/10 Moderate 7 d/yr ≥102°F today · 15 d/yr by 30 yrs out
- Wind 2/10 Low
- Air quality 4/10 Moderate 4 unhealthy d/yr today · 5 by 30 yrs out
Nearby sold comps map
Loading sold comps map…
Walkable amenities ~0.75 mi
Loading nearby amenities…
Taxation est. · year 1
- Rental income
- $36,723
- − Mortgage interest
- −$13,438
- − Property taxes
- −$7,484
- − Insurance
- −$1,200
- − Repairs & maintenance
- −$2,938
- − Management
- −$2,938
- − Depreciation
- −$6,979
- Taxable income
- $1,747
- Est. tax owed @ 24.0%
- −$419
- After-tax cash flow
- $4,812/yr
For passive investors: Depreciation is non-cash, so a rental often shows a tax loss while cash-flowing — sheltering income. Rental losses are passive: they offset passive income freely, and up to $25,000/yr can offset ordinary (W-2) income if you actively participate and your MAGI is under $100k (phasing out to $0 by $150k); unused losses carry forward. On sale, claimed depreciation is recaptured at up to 25%, and gains may owe capital-gains tax (a 1031 exchange can defer both). Figures are a year-1 estimate at your 24.0% rate — not tax advice; consult a CPA.
Schools (NCES district)
- District
- Thornton Twp Hsd 205
- NCES district ID
- 1738970
- Math proficiency
- 7% ▬ 0.00%
- Reading proficiency
- 8% ▼ -2.00%
- Median HH income
- $43,392
- Composite
- 6.92/100
- National rank
- #9976
- State rank
- #594 of 620 in IL
Livability — South Holland
- Score
- 77/100
- State rank
- #167
- US rank
- #3071
Category grades
Schools grade is shown separately in the Schools card above.
Census & demographics
- Census place
- South Holland, IL
- City population
- 21,407
- Population (ZIP)
- 21,407
Population outlook (Cook County) Hauer SSP2
- Today (2025)
- 5,347,519 people
- By 2030
- 5,357,703 · +0.2%
- By 2040
- 5,324,924 · -0.4%
- By 2050
- 5,230,762 · -2.2%
- By 2075
- 4,785,735 · -10.5%
- By 2100
- 4,188,836 · -21.7%
Race, ethnicity, and origin ACS 2023
- Neighborhood character
- Predominantly Black (75%)
- Race & ethnicity
- Black 75% White 10% Hispanic / Latino 10% Two or more races 3% Asian 1%
- Hispanic origin (detail)
- Mexican 9% Puerto Rican 1%
- Common ancestry
- Iranian 3% Romanian 2%
- Foreign-born
- 6% · Canada, China
- Languages at home
- 87% English-only · Spanish 8% Other Asian/Pacific 1% Russian/Polish/Slavic 1%
Political lean MEDSL · Cook
- 2024 margin
- Solid D (+42.0) · D 70.4% · R 28.4% · Other 1.2%
- 2008→2024 swing
- -11.4pp toward R · 2008: 53.4pp · 2024: 42.0pp
- All cycles
- 2024: D+42.0 2020: D+50.3 2016: D+53.0 2012: D+49.4 2008: D+53.4
Not yet ingested
- Civics
- —
Market trends
- HPI YoY
- ▼ -114.36%
- Current HPI
- 201.2479
- Rent YoY
- —
- Metro
- —
- State GDP YoY
- ▲ 1.59%
- F500 in state
- 60
Industry mix (Fortune 500 HQ in IL)
| Industry | F500 HQs | Revenue |
|---|---|---|
| Insurance | 4 | $201B |
|
||
| Consumer Goods | 4 | $87B |
|
||
| Industrial Machinery | 3 | $64B |
|
||
| Healthcare | 2 | $55B |
|
||
| Retail / Pharmacy | 1 | $148B |
|
||
| Agriculture / Food | 1 | $86B |
|
||
Price history
+90.4% since first listed4 events — show timeline
- 2026-04-21 Pending — MRED as Distributed by MLS Grid
- 2026-04-14 Listed $239,900 MRED as Distributed by MLS Grid
- 1990-08-24 Sold (Public Records) $126,000 Public Records
- 1990-08-01 Sold (Public Records) $126,000 Public Records
Property tax history
+5.0%/yrLatest (2023): $7,484 · +36.5% YoY. Source: county tax records.
Cash-flow waterfall
monthlySold comps — $/sqft
last 12 mo · ≤1 miLoading sold comps…