 🏗️ New Construction
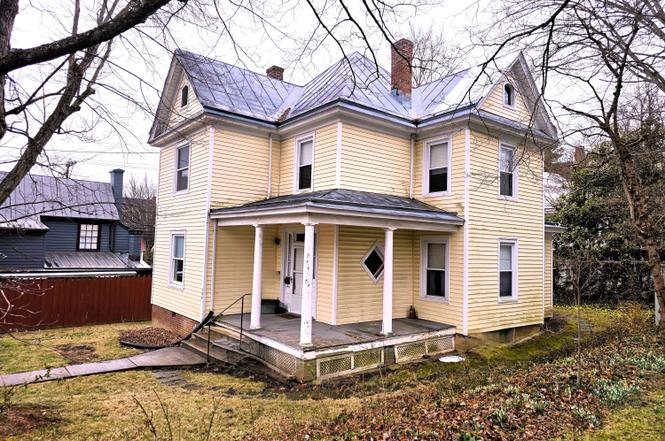
104 W Preston St · Lexington, VA
Flood risk 1/10 · Minimal
- FEMA flood zone
- X (unshaded)
- Chance of flooding over 30 yrs
- 0.0%
- Est. flood insurance / yr
- $473 – $860
Fire risk 3/10 · Minor
- Est. fire insurance / yr
- $666 – $1,236
Heat risk 5/10 · Moderate
- Hot days now (above 102°F)
- 7 days/yr
- Hot days in 30 yrs
- 19 days/yr
Wind risk 2/10 · Minimal
- Chance of severe wind over 30 yrs
- 1.0%
Air-quality risk 1/10 · Minimal
- Unhealthy air days now
- 0 days/yr
- Unhealthy air days in 30 yrs
- 0 days/yr
Risk factors via First Street. Map © Google.
Why this score? — see what drove the F grade
The composite is a weighted blend of 9 inputs, each scored 0–100. Each bar is that input's sub-score; the figure is the points it added to the 100-point composite (weight × sub-score).
- ARV discount +7.5/15.0
- Schools +7.1/10.0
- Cash flow +4.3/30.0
- Livability +4.0/5.0
- Rent growth +2.5/5.0
- Condition / age +2.5/5.0
- 1% rule +0.0/10.0
- DSCR +0.0/10.0
- Appreciation +0.0/10.0
$228,000
🖨 Deal sheet (PDF) 📄 Offer letter ✓ Due diligence
Listing remarks
1904 Victorian Farmhouse nestled in a family-friendly neighborhood steps away from Lexington's vibrant downtown and an easy walk to W & L and VMI. Step back in time & experience the charm and character of this historic home featuring large rooms, high ceilings, wood floors, ornate fireplace, and period millwork throughout. Spacious two-story offers entry foyer with gracious stairway, flanked by roomy living and dining rooms. 4-5 bedrooms and 3 baths provide options for primaries on both levels. Looking for more space, check out expansion possibilities in the walk-up attic with generous headroom, open floor space & gable windows for natural light. Covered front porch &
Key facts
- Victorian farmhouse
- Wood floors
- Large rooms
Tags
Neighborhood map
What this means for you Summary
Snapshot
- This is a 3-bed/1.5-bath single-family listed at $228k.
Deal economics
- At list price, monthly cash flow is $-1k ($-14k/yr) — negative.
- The deal already cash-flows at list — no discount required.
- To meet the 1% rule (rent ≥ 1% of price), the offer needs to be $190k (16.8% below list).
- Recommended offer: $190k (16.8% below list) — sets the bar for 1% rule.
Location & tenants
- Location reads 80/100 on livability (#62 in VA, #1,813 nationally) — a professional / high-income tenant draw. Strengths: crime A+, amenities A+, health & safety A+; Watch: commute F.
- Lexington City Public School District (town): math 82% / reading 88% proficiency, ranked #4 of 131 in VA (top 3%) — strong family-tenant draw, lease renewals of 3-5y typical; only 18% free/reduced lunch — higher-income household profile.
- Zoned schools: Harrington Waddell Elementary (math 82% / reading 87%, grade A+, #71 of 1,108 statewide, top 8%, 324 students, 32% FRL); Lylburn Downing Middle (math 82% / reading 87%, grade A+, #14 of 342 statewide, top 4%, 161 students, 26% FRL).
- Market conditions: 148 active listings in the ZIP; solid renter incomes; 1 units permitted in Lexington city in 2024 (0 in 5+ unit buildings).
Forward outlook
- Local home prices are declining (-3.0%/yr); year-one equity from $3k of loan paydown is wiped out by about $13k of value loss. Plan a longer hold.
- Lexington County population projected at +17% by 2050 — long-run rental-demand tailwind backs the buy-and-hold thesis.
Negotiation context
- Only 5 days on market — expect competitive offers; lowballing is unlikely to land.
Risks & watch-outs
- Watch-outs: built in 1904 — expect roof / HVAC / electrical / plumbing capex.
- Climate carrying-cost: extreme-heat days projected 7→19/yr by 2055 (HVAC capex compounding) — expect insurance premiums to compound above CPI over the hold.
Questions for the listing agent
- What do current leases actually rent for vs. the listed asking? Can we see a recent rent roll and the last 12 months of T-12 income?
- Built in 1904 — when were the roof, HVAC, electrical panel, plumbing, and water heater last replaced?
- Is there a deadline driving the sale (1031 exchange, divorce, estate, relocation)? That informs how much negotiation room exists.
- Schools are A-rated — typically a magnet for longer-tenancy family renters. What's the average tenant stay here, and is there a school-zone premium baked into asking?
- The area grade is low — what's the realistic commute time and amenity access for the typical tenant pool here? Any planned neighborhood developments (good or bad) we should know about?
- What's the average days-on-market for RENTAL listings here right now (not sales)? A rising rental-DOM trend means longer vacancies and softer asking-rent achievability than the comps imply.
- What's the recent tenant-quality profile in this submarket — average credit score on applications, eviction rate, late-payment / NSF rate, and stable-employment percentage? A property-management company in the area should have these aggregated.
- How much new for-sale + rental construction is in the pipeline within 1–3 miles? Heavy new supply typically softens prices + rents 12–24 months out; constrained supply supports both.
Investment metrics
- 1% rule
- 0.43% ✗
- Cap rate
- 3.09%
- Cash-on-cash
- -11.44%
- DSCR
- 0.49
- GRM
- 19.4
CMA / ARV
- ARV (on-the-fly)
- $442,470
- Comps found
- 12
Show comp detail 12 sales within ~0.75 mi
| Address | Dist | Beds/Ba | Sqft | Sold | Price | $/sf | Match |
|---|---|---|---|---|---|---|---|
| 120 S Jefferson St | 0.04mi | 3/2.0 | 1,788 (-13%) | 10mo | $430,000 | $240 | 66 |
| 215 Catalpa Pl | 0.30mi | 3/2.5 | 1,976 (-4%) | 12mo | $425,000 | $215 | 66 |
| 317 Jackson Ave | 0.18mi | 3/3.0 | 2,243 (+9%) | 13mo | $630,000 | $281 | 60 |
| 9 Westside Ct | 0.35mi | 3/1.5 | 1,907 (-7%) | 14mo | $369,000 | $193 | 59 |
| 10 Westside Ct | 0.35mi | 3/2.0 | 1,880 (-9%) | 15mo | $525,000 | $279 | 55 |
| 207 Massie St | 0.44mi | 3/2.0 | 1,800 (-12%) | 7mo | $257,500 | $143 | 51 |
| 409 Wills Rd | 0.73mi | 3/3.0 | 2,240 (+9%) | 1mo | $418,000 | $187 | 44 |
| 23 Fuller St | 0.46mi | 4/2.0 (+1) | 1,800 (-12%) | 11mo | $275,000 | $153 | 42 |
| 114 Colonnade Ave | 0.56mi | 3/2.5 | 1,792 (-13%) | 12mo | $389,000 | $217 | 38 |
| 7 Maple Ln | 0.62mi | 3/3.0 | 1,936 (-6%) | 21mo | $369,000 | $191 | 37 |
| 115 Houston St | 0.44mi | 4/2.0 (+1) | 1,808 (-12%) | 23mo | $440,000 | $243 | 33 |
| 402 Confederate Cir | 0.73mi | 4/3.0 (+1) | 2,276 (+11%) | 9mo | $400,000 | $176 | 30 |
Match score weights: distance 35% · size 25% · config 20% · recency 20%. Top-matched comps best support the ARV.
Projected returns pro-forma
-3.0% appreciation · 3.0% rent growth · sell at horizon
- IRR
- -37.3%
- Equity multiple
- -0.19×
- Total profit
- $-147,139
- Equity at exit
- $65,974
- IRR
- -54.8%
- Equity multiple
- -0.82×
- Total profit
- $-225,832
- Equity at exit
- $38,257
Cash invested: $123,892 (down + closing). Projections, not guarantees.
Landlord ↔ Tenant lean methodology
- Overall (STATE)
- 55 Moderately Landlord-Leaning
- State Virginia
- 55 Moderately Landlord-Leaning · D+2
- County
- — inherits STATE
- City
- — inherits STATE
ZIP-level market 24450
- Home prices YoY
- -22.8%
- Active inventory
- 148
- Price-to-rent
- 10.0×
Monthly cashflow live
- Estimated rent
- $1,897 medium interval (Pro) →
- Mortgage (P&I)
- −$2,320
- Tax from tax record
- −$175 /mo · $2,099/yr
- Insurance
- −$184
- HOA
- −$0
- Vacancy / Maint / Mgmt
- −$398
- Net cashflow
- $-1,181
Break-even live
Sensitivity live
| Price | -10% $-931 | -5% $-1,056 | +0% $-1,181 | +5% $-1,307 | +10% $-1,432 |
|---|---|---|---|---|---|
| Rent | -10% $-1,331 | -5% $-1,256 | +0% $-1,181 | +5% $-1,106 | +10% $-1,031 |
| Rate | -1.0pp $-958 | -0.5pp $-1,069 | base $-1,181 | +0.5pp $-1,296 | +1.0pp $-1,413 |
UW: 25.0% down · 7.5% · 30yr · 1.5% tax · 5.0% vac · 8.0% maint · 8.0% mgmt
Financing live
Cash to close
- Down payment
- $110,618
- Closing costs
- $13,274
- Reserves months
- —
- Total cash needed
- —
Loan-product check · same deal, 3 products live
Conventional
25% down · 7.5% · 30yr
- Down + closing
- —
- Monthly P&I
- —
- Monthly cashflow
- —
- DSCR
- —
- Eligible?
- —
Personal DTI + credit; lowest rate.
DSCR
20% down · 8.5% · 30yr
- Down + closing
- —
- Monthly P&I
- —
- Monthly cashflow
- —
- DSCR
- —
- Eligible?
- —
No personal income docs; deal must DSCR.
Hard money
10% down · 12.0% · 12mo
- Down + closing
- —
- Monthly P&I
- —
- Monthly cashflow
- —
- DSCR
- —
- Eligible?
- —
Short-term bridge; refi at stabilization.
Listing history 2 events
-
2026-03-18status Pending
-
2026-03-13$228,000 Active
ⓘ Source: listings_history table (triggers on properties + properties_extension) + one-shot
backfill from property_details.listing_events for pre-trigger history.
Tax reassessment forecast VA · Resets to sale price
- Current annual tax
- $2,099 · $175/mo
- Projected year-2 tax
- $2,099 · $175/mo
- Expected delta
- $0/yr ($0/mo · 0.0%)
ⓘ Screening estimate from a state-policy table — verify with the county assessor before closing.
Climate risk First Street
- Flood 1/10 Low FEMA zone X (unshaded) · 0% chance over 30 yrs
- Wildfire 3/10 Moderate
- Heat 5/10 Major 7 d/yr ≥102°F today · 19 d/yr by 30 yrs out
- Wind 2/10 Low 100% chance of damaging wind over 30 yrs
- Air quality 1/10 Low 0 unhealthy d/yr today · 0 by 30 yrs out
Nearby sold comps map
Loading sold comps map…
Walkable amenities ~0.75 mi
Loading nearby amenities…
Taxation est. · year 1
- Rental income
- $22,761
- − Mortgage interest
- −$24,785
- − Property taxes
- −$2,099
- − Insurance
- −$2,212
- − Repairs & maintenance
- −$1,821
- − Management
- −$1,821
- − Depreciation
- −$12,872
- Taxable loss
- −$22,850
- Est. tax savings @ 24.0%
- +$5,484
- After-tax cash flow
- $-8,691/yr
For passive investors: Depreciation is non-cash, so a rental often shows a tax loss while cash-flowing — sheltering income. Rental losses are passive: they offset passive income freely, and up to $25,000/yr can offset ordinary (W-2) income if you actively participate and your MAGI is under $100k (phasing out to $0 by $150k); unused losses carry forward. On sale, claimed depreciation is recaptured at up to 25%, and gains may owe capital-gains tax (a 1031 exchange can defer both). Figures are a year-1 estimate at your 24.0% rate — not tax advice; consult a CPA.
Schools (NCES district)
- District
- Lexington City Public School District
- NCES district ID
- 5102220
- Math proficiency
- 82% ▼ -9.00%
- Reading proficiency
- 88% ▬ 0.00%
- Median HH income
- $37,249
- Composite
- 70.57/100
- National rank
- #258
- State rank
- #4 of 131 in VA
Livability — Lexington
- Score
- 80/100
- State rank
- #62
- US rank
- #1813
Category grades
Schools grade is shown separately in the Schools card above.
Census & demographics
- Census place
- Lexington, VA
- County
- Rockbridge County · 17,714 people
- City population
- 17,714
- Metro
- nan
- Population (ZIP)
- 17,714
- Household income
- $76,587
- Rent vs Own
- Severe rent burden
- 429.0
Population outlook (Lexington County) Hauer SSP2
- Today (2025)
- 8,814 people
- By 2030
- 9,156 · +3.9%
- By 2040
- 9,636 · +9.3%
- By 2050
- 10,345 · +17.4%
- By 2075
- 12,696 · +44.0%
- By 2100
- 14,268 · +61.9%
Race, ethnicity, and origin ACS 2023
- Neighborhood character
- Predominantly White (86%)
- Race & ethnicity
- White 86% Two or more races 5% Black 4% Hispanic / Latino 3% Asian 2%
- Common ancestry
- Serbian 4% Italian 2% Slovak 2%
- Foreign-born
- 4% · China, Canada, South Korea
- Languages at home
- 95% English-only · Spanish 2% Chinese 1% Korean 1%
Political lean MEDSL · Lexington
- 2024 margin
- Strong D (+26.7) · D 62.7% · R 36.0% · Other 1.3%
- 2008→2024 swing
- +1.3pp toward D · 2008: 25.4pp · 2024: 26.7pp
- All cycles
- 2024: D+26.7 2020: D+32.0 2016: D+30.6 2012: D+12.6 2008: D+25.4
Not yet ingested
- Civics
- —
Market trends
- HPI YoY
- ▼ -83.84%
- Current HPI
- 283.7394
- Rent YoY
- —
- Metro
- nan
- State GDP YoY
- ▲ 2.40%
- F500 in state
- 50
Industry mix (Fortune 500 HQ in VA)
| Industry | F500 HQs | Revenue |
|---|---|---|
| Aerospace / Defense | 4 | $236B |
|
||
| Technology / Defense | 3 | $32B |
|
||
| Financial Services | 2 | $176B |
|
||
| Utilities | 2 | $27B |
|
||
| Insurance | 2 | $25B |
|
||
| Technology | 2 | $15B |
|
||
Price history
2 events — show timeline
- 2026-03-18 Pending — RHR
- 2026-03-13 Listed $228,000 RHR
Property tax history
+1.9%/yrLatest (2025): $2,099 · +0.0% YoY. Source: county tax records.
Cash-flow waterfall
monthlySold comps — $/sqft
last 12 mo · ≤1 miLoading sold comps…