 Triplex
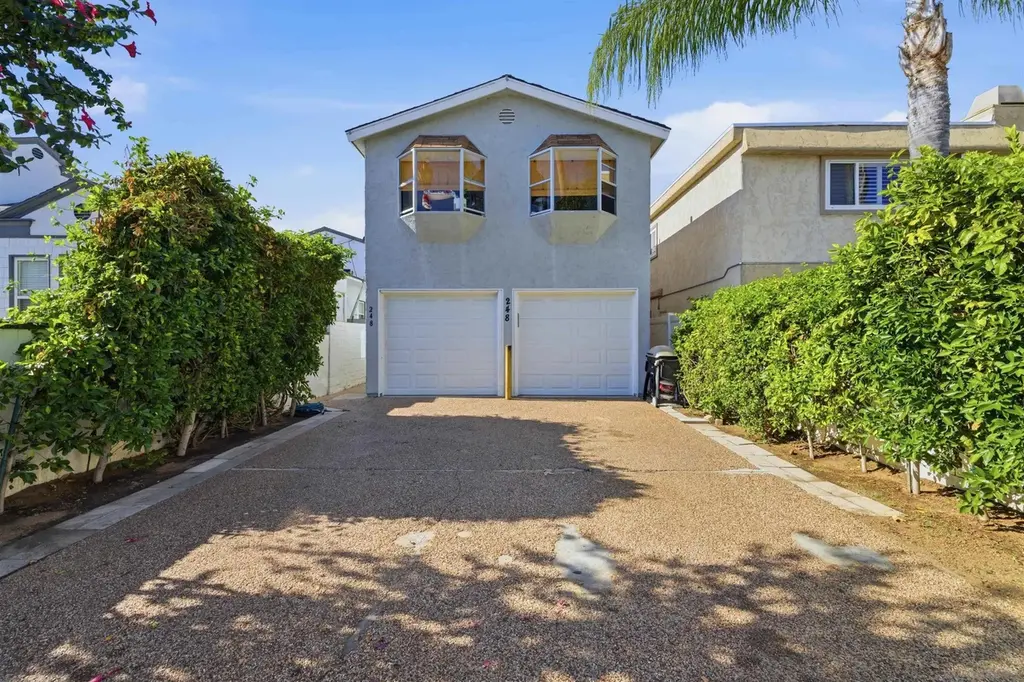
248 Orange Ave · Coronado, CA
Flood risk 1/10 · Minimal
- FEMA flood zone
- X (unshaded)
- Chance of flooding over 30 yrs
- 0.0%
- Est. flood insurance / yr
- $507 – $1,088
Fire risk 1/10 · Minimal
- Est. fire insurance / yr
- $659 – $1,223
Heat risk 4/10 · Minor
- Hot days now (above 84°F)
- 7 days/yr
- Hot days in 30 yrs
- 19 days/yr
Wind risk 1/10 · Minimal
- Chance of severe wind over 30 yrs
- —
Air-quality risk 4/10 · Minor
- Unhealthy air days now
- 4 days/yr
- Unhealthy air days in 30 yrs
- 4 days/yr
Risk factors via First Street. Map © Google.
Why this score? — see what drove the D grade
The composite is a weighted blend of 9 inputs, each scored 0–100. Each bar is that input's sub-score; the figure is the points it added to the 100-point composite (weight × sub-score).
- ARV discount +13.8/15.0
- Schools +6.2/10.0
- Appreciation +5.7/10.0
- Cash flow +5.5/30.0
- Rent growth +3.6/5.0
- Livability +3.5/5.0
- Condition / age +2.5/5.0
- 1% rule +0.2/10.0
- DSCR +0.0/10.0
$2,900,000
🖨 Deal sheet 📄 Offer letter ✓ Due diligence
Multi-family units
County records classify this as Multi-Family (2-4 Unit). Listing-text estimate: 3 units. confirmed
Listing remarks MLS
Price Reduced! Motivated Seller. Well located triplex situated on the famed Orange Avenue- Coronado, CA. Improved space is approximately 2900sf. Strong Unit mix consisting of one 3Bed 2Bath townhome (Unit A), one 2Bed 1.5Bath Townhome (Unit B), and One 2Bed 2Bath unit (Unit C). All units are well taken care of with in-unit laundry, private water heaters, FOUR on-site garages plus FOUR on-site parking spaces! The property was built in 1984. Units have ample natural light. Units are accessed off Orange Avenue and in the rear alleyway. Steps from the Bay and all the retail amenities your tenants will need. Lot size is 3,591sf with dimensions of 26ft x 140ft.
Key facts
- 3,600 sq ft lot
- Built 1984
- Listed 117 days
Neighborhood map
What this means for you Summary
Snapshot
- This is a 3 × 3.0-bed/1.5-bath units multifamily listed at $2.90M.
Deal economics
- At list price, monthly cash flow is $-6k ($-75k/yr) — negative. Per door: $-2k/mo.
- To cash-flow at today's rent, offer at most $1.80M (37.8% below list).
- To meet the 1% rule (rent ≥ 1% of price), the offer needs to be $1.50M (48.3% below list).
- Recommended offer: $1.50M (48.3% below list) — sets the bar for 1% rule.
- Cap rate 3.7% vs local median 0.8% in Coronado — top-decile yield for the area; either an underpriced asset or a hidden risk that comps aren't pricing in. Stress-test before assuming the spread holds.
Location & tenants
- Location reads 69/100 on livability (#249 in CA) — a middle-class / working-renter tenant base. Strengths: schools A+, commute A+, employment A+; Watch: cost of living F, health & safety F.
- Coronado Unified (suburban): math 61% / reading 77% proficiency, ranked #47 of 517 in CA (top 9%) — acceptable for families but not a draw, mixed tenant base, ~2y average lease; only 5% free/reduced lunch — higher-income household profile.
- Market conditions: Rents rising fast (+4.4%/yr); 159 active listings in the ZIP; 9 comparable units currently listed for rent nearby; rentals lingering (median 44d on market — plan ~5-8 weeks vacancy on turnover, expect pricing pressure); 89% of comp listings sitting > 30 days — soft ceiling on asking rent; high-income renter base; 11,759 units permitted in San Diego County in 2024 (7,244 in 5+ unit buildings).
- At $14,988/mo this rent would consume 134% of the median local household income ($135k/yr) (locally 1052% of renters already pay >50% of income on rent) — very limited rent-growth headroom before tenants either downsize or default.
Forward outlook
- In year one you build about $61k of equity ($20k loan paydown + $41k appreciation (1.4% local appreciation)).
- San Diego County population projected at +20% by 2050 — long-run rental-demand tailwind backs the buy-and-hold thesis.
- By year 4, paydown + projected appreciation supports a ~$215k cash-out refi (75% LTV) — recoverable capital for the next deal without selling this one.
Negotiation context
- It's been on market 118 days — a 9% lower offer ($2.64M) is reasonable based on typical stale-listing flexibility.
- 13 sale attempts since 7y ago with the ask held roughly flat each time — persistent listings suggest the price (not the market) is what's stuck; bring a comps-based counter.
- Current owner paid $1.57M; list at $2.90M implies a 85% gain — meaningful room to come down on a strong offer.
Questions for the listing agent
- What do current leases actually rent for vs. the listed asking? Can we see a recent rent roll and the last 12 months of T-12 income?
- It's been on market 118 days. Have you received any prior offers? Is the seller open to a 48% concession, seller financing, or rate buy-down credit?
- Can we see the unit-by-unit rent roll, current vacancy, and any below-market leases? What's the average tenancy length?
- What capital expenditures (roof, boiler, parking lot, exteriors) have been made in the last 5 years, and what's planned in the next 2?
- Why hasn't it sold? Are there any deal-killer items the seller is aware of (foundation, flood, title, zoning, code violations)?
- Is there a deadline driving the sale (1031 exchange, divorce, estate, relocation)? That informs how much negotiation room exists.
- Schools are A-rated — typically a magnet for longer-tenancy family renters. What's the average tenant stay here, and is there a school-zone premium baked into asking?
- The area grade is low — what's the realistic commute time and amenity access for the typical tenant pool here? Any planned neighborhood developments (good or bad) we should know about?
- What's the average days-on-market for RENTAL listings here right now (not sales)? A rising rental-DOM trend means longer vacancies and softer asking-rent achievability than the comps imply.
- What's the recent tenant-quality profile in this submarket — average credit score on applications, eviction rate, late-payment / NSF rate, and stable-employment percentage? A property-management company in the area should have these aggregated.
- How much new apartment / multifamily construction is in the pipeline within 1–3 miles? Heavy new supply (>2% of stock underway) typically softens rents 12–24 months out; light construction supports rent growth.
Investment metrics
- 1% rule
- 0.52% ✗
- Cap rate
- 3.72%
- Cash-on-cash
- -9.18%
- DSCR
- 0.59
- GRM
- 16.1
CMA / ARV
- ARV (median comp)
- $3,369,555
- List price
- $2,900,000
- Delta
- -13.94%
- Verdict
- UNDERPRICED
- Comps
- 7 within 1.0 mi
Show comp detail 2 sales within ~0.75 mi
| Address | Dist | Beds/Ba | Sqft | Sold | Price | $/sf | Match |
|---|---|---|---|---|---|---|---|
| 756-62 G Ave | 0.64mi | 5/5.0 | 2,500 (-12%) | 2mo | $3,620,000 | $1,448 | 48 |
| 515 Palm Ave | 0.29mi | 4/2.0 (-1) | 2,433 (-15%) | 17mo | $2,855,000 | $1,173 | 31 |
Match score weights: distance 35% · size 25% · config 20% · recency 20%. Top-matched comps best support the ARV.
Projected returns pro-forma
1.41% appreciation · 4.44% rent growth · sell at horizon
- IRR
- -6.2%
- Equity multiple
- 0.68×
- Total profit
- $-261,696
- Equity at exit
- $1,052,399
- IRR
- -0.3%
- Equity multiple
- 0.96×
- Total profit
- $-30,201
- Equity at exit
- $1,448,120
Cash invested: $812,000 (down + closing). Projections, not guarantees.
Landlord ↔ Tenant lean methodology
- Overall (STATE)
- 18 Strongly Tenant-Friendly
- State California
- 18 Strongly Tenant-Friendly · D+13
- County
- — inherits STATE
- City
- — inherits STATE
ZIP-level market 92118
- Home prices YoY
- 0.4%
- Rents YoY
- 4.4%
- Active inventory
- 159
- Price-to-rent
- 48.4×
Monthly cashflow live
- Estimated rent
- $14,988 high interval (Pro) →
- Mortgage (P&I)
- −$15,208
- Tax from tax record
- −$1,636 /mo · $19,627/yr
- Insurance
- −$1,208
- HOA
- −$0
- Vacancy / Maint / Mgmt
- −$3,147
- Net cashflow
- $-6,211
Break-even live
3-unit breakdown (identical units grouped — click to expand)
| Units | Beds | Baths | Est. rent |
|---|---|---|---|
| 3× units | 3.0 | 1.5 | $14,988 |
| #1 | 3.0 | 1.5 | $4,996 |
| #2 | 3.0 | 1.5 | $4,996 |
| #3 | 3.0 | 1.5 | $4,996 |
| Total (3 units) | $14,988 | ||
UW: 25.0% down · 7.5% · 30yr · 1.5% tax · 5.0% vac · 8.0% maint · 8.0% mgmt
Financing live
Cash to close
- Down payment
- $725,000
- Closing costs
- $87,000
- Reserves months
- —
- Total cash needed
- —
Loan-product check · same deal, 3 products live
Conventional
25% down · 7.5% · 30yr
- Down + closing
- —
- Monthly P&I
- —
- Monthly cashflow
- —
- DSCR
- —
- Eligible?
- —
Personal DTI + credit; lowest rate.
DSCR
20% down · 8.5% · 30yr
- Down + closing
- —
- Monthly P&I
- —
- Monthly cashflow
- —
- DSCR
- —
- Eligible?
- —
No personal income docs; deal must DSCR.
Hard money
10% down · 12.0% · 12mo
- Down + closing
- —
- Monthly P&I
- —
- Monthly cashflow
- —
- DSCR
- —
- Eligible?
- —
Short-term bridge; refi at stabilization.
Rent comps 9 comps
| Address | Beds | Baths | Sqft | Rent | $/sqft | DOM | Units | Dist |
|---|---|---|---|---|---|---|---|---|
| 237 E Ave Coronado, CA | 6.0 | 3.0 | 2246 | $15,000 | $6.68 | 44d | 1 | 0.10mi |
| 1099 1st St Coronado, CA | 2.0–4.0 | 2.5–4.0 | 3092 | $12,500 | $4.04 | 44d | 4 | 0.20mi |
| 624 1st St Coronado, CA | 4.0 | 3.5 | 2400 | $30,000 | $12.50 | 44d | 1 | 0.31mi |
| 250 Soledad Pl Unit Vacation Rental Coronado, CA | 4.0 | 3.0 | 2500 | $15,000 | $6.00 | 44d | 1 | 0.31mi |
| 170 H Ave Coronado, CA | 5.0 | 4.0 | 2500 | $12,500 | $5.00 | 44d | 1 | 0.36mi |
| 710 E Ave Coronado, CA | 4.0 | 4.5 | 2344 | $20,000 | $8.53 | 3d | 1 | 0.54mi |
| 734 Olive Ave Coronado, CA | 4.0 | 3.5 | 2400 | $8,900 | $3.71 | 44d | 1 | 0.56mi |
| 621 Country Club Ln Coronado, CA | 4.0 | 3.0 | 2140 | $9,000 | $4.21 | 44d | 1 | 0.74mi |
| 1027 Encino Row Coronado, CA | 4.0 | 3.0 | 2097 | $8,750 | $4.17 | 44d | 1 | 0.91mi |
Listing history 41 events
-
2026-06-02days on market $2,900,000 Active 118 DOM
-
2026-06-01days on market $2,900,000 Active 117 DOM
-
2026-05-31days on market $2,900,000 Active 116 DOM
-
2026-03-06price $2,900,000 663-char remark
Show marketing remark (663 chars)
Price Reduced! Motivated Seller. Well located triplex situated on the famed Orange Avenue- Coronado, CA. Improved space is approximately 2900sf. Strong Unit mix consisting of one 3Bed 2Bath townhome (Unit A), one 2Bed 1.5Bath Townhome (Unit B), and One 2Bed 2Bath unit (Unit C). All units are well taken care of with in-unit laundry, private water heaters, FOUR on-site garages plus FOUR on-site parking spaces! The property was built in 1984. Units have ample natural light. Units are accessed off Orange Avenue and in the rear alleyway. Steps from the Bay and all the retail amenities your tenants will need. Lot size is 3,591sf with dimensions of 26ft x 140ft.
-
2026-02-05$3,000,000 Active 663-char remark
Show marketing remark (663 chars)
Price Reduced! Motivated Seller. Well located triplex situated on the famed Orange Avenue- Coronado, CA. Improved space is approximately 2900sf. Strong Unit mix consisting of one 3Bed 2Bath townhome (Unit A), one 2Bed 1.5Bath Townhome (Unit B), and One 2Bed 2Bath unit (Unit C). All units are well taken care of with in-unit laundry, private water heaters, FOUR on-site garages plus FOUR on-site parking spaces! The property was built in 1984. Units have ample natural light. Units are accessed off Orange Avenue and in the rear alleyway. Steps from the Bay and all the retail amenities your tenants will need. Lot size is 3,591sf with dimensions of 26ft x 140ft.
-
2025-06-25status Pending Sale
-
2025-06-24historical
-
2025-06-24$3,290,000 Active
-
2025-03-22historical
-
2025-02-24status Back On Market
-
2025-01-28historical
-
2025-01-21$3,295,000
-
2025-01-08historical
-
2024-10-31price $3,298,999
-
2024-10-17price $3,295,000
-
2024-10-09price $3,225,000
-
2024-09-29price $3,250,000
-
2024-09-16price $3,295,000
-
2024-09-09price $3,490,000
-
2024-07-19$3,498,000 Active
-
2024-07-15historical
-
2019-09-10soldstatus $1,567,500 Sold
-
2019-09-10soldstatus $1,567,500
-
2019-09-10soldstatus $1,567,500
-
2019-07-21historical Backup Offers Accepted
-
2019-07-01$1,599,000 Active
-
2019-07-01$1,599,000
-
2019-06-16historical
-
2019-06-16historical
-
2019-05-07status Active
-
2019-05-06status Active
-
2019-04-29status Pending Sale
-
2019-04-29status Pending
-
2019-04-17$1,600,000 Active
-
2019-04-17$1,600,000 Active
-
2019-03-18historical
-
2019-03-18historical
-
2019-02-17price $1,600,000
-
2019-02-17price $1,600,000
-
2019-01-15$1,700,000 Active
-
2019-01-15$1,700,000 Active
ⓘ Source: listings_history table (triggers on properties + properties_extension) + one-shot
backfill from property_details.listing_events for pre-trigger history.
Tax reassessment forecast CA · Resets to sale price
- Current annual tax
- $19,627 · $1,636/mo
- Projected year-2 tax
- $22,040 · $1,837/mo
- Expected delta
- +$2,413/yr (+$201/mo · 12.3%)
ⓘ Screening estimate from a state-policy table — verify with the county assessor before closing.
Climate risk First Street
- Flood 1/10 Low FEMA zone X (unshaded) · 0% chance over 30 yrs
- Wildfire 1/10 Low
- Heat 4/10 Moderate 7 d/yr ≥84°F today · 19 d/yr by 30 yrs out
- Wind 1/10 Low
- Air quality 4/10 Moderate 4 unhealthy d/yr today · 4 by 30 yrs out
Nearby sold comps map
Loading sold comps map…
Walkable amenities ~0.75 mi
Loading nearby amenities…
Taxation est. · year 1
- Rental income
- $179,856
- − Mortgage interest
- −$162,445
- − Property taxes
- −$19,627
- − Insurance
- −$14,500
- − Repairs & maintenance
- −$14,388
- − Management
- −$14,388
- − Depreciation
- −$84,364
- Taxable loss
- −$129,856
- Est. tax savings @ 24.0%
- +$31,166
- After-tax cash flow
- $-43,370/yr
For passive investors: Depreciation is non-cash, so a rental often shows a tax loss while cash-flowing — sheltering income. Rental losses are passive: they offset passive income freely, and up to $25,000/yr can offset ordinary (W-2) income if you actively participate and your MAGI is under $100k (phasing out to $0 by $150k); unused losses carry forward. On sale, claimed depreciation is recaptured at up to 25%, and gains may owe capital-gains tax (a 1031 exchange can defer both). Figures are a year-1 estimate at your 24.0% rate — not tax advice; consult a CPA.
Schools (NCES district)
- District
- Coronado Unified
- NCES district ID
- 0609870
- Math proficiency
- 61% ▼ -7.00%
- Reading proficiency
- 77% ▼ -1.00%
- Median HH income
- $91,550
- Composite
- 62.45/100
- National rank
- #691
- State rank
- #47 of 517 in CA
Livability — Coronado
- Score
- 69/100
- State rank
- #249
- US rank
- #8296
Category grades
Schools grade is shown separately in the Schools card above.
Census & demographics
- Census place
- Coronado, CA
- County
- San Diego County · 3,178,799 people
- City population
- 18,929
- Metro
- San Diego-Chula Vista-Carlsbad, CA
- Population (ZIP)
- 18,929
- Household income
- $134,534
- Rent vs Own
- Severe rent burden
- 1052.0
Population outlook (San Diego County) Hauer SSP2
- Today (2025)
- 3,678,185 people
- By 2030
- 3,856,546 · +4.8%
- By 2040
- 4,171,407 · +13.4%
- By 2050
- 4,421,607 · +20.2%
- By 2075
- 4,831,599 · +31.4%
- By 2100
- 4,832,502 · +31.4%
Race, ethnicity, and origin ACS 2023
- Neighborhood character
- Predominantly White (70%)
- Race & ethnicity
- White 70% Hispanic / Latino 19% Two or more races 11% Asian 4% Black 2%
- Hispanic origin (detail)
- Mexican 12% Puerto Rican 3%
- Common ancestry
- Italian 4% Lithuanian 4% Slovak 2%
- Foreign-born
- 10% · Canada, Jamaica
- Languages at home
- 84% English-only · Spanish 12% Tagalog/Filipino 1% Other Indo-European 1%
Political lean MEDSL · San Diego
- 2024 margin
- D (+16.8) · D 56.9% · R 40.1% · Other 2.9%
- 2008→2024 swing
- +6.6pp toward D · 2008: 10.2pp · 2024: 16.8pp
- All cycles
- 2024: D+16.8 2020: D+22.8 2016: D+17.8 2012: D+5.1 2008: D+10.2
Not yet ingested
- Civics
- —
Market trends
- HPI YoY
- ▲ 1.41%
- Current HPI
- 360.7979
- Rent YoY
- ▲ 4.44%
- Metro
- San Diego-Chula Vista-Carlsbad, CA
- State GDP YoY
- ▲ 3.21%
- F500 in state
- 116
Industry mix (Fortune 500 HQ in CA)
| Industry | F500 HQs | Revenue |
|---|---|---|
| Technology | 27 | $1,492B |
|
||
| Financial Services | 3 | $174B |
|
||
| Retail | 3 | $44B |
|
||
| Insurance | 3 | $26B |
|
||
| Media / Entertainment | 2 | $115B |
|
||
| Pharmaceuticals / Biotech | 2 | $62B |
|
||
Price history
+70.6% since first listed38 events — show timeline
- 2026-03-06 Price Changed $2,900,000 SDMLS
- 2026-02-05 Listed $3,000,000 SDMLS
- 2025-06-25 Pending — CRMLS
- 2025-06-24 Listed $3,290,000 CRMLS
- 2025-06-24 Listing Removed — CRMLS
- 2025-03-22 Listing Removed — SDMLS
- 2025-02-24 Relisted — SDMLS
- 2025-01-28 Listing Removed — SDMLS
- 2025-01-21 Listed $3,295,000 SDMLS
- 2025-01-08 Listing Removed — SDMLS
- 2024-10-31 Price Changed $3,298,999 SDMLS
- 2024-10-17 Price Changed $3,295,000 SDMLS
- 2024-10-09 Price Changed $3,225,000 SDMLS
- 2024-09-29 Price Changed $3,250,000 SDMLS
- 2024-09-16 Price Changed $3,295,000 SDMLS
- 2024-09-09 Price Changed $3,490,000 SDMLS
- 2024-07-19 Listed $3,498,000 SDMLS
- 2024-07-15 Coming Soon — SDMLS
- 2019-09-10 Sold (Public Records) $1,567,500 Public Records
- 2019-09-10 Sold (MLS) $1,567,500 SDMLS
- 2019-09-10 Sold (MLS) $1,567,500 TheMLS
- 2019-07-21 Contingent — TheMLS
- 2019-07-01 Listed $1,599,000 SDMLS
- 2019-07-01 Listed $1,599,000 TheMLS
- 2019-06-16 Listing Removed — SDMLS
- 2019-06-16 Listing Removed — CRMLS
- 2019-05-07 Relisted — CRMLS
- 2019-05-06 Relisted — SDMLS
- 2019-04-29 Pending — CRMLS
- 2019-04-29 Pending — SDMLS
- 2019-04-17 Listed $1,600,000 SDMLS
- 2019-04-17 Listed $1,600,000 CRMLS
- 2019-03-18 Listing Removed — SDMLS
- 2019-03-18 Listing Removed — CRMLS
- 2019-02-17 Price Changed $1,600,000 SDMLS
- 2019-02-17 Price Changed $1,600,000 CRMLS
- 2019-01-15 Listed $1,700,000 SDMLS
- 2019-01-15 Listed $1,700,000 CRMLS
Property tax history
+8.7%/yrLatest (2025): $19,627 · +2.3% YoY. Source: county tax records.
Cash-flow waterfall
monthlySold comps — $/sqft
last 12 mo · ≤1 miLoading sold comps…