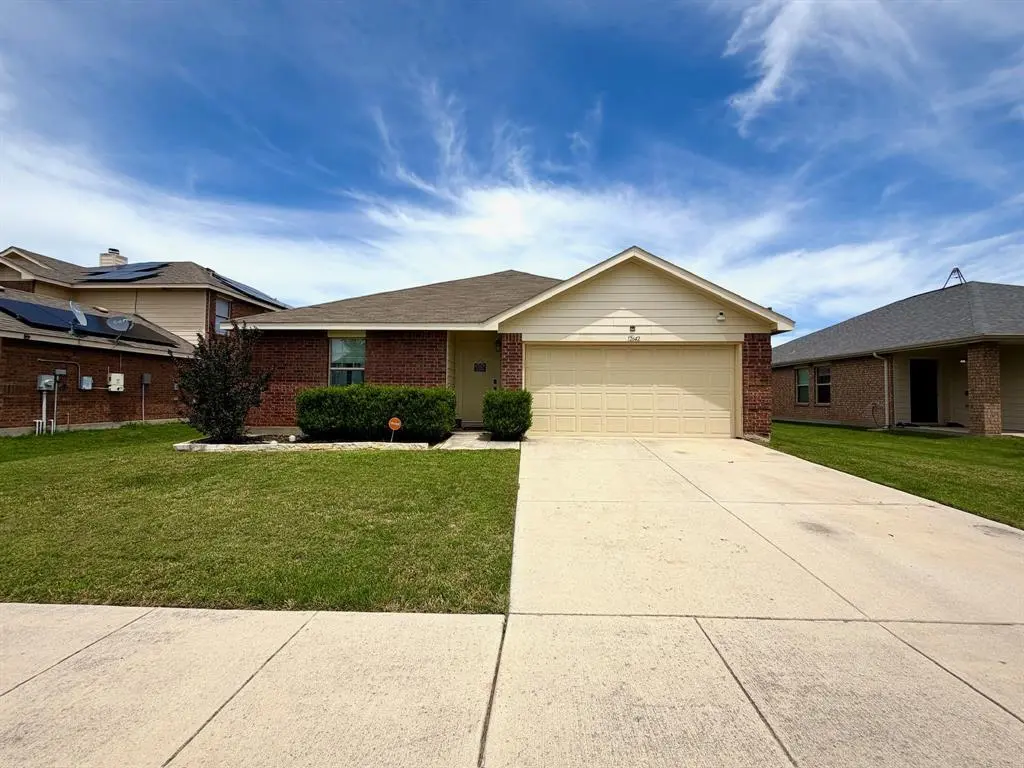
12642 Forest Lawn Rd · Rhome, TX
Flood risk 1/10 · Minimal
- FEMA flood zone
- X (unshaded)
- Chance of flooding over 30 yrs
- 0.0%
- Est. flood insurance / yr
- $507 – $1,088
Fire risk 6/10 · Moderate
- Est. fire insurance / yr
- $1,222 – $2,270
Heat risk 7/10 · Major
- Hot days now (above 109°F)
- 7 days/yr
- Hot days in 30 yrs
- 22 days/yr
Wind risk 4/10 · Minor
- Chance of severe wind over 30 yrs
- 22.0%
Air-quality risk 3/10 · Minor
- Unhealthy air days now
- 3 days/yr
- Unhealthy air days in 30 yrs
- 4 days/yr
Risk factors via First Street. Map © Google.
Why this score? — see what drove the D grade
The composite is a weighted blend of 9 inputs, each scored 0–100. Each bar is that input's sub-score; the figure is the points it added to the 100-point composite (weight × sub-score).
- Appreciation +10.0/10.0
- ARV discount +8.2/15.0
- Cash flow +7.5/30.0
- Schools +4.6/10.0
- Livability +3.7/5.0
- 1% rule +2.8/10.0
- Rent growth +2.5/5.0
- Condition / age +2.5/5.0
- DSCR +1.7/10.0
$289,900
🖨 Deal sheet (PDF) 📄 Offer letter ✓ Due diligence
Listing remarks MLS
Are you looking for a family oriented, secluded neighborhood in the country but still within a few minutes from shopping and restaurants; don't look further. This home is located outside of city limit of Rhome in the highly sought after NWISD. Property has LOW TAXES and qualifies for USDA loan. Features 4 bedrooms and 2 bathrooms, spacious living room, and eat in kitchen with a custom-built pot rack. Carpet in bedrooms, laminate wood floor in hallways and living room, neutral wall color and ceiling fans in all rooms. Sale includes whole house water filtration system with reverse osmosis installed in kitchen sink. Good size backyard with open patio perfect for your four legged friends. Texas Motor Speedway, Tanger Outlet and Bucees 10 minutes away.
Key facts
- Community pool
- Gym
- Quiet neighborhood
Tags
Property features AI
Finance
- Other: No municipal utility district; No special taxing entities
- Financial info: Listing accepts Cash, Conventional, FHA and VA financing
- HOA & community: Mandatory association with quarterly fee ($142); Association provides full use of facilities; HOA managed by Essex Management
Exterior
- Parking: Attached 2-car garage (approx. 19' x 20'); 2 covered parking spaces; Driveway
- Security: Burglar alarm; Smoke detectors
- Utilities: Concrete and curbs present; Outside city limits utilities
- Home design: Single family residence; Single-story; Residential property; Smart home features present
- Construction: Brick construction; Shingle roof; Slab foundation; Built in 2009
- Exterior features: Covered porch(es); Covered patio/porch; Wood fencing; Lot under 0.5 acre (approx. 0.151 acres)
Interior
- Kitchen: Dishwasher; Disposal; Electric oven; Electric range; Water purifier
- Bedrooms: 4 bedrooms (primary bedroom on main level, approx. 15 x 15); Additional bedrooms on main level: 12 x 11, 11 x 11, 12 x 12
- Flooring: Carpet; Ceramic tile; Laminate
- Bathrooms: 2 full bathrooms; Primary bathroom with built-in cabinets, dual sinks, garden tub and separate shower (approx. 9 x 8); Additional bathroom (approx. 8 x 5)
- Heating & cooling: Central air conditioning; Electric heating
- Interior features: Cable TV available; 10 total rooms; One-level layout (single story)
- Laundry & utility: Washer hookup; Electric dryer hookup; Utility room (approx. 6 x 5)
Neighborhood map
What this means for you Summary
Snapshot
- This is a 4-bed/2.0-bath single-family listed at $290k.
Deal economics
- At list price, monthly cash flow is $-354 ($-4k/yr) — negative.
- To cash-flow at today's rent, offer at most $227k (21.6% below list).
- To meet the 1% rule (rent ≥ 1% of price), the offer needs to be $227k (21.8% below list).
- Recommended offer: $227k (21.8% below list) — sets the bar for 1% rule.
- Cap rate 4.8% vs local median 3.7% in Rhome — top-decile yield for the area; either an underpriced asset or a hidden risk that comps aren't pricing in. Stress-test before assuming the spread holds.
Location & tenants
- Location reads 74/100 on livability (#165 in TX, #4,376 nationally) — a middle-class / working-renter tenant base. Strengths: cost of living A+, housing A+, crime A-; Watch: amenities F, commute F.
- Northwest ISD (rural): math 48% / reading 52% proficiency, ranked #120 of 826 in TX (top 14%) — acceptable for families but not a draw, mixed tenant base, ~2y average lease.
- Zoned schools: Prairie View El (math 21% / reading 27%, grade F, #3,221 of 4,322 statewide, top 75%, 631 students, 54% FRL); Chisholm Trail Middle (math 39% / reading 35%, grade F, #756 of 1,662 statewide, top 47%, 684 students, 51% FRL); Northwest H S (math 55% / reading 64%, grade C+, #275 of 1,632 statewide, top 19%, 2,264 students, 0% FRL).
- Market conditions: 264 active listings in the ZIP; 21 comparable units currently listed for rent nearby; rentals at typical pace (median 21d on market — plan ~3-4 weeks tenant-placement turnaround); solid renter incomes; 460 units permitted in Wise County in 2024 (243 in 5+ unit buildings).
Forward outlook
- In year one you build about $31k of equity ($2k loan paydown + $29k appreciation (10.0% local appreciation)).
- Wise County population projected at +27% by 2050 — long-run rental-demand tailwind backs the buy-and-hold thesis.
- By year 2, paydown + projected appreciation supports a ~$50k cash-out refi (75% LTV) — recoverable capital for the next deal without selling this one.
Negotiation context
- It's been on market 20 days — a 2% lower offer ($286k) is reasonable based on typical stale-listing flexibility.
- 4 sale attempts since 17y ago with the ask held roughly flat each time — persistent listings suggest the price (not the market) is what's stuck; bring a comps-based counter.
Risks & watch-outs
- Climate carrying-cost: major wildfire risk; extreme-heat days projected 7→22/yr by 2055 (HVAC capex compounding) — expect insurance premiums to compound above CPI over the hold.
Questions for the listing agent
- What do current leases actually rent for vs. the listed asking? Can we see a recent rent roll and the last 12 months of T-12 income?
- What does the HOA fee cover, when was the last increase, and are there any pending special assessments or reserve-fund shortfalls?
- Is there a deadline driving the sale (1031 exchange, divorce, estate, relocation)? That informs how much negotiation room exists.
- Schools are D-rated, which usually means shorter tenancies and higher turnover. Who's the typical renter profile here, and what's been the actual vacancy rate?
- The area grade is low — what's the realistic commute time and amenity access for the typical tenant pool here? Any planned neighborhood developments (good or bad) we should know about?
- What's the average days-on-market for RENTAL listings here right now (not sales)? A rising rental-DOM trend means longer vacancies and softer asking-rent achievability than the comps imply.
- What's the recent tenant-quality profile in this submarket — average credit score on applications, eviction rate, late-payment / NSF rate, and stable-employment percentage? A property-management company in the area should have these aggregated.
- How much new for-sale + rental construction is in the pipeline within 1–3 miles? Heavy new supply typically softens prices + rents 12–24 months out; constrained supply supports both.
Investment metrics
- 1% rule
- 0.78% ✗
- Cap rate
- 4.83%
- Cash-on-cash
- -5.24%
- DSCR
- 0.77
- GRM
- 10.7
CMA / ARV
- ARV (on-the-fly)
- $294,318
- Comps found
- 12
Show comp detail 12 sales within ~0.75 mi
| Address | Dist | Beds/Ba | Sqft | Sold | Price | $/sf | Match |
|---|---|---|---|---|---|---|---|
| 11559 Antrim Pl | 0.25mi | 4/2.0 | 1,667 (-6%) | 2mo | $273,399 | $164 | 76 |
| 12916 Kingsgate Dr | 0.25mi | 4/2.0 | 1,658 (-6%) | 5mo | $272,000 | $164 | 74 |
| 11527 Gammon Ave | 0.33mi | 4/2.0 | 1,667 (-6%) | 2mo | $309,174 | $185 | 73 |
| 11746 Gammon Ave | 0.36mi | 4/2.0 | 1,667 (-6%) | 1mo | $290,899 | $175 | 73 |
| 12418 Worthington Ln | 0.08mi | 3/2.0 (-1) | 1,599 (-10%) | 5mo | $265,000 | $166 | 71 |
| 11514 Gammon Ave | 0.37mi | 4/2.0 | 1,667 (-6%) | 7mo | $311,534 | $187 | 68 |
| 12419 Lost Rock Dr | 0.44mi | 4/2.0 | 1,667 (-6%) | 7mo | $267,574 | $161 | 64 |
| 11550 Gammon Ln | 0.32mi | 4/2.5 | 1,954 (+10%) | 7mo | $311,534 | $159 | 60 |
| 12826 Carpenter Ln | 0.35mi | 4/2.0 | 1,536 (-13%) | 3mo | $272,500 | $177 | 59 |
| 12403 Lost Rock Dr | 0.36mi | 4/2.5 | 1,954 (+10%) | 7mo | $284,674 | $146 | 59 |
| 11507 Gammon Ave | 0.36mi | 4/2.5 | 1,954 (+10%) | 7mo | $275,699 | $141 | 58 |
| 12321 Shine Ave | 0.39mi | 3/2.0 (-1) | 1,615 (-9%) | 5mo | $269,900 | $167 | 58 |
Match score weights: distance 35% · size 25% · config 20% · recency 20%. Top-matched comps best support the ARV.
Projected returns pro-forma
10.0% appreciation · 3.0% rent growth · sell at horizon
- IRR
- 20.6%
- Equity multiple
- 2.67×
- Total profit
- $135,436
- Equity at exit
- $261,165
- IRR
- 18.7%
- Equity multiple
- 6.14×
- Total profit
- $416,829
- Equity at exit
- $563,212
Cash invested: $81,172 (down + closing). Projections, not guarantees.
Landlord ↔ Tenant lean methodology
- Overall (STATE)
- 87 Strongly Landlord-Friendly
- State Texas
- 87 Strongly Landlord-Friendly · R+5
- County
- — inherits STATE
- City
- — inherits STATE
ZIP-level market 76078
- Home prices YoY
- 6.5%
- Active inventory
- 264
- Price-to-rent
- 10.7×
Monthly cashflow live
- Estimated rent
- $2,268 high interval (Pro) →
- Mortgage (P&I)
- −$1,520
- Tax from tax record
- −$458 /mo · $5,495/yr
- Insurance
- −$121
- HOA
- −$47
- Vacancy / Maint / Mgmt
- −$476
- Net cashflow
- $-354
Break-even live
Sensitivity live
| Price | -10% $-190 | -5% $-272 | +0% $-354 | +5% $-436 | +10% $-519 |
|---|---|---|---|---|---|
| Rent | -10% $-534 | -5% $-444 | +0% $-354 | +5% $-265 | +10% $-175 |
| Rate | -1.0pp $-208 | -0.5pp $-281 | base $-354 | +0.5pp $-430 | +1.0pp $-506 |
UW: 25.0% down · 7.5% · 30yr · 1.5% tax · 5.0% vac · 8.0% maint · 8.0% mgmt
Financing live
Cash to close
- Down payment
- $72,475
- Closing costs
- $8,697
- Reserves months
- —
- Total cash needed
- —
Loan-product check · same deal, 3 products live
Conventional
25% down · 7.5% · 30yr
- Down + closing
- —
- Monthly P&I
- —
- Monthly cashflow
- —
- DSCR
- —
- Eligible?
- —
Personal DTI + credit; lowest rate.
DSCR
20% down · 8.5% · 30yr
- Down + closing
- —
- Monthly P&I
- —
- Monthly cashflow
- —
- DSCR
- —
- Eligible?
- —
No personal income docs; deal must DSCR.
Hard money
10% down · 12.0% · 12mo
- Down + closing
- —
- Monthly P&I
- —
- Monthly cashflow
- —
- DSCR
- —
- Eligible?
- —
Short-term bridge; refi at stabilization.
Rent comps 21 comps
| Address | Beds | Baths | Sqft | Rent | $/sqft | DOM | Units | Dist |
|---|---|---|---|---|---|---|---|---|
| 12221 Big Rock Dr Rhome, TX | 4.0 | 2.5 | 2558 | $2,395 | $0.94 | 26d | 1 | 0.23mi |
| 12808 Kingsgate Dr Rhome, TX | 3.0 | 2.0 | 1397 | $2,000 | $1.43 | 20d | 1 | 0.38mi |
| 12408 Sunland Ave Rhome, TX | 3.0 | 2.0 | 1557 | $1,875 | $1.20 | 45d | 1 | 0.41mi |
| 12630 Carpenter Ln Rhome, TX | 3.0 | 2.0 | 1557 | $1,879 | $1.21 | 26d | 1 | 0.51mi |
| 11846 Arkoma Dr Justin, TX | 3.0 | 2.0 | 1266 | $1,900 | $1.50 | 14d | 1 | 0.52mi |
| 11828 Mancos Trl Justin, TX | 3.0 | 2.0 | 1474 | $1,809 | $1.23 | 45d | 1 | 0.59mi |
| 1201 Viscount St Haslet, TX | 4.0 | 3.0 | 1941 | $2,700 | $1.39 | 14d | 1 | 1.06mi |
| 16009 Wanderer Ln Haslet, TX | 3.0 | 2.0 | 1427 | $1,999 | $1.40 | 1d | 1 | 1.11mi |
| 1020 Valerian Dr Haslet, TX | 4.0 | 3.0 | 2144 | $2,325 | $1.08 | 45d | 1 | 1.16mi |
| 1017 Valerian Dr Haslet, TX | 3.0 | 2.0 | 1734 | $2,250 | $1.30 | 4d | 1 | 1.18mi |
| 16729 Milwaukee St Justin, TX | 4.0 | 2.0 | 1836 | $2,325 | $1.27 | 4d | 1 | 1.19mi |
| 1049 Knightly Ln Haslet, TX | 3.0 | 2.0 | 1721 | $2,195 | $1.28 | 20d | 1 | 1.21mi |
| 1045 Knightly Ln Haslet, TX | 4.0 | 3.0 | 2388 | $2,500 | $1.05 | 45d | 1 | 1.22mi |
| 16617 Porterfield Ln Justin, TX | 3.0 | 2.0 | 1554 | $2,095 | $1.35 | 45d | 1 | 1.22mi |
| 16612 Portage St Justin, TX | 3.0 | 2.0 | 1478 | $2,000 | $1.35 | 45d | 1 | 1.34mi |
| 16537 Milwaukee St Justin, TX | 4.0 | 2.0 | 1653 | $2,249 | $1.36 | 1d | 1 | 1.35mi |
| 16020 Rein Ave Haslet, TX | 4.0 | 3.0 | 2358 | $2,355 | $1.00 | 14d | 1 | 1.39mi |
| 15052 Robin Rd Haslet, TX | 3.0 | 2.0 | 1232 | $1,950 | $1.58 | 45d | 1 | 1.42mi |
| 16029 Pemberly Way Haslet, TX | 3.0 | 2.0 | 1721 | $2,095 | $1.22 | 14d | 1 | 1.44mi |
| 708 Basteen Ln Justin, TX | 4.0 | 2.0 | 1728 | $2,300 | $1.33 | 13d | 1 | 1.46mi |
| 16428 Milwaukee St Justin, TX | 4.0 | 2.0 | 1738 | $2,500 | $1.44 | 45d | 1 | 1.47mi |
HOA detail
- Monthly dues
- $47 · $564/yr
- Likely covers
- water
Listing history 14 events
-
2026-06-22days on market $289,900 Active 20 DOM
-
2026-06-18pricedays on market $289,900 Active 17 DOM
-
2026-06-17days on market $294,900 Active 16 DOM
-
2026-06-16days on market $294,900 Active 15 DOM
-
2026-06-15days on market $294,900 Active 14 DOM
-
2026-06-13days on market $294,900 Active 12 DOM
-
2026-06-09days on market $294,900 Active 8 DOM
-
2026-06-08days on market $294,900 Active 7 DOM
-
2026-06-08price $294,900 Active 6 DOM
-
2026-06-07days on market $300,000 Active 6 DOM
-
2026-06-04days on market $300,000 Active 3 DOM
-
2026-06-03days on market $300,000 Active 2 DOM
-
2026-06-02remarks 693-char remark
-
2026-06-02$300,000 Active 1 DOM
ⓘ Source: listings_history table (triggers on properties + properties_extension) + one-shot
backfill from property_details.listing_events for pre-trigger history.
Tax reassessment forecast TX · Resets to sale price
- Current annual tax
- $5,495 · $458/mo
- Projected year-2 tax
- $5,495 · $458/mo
- Expected delta
- $0/yr ($0/mo · 0.0%)
ⓘ Screening estimate from a state-policy table — verify with the county assessor before closing.
Climate risk First Street
- Flood 1/10 Low FEMA zone X (unshaded) · 0% chance over 30 yrs
- Wildfire 6/10 Major
- Heat 7/10 Severe 7 d/yr ≥109°F today · 22 d/yr by 30 yrs out
- Wind 4/10 Moderate 22% chance of damaging wind over 30 yrs
- Air quality 3/10 Moderate 3 unhealthy d/yr today · 4 by 30 yrs out
Nearby sold comps map
Loading sold comps map…
Walkable amenities ~0.75 mi
Loading nearby amenities…
Taxation est. · year 1
- Rental income
- $27,214
- − Mortgage interest
- −$16,239
- − Property taxes
- −$5,495
- − Insurance
- −$1,450
- − Repairs & maintenance
- −$2,177
- − Management
- −$2,177
- − HOA
- −$564
- − Depreciation
- −$8,433
- Taxable loss
- −$9,322
- Est. tax savings @ 24.0%
- +$2,237
- After-tax cash flow
- $-2,016/yr
For passive investors: Depreciation is non-cash, so a rental often shows a tax loss while cash-flowing — sheltering income. Rental losses are passive: they offset passive income freely, and up to $25,000/yr can offset ordinary (W-2) income if you actively participate and your MAGI is under $100k (phasing out to $0 by $150k); unused losses carry forward. On sale, claimed depreciation is recaptured at up to 25%, and gains may owe capital-gains tax (a 1031 exchange can defer both). Figures are a year-1 estimate at your 24.0% rate — not tax advice; consult a CPA.
Schools (NCES district)
- District
- Northwest ISD
- NCES district ID
- 4833180
- Math proficiency
- 48% ▼ -15.00%
- Reading proficiency
- 52% ▼ -8.00%
- Median HH income
- $85,315
- Composite
- 46.15/100
- National rank
- #2504
- State rank
- #120 of 826 in TX
Livability — Rhome
- Score
- 74/100
- State rank
- #165
- US rank
- #4376
Category grades
Schools grade is shown separately in the Schools card above.
Census & demographics
- County
- Wise County · 49,037 people
- Metro
- Dallas-Fort Worth-Arlington, TX
- Population (ZIP)
- 10,828
- Household income
- $99,866
- Rent vs Own
- Severe rent burden
- 10.0
Population outlook (Wise County) Hauer SSP2
- Today (2025)
- 71,620 people
- By 2030
- 75,858 · +5.9%
- By 2040
- 83,908 · +17.2%
- By 2050
- 90,717 · +26.7%
- By 2075
- 107,583 · +50.2%
- By 2100
- 114,996 · +60.6%
Race, ethnicity, and origin ACS 2023
- Neighborhood character
- Predominantly White (69%)
- Race & ethnicity
- White 69% Hispanic / Latino 24% Two or more races 11% Native American 4% Black 2%
- Hispanic origin (detail)
- Mexican 20% Puerto Rican 3%
- Common ancestry
- Slovak 2% Lithuanian 2% Italian 1%
- Foreign-born
- 6% · Canada
- Languages at home
- 85% English-only · Spanish 14% German/W. Germanic 1%
Political lean MEDSL · Wise
- 2024 margin
- Solid R (+70.0) · D 14.7% · R 84.7%
- 2008→2024 swing
- -14.3pp toward R · 2008: -55.7pp · 2024: -70.0pp
- All cycles
- 2024: R+70.0 2020: R+68.2 2016: R+69.9 2012: R+67.5 2008: R+55.7
Not yet ingested
- Civics
- —
Market trends
- HPI YoY
- ▲ 19.94%
- Current HPI
- 325.22
- Rent YoY
- —
- Metro
- Dallas-Fort Worth-Arlington, TX
- State GDP YoY
- ▲ 3.95%
- F500 in state
- 110
Industry mix (Fortune 500 HQ in TX)
| Industry | F500 HQs | Revenue |
|---|---|---|
| Energy | 16 | $1,198B |
|
||
| Technology | 5 | $198B |
|
||
| Engineering / Construction | 4 | $72B |
|
||
| Energy Services | 3 | $60B |
|
||
| Utilities | 3 | $41B |
|
||
| Healthcare | 2 | $330B |
|
||
Price history
+156.4% since first listed13 events — show timeline
- 2026-06-01 Listed $300,000 NTREIS
- 2023-03-02 Sold (Public Records) — Public Records
- 2023-02-27 Sold (MLS) — NTREIS
- 2023-02-11 Pending — NTREIS
- 2023-02-05 Contingent — NTREIS
- 2023-01-20 Listed $290,000 NTREIS
- 2016-04-11 Listing Removed — NTREIS
- 2016-04-09 Sold (MLS) — NTREIS
- 2016-02-12 Pending — NTREIS
- 2016-01-18 Listed $139,000 NTREIS
- 2010-02-26 Sold (MLS) — NTREIS
- 2010-01-24 Listing Removed — NTREIS
- 2009-12-14 Listed $117,000 NTREIS
Property tax history
+35.3%/yrLatest (2025): $5,495 · +1.8% YoY. Source: county tax records.
Cash-flow waterfall
monthlySold comps — $/sqft
last 12 mo · ≤1 miLoading sold comps…