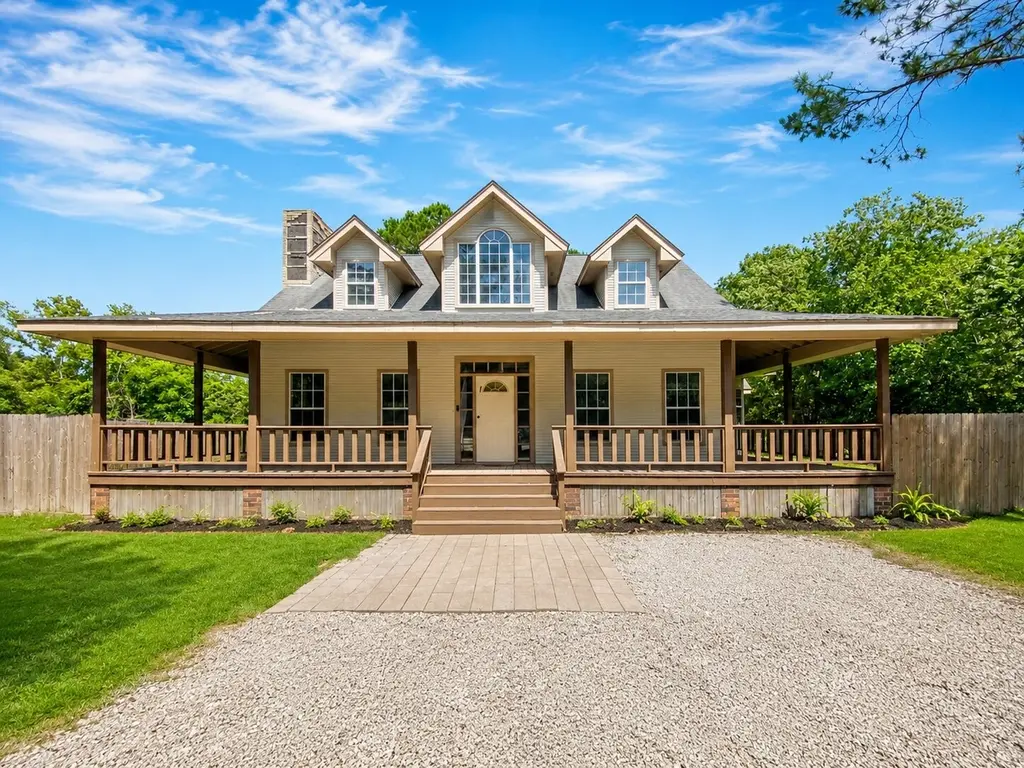
3367 Prairie Dr · League City, TX
Flood risk 5/10 · Moderate
- FEMA flood zone
- X (unshaded)
- Chance of flooding over 30 yrs
- 0.24%
- Est. flood insurance / yr
- $507 – $1,088
Fire risk 3/10 · Minor
- Est. fire insurance / yr
- $1,222 – $2,270
Heat risk 9/10 · Severe
- Hot days now (above 107°F)
- 7 days/yr
- Hot days in 30 yrs
- 26 days/yr
Wind risk 9/10 · Severe
- Chance of severe wind over 30 yrs
- 99.0%
Air-quality risk 2/10 · Minimal
- Unhealthy air days now
- 1 days/yr
- Unhealthy air days in 30 yrs
- 1 days/yr
Risk factors via First Street. Map © Google.
Why this score? — see what drove the D grade
The composite is a weighted blend of 9 inputs, each scored 0–100. Each bar is that input's sub-score; the figure is the points it added to the 100-point composite (weight × sub-score).
- ARV discount +15.0/15.0
- Cash flow +8.2/30.0
- 1% rule +4.0/10.0
- Livability +3.8/5.0
- Schools +3.5/10.0
- Rent growth +2.5/5.0
- Condition / age +2.5/5.0
- DSCR +2.2/10.0
- Appreciation +0.0/10.0
$274,900
🖨 Deal sheet (PDF) 📄 Offer letter ✓ Due diligence
Listing remarks
This spacious home offers incredible potential for buyers looking to customize their dream home. Step outside to your own private retreat perfect for summer gatherings. Conveniently located near shopping, and a variety of dining options, this property offers both value and accessibility. To help visualize this home’s layout and showcase its potential, virtual furnishings may have been added to some of the photos included in this listing.
Key facts
- 0.51 acre lot
- Built 1996
- Listed 2 days
Property features AI
Finance
- Financial info: Lease not considered
Exterior
- Utilities: Public water; Public sewer
- Home design: Residential property; Built in 1996; Entry on first floor
- Construction: Wood siding and other/unknown exterior materials; Composition roof; Pillar/post/pier foundation
- Exterior features: Located in a subdivision
Interior
- Kitchen: Kitchen on the first floor
- Bedrooms: Primary bedroom on the first floor; Two additional bedrooms on the first floor; Two bedrooms on the second floor
- Bathrooms: Three full bathrooms
- Heating & cooling: Central heating (electric); Central air conditioning (electric)
- Interior features: Seven total rooms
Neighborhood map
What this means for you Summary
Snapshot
- This is a 4-bed/2.5-bath single-family listed at $275k.
Deal economics
- At list price, monthly cash flow is $-260 ($-3k/yr) — negative.
- To cash-flow at today's rent, offer at most $229k (16.7% below list).
- To meet the 1% rule (rent ≥ 1% of price), the offer needs to be $247k (10.2% below list).
- Recommended offer: $229k (16.7% below list) — sets the bar for cash-flow.
- Cap rate 5.2% vs local median 2.7% in League City — top-decile yield for the area; either an underpriced asset or a hidden risk that comps aren't pricing in. Stress-test before assuming the spread holds.
Location & tenants
- Location reads 75/100 on livability (#135 in TX, #3,961 nationally) — a middle-class / working-renter tenant base. Strengths: crime A+, employment A+, housing A+; Watch: amenities F, commute F, health & safety F.
- Dickinson ISD (suburban): math 39% / reading 40% proficiency, ranked #366 of 826 in TX (top 44%) — families likely to look elsewhere, expect single-tenant / working-renter base with shorter leases; 60% free/reduced lunch — lower-income household profile, screen leases tightly.
- Zoned schools: Calder Road El (math 56% / reading 50%, grade C, #705 of 4,322 statewide, top 17%, 722 students, 59% FRL); Elva C Lobit Middle (math 31% / reading 27%, grade F, #1,103 of 1,662 statewide, top 67%, 582 students, 52% FRL); Dickinson H S (math 30% / reading 46%, grade F, #880 of 1,632 statewide, top 54%, 3,619 students, 64% FRL) — zoned schools at 58% FRL track the district average.
- Market conditions: Rents soft (-0.1%/yr); 678 active listings in the ZIP; 4 comparable units currently listed for rent nearby; rentals lingering (median 46d on market — plan ~5-8 weeks vacancy on turnover, expect pricing pressure); 75% of comp listings sitting > 30 days — soft ceiling on asking rent; solid renter incomes; 3,258 units permitted in Galveston County in 2024 (0 in 5+ unit buildings).
- This rent runs 33% of the median local income ($89k/yr) — at the standard rent-burdened threshold; future hikes will face affordability resistance.
Forward outlook
- Local home prices are declining (-3.0%/yr); year-one equity from $2k of loan paydown is wiped out by about $8k of value loss. Plan a longer hold.
- Galveston County population projected at +43% by 2050 — long-run rental-demand tailwind backs the buy-and-hold thesis.
Negotiation context
- Only 2 days on market — expect competitive offers; lowballing is unlikely to land.
Risks & watch-outs
- Watch-outs: property tax is 2.9% of price.
- Climate carrying-cost: moderate flood risk; severe wind risk, 99% chance of damaging wind over 30y; extreme-heat days projected 7→26/yr by 2055 (HVAC capex compounding) — expect insurance premiums to compound above CPI over the hold.
Questions for the listing agent
- What do current leases actually rent for vs. the listed asking? Can we see a recent rent roll and the last 12 months of T-12 income?
- Property tax is high relative to price — has the assessment been appealed recently, and will the sale trigger a re-assessment?
- Is there a deadline driving the sale (1031 exchange, divorce, estate, relocation)? That informs how much negotiation room exists.
- Schools are B-rated — typically a magnet for longer-tenancy family renters. What's the average tenant stay here, and is there a school-zone premium baked into asking?
- The area grade is low — what's the realistic commute time and amenity access for the typical tenant pool here? Any planned neighborhood developments (good or bad) we should know about?
- What's the average days-on-market for RENTAL listings here right now (not sales)? A rising rental-DOM trend means longer vacancies and softer asking-rent achievability than the comps imply.
- What's the recent tenant-quality profile in this submarket — average credit score on applications, eviction rate, late-payment / NSF rate, and stable-employment percentage? A property-management company in the area should have these aggregated.
- How much new for-sale + rental construction is in the pipeline within 1–3 miles? Heavy new supply typically softens prices + rents 12–24 months out; constrained supply supports both.
Investment metrics
- 1% rule
- 0.90% ✗
- Cap rate
- 5.16%
- Cash-on-cash
- -4.05%
- DSCR
- 0.82
- GRM
- 9.3
CMA / ARV
- ARV (on-the-fly)
- $406,384
- Comps found
- 12
Show comp detail 12 sales within ~0.75 mi
| Address | Dist | Beds/Ba | Sqft | Sold | Price | $/sf | Match |
|---|---|---|---|---|---|---|---|
| 2110 Yavapai | 0.28mi | 4/2.5 | 2,170 (-6%) | 4mo | $475,000 | $219 | 73 |
| 3701 Pedregal Rd | 0.35mi | 4/2.0 | 2,170 (-6%) | 1mo | $445,791 | $205 | 71 |
| 3120 Sunrise Hill Ln | 0.62mi | 4/2.5 | 2,294 (-1%) | 1mo | $339,900 | $148 | 70 |
| 2590 Mary Ln | 0.69mi | 4/2.5 | 2,336 (+1%) | 7mo | $478,000 | $205 | 60 |
| 1741 Cypress Meadows Dr | 0.73mi | 4/2.0 | 2,332 (+1%) | 7mo | $341,600 | $146 | 56 |
| 3041 Heather Grove Ln | 0.70mi | 4/3.5 | 2,410 (+4%) | 1mo | $319,000 | $132 | 55 |
| 3323 Patagonia St | 0.51mi | 4/3.0 | 2,557 (+11%) | 7mo | $498,750 | $195 | 51 |
| 6803 Peach Mill Ln | 0.72mi | 4/2.0 | 2,100 (-9%) | 2mo | $299,999 | $143 | 48 |
| 6822 Persea Ridge Ln | 0.61mi | 3/2.0 (-1) | 2,047 (-11%) | 0mo | $340,000 | $166 | 45 |
| 6718 Poplar Bend Ln | 0.72mi | 4/2.5 | 2,000 (-13%) | 0mo | $299,000 | $150 | 44 |
| 3304 Patagonia St | 0.67mi | 4/3.0 | 2,557 (+11%) | 6mo | $450,000 | $176 | 44 |
| 3513 Ballena Way | 0.66mi | 3/2.0 (-1) | 1,977 (-14%) | 0mo | $404,000 | $204 | 38 |
Match score weights: distance 35% · size 25% · config 20% · recency 20%. Top-matched comps best support the ARV.
Projected returns pro-forma
-3.0% appreciation · 0.0% rent growth · sell at horizon
- IRR
- -27.1%
- Equity multiple
- 0.12×
- Total profit
- $-68,108
- Equity at exit
- $40,988
- IRR
- -44.5%
- Equity multiple
- -0.40×
- Total profit
- $-107,651
- Equity at exit
- $23,768
Cash invested: $76,972 (down + closing). Projections, not guarantees.
Landlord ↔ Tenant lean methodology
- Overall (STATE)
- 87 Strongly Landlord-Friendly
- State Texas
- 87 Strongly Landlord-Friendly · R+5
- County
- — inherits STATE
- City
- — inherits STATE
ZIP-level market 77539
- Home prices YoY
- -29.8%
- Rents YoY
- -0.1%
- Active inventory
- 678
- Price-to-rent
- 9.3×
Monthly cashflow live
- Estimated rent
- $2,468 medium interval (Pro) →
- Mortgage (P&I)
- −$1,442
- Tax from tax record
- −$653 /mo · $7,838/yr
- Insurance
- −$115
- HOA
- −$0
- Vacancy / Maint / Mgmt
- −$518
- Net cashflow
- $-260
Break-even live
Sensitivity live
| Price | -10% $-104 | -5% $-182 | +0% $-260 | +5% $-338 | +10% $-416 |
|---|---|---|---|---|---|
| Rent | -10% $-455 | -5% $-357 | +0% $-260 | +5% $-163 | +10% $-65 |
| Rate | -1.0pp $-122 | -0.5pp $-190 | base $-260 | +0.5pp $-331 | +1.0pp $-404 |
UW: 25.0% down · 7.5% · 30yr · 1.5% tax · 5.0% vac · 8.0% maint · 8.0% mgmt
Financing live
Cash to close
- Down payment
- $68,725
- Closing costs
- $8,247
- Reserves months
- —
- Total cash needed
- —
Loan-product check · same deal, 3 products live
Conventional
25% down · 7.5% · 30yr
- Down + closing
- —
- Monthly P&I
- —
- Monthly cashflow
- —
- DSCR
- —
- Eligible?
- —
Personal DTI + credit; lowest rate.
DSCR
20% down · 8.5% · 30yr
- Down + closing
- —
- Monthly P&I
- —
- Monthly cashflow
- —
- DSCR
- —
- Eligible?
- —
No personal income docs; deal must DSCR.
Hard money
10% down · 12.0% · 12mo
- Down + closing
- —
- Monthly P&I
- —
- Monthly cashflow
- —
- DSCR
- —
- Eligible?
- —
Short-term bridge; refi at stabilization.
Rent comps 4 comps
| Address | Beds | Baths | Sqft | Rent | $/sqft | DOM | Units | Dist |
|---|---|---|---|---|---|---|---|---|
| 6605 Fallen Breeze Ln Dickinson, TX | 4.0 | 3.0 | 2718 | $2,600 | $0.96 | 45d | 1 | 0.92mi |
| 6563 Jewel Stone Ln Dickinson, TX | 4.0 | 3.0 | 1781 | $2,085 | $1.17 | 45d | 1 | 0.97mi |
| 6542 Turner Fields Ln Dickinson, TX | 3.0 | 2.0 | 1903 | $2,106 | $1.11 | 7d | 1 | 1.02mi |
| 6548 Dream Catcher Ln Dickinson, TX | 4.0 | 2.5 | 2606 | $2,700 | $1.04 | 45d | 1 | 1.20mi |
Listing history 2 events
-
2026-06-21remarks 441-char remark
-
2026-06-21$274,900 Active 2 DOM
ⓘ Source: listings_history table (triggers on properties + properties_extension) + one-shot
backfill from property_details.listing_events for pre-trigger history.
Tax reassessment forecast TX · Resets to sale price
- Current annual tax
- $7,838 · $653/mo
- Projected year-2 tax
- $7,838 · $653/mo
- Expected delta
- $0/yr ($0/mo · 0.0%)
ⓘ Screening estimate from a state-policy table — verify with the county assessor before closing.
Climate risk First Street
- Flood 5/10 Major FEMA zone X (unshaded) · 24% chance over 30 yrs
- Wildfire 3/10 Moderate
- Heat 9/10 Extreme 7 d/yr ≥107°F today · 26 d/yr by 30 yrs out
- Wind 9/10 Extreme 99% chance of damaging wind over 30 yrs
- Air quality 2/10 Low 1 unhealthy d/yr today · 1 by 30 yrs out
Nearby sold comps map
Loading sold comps map…
Walkable amenities ~0.75 mi
Loading nearby amenities…
Taxation est. · year 1
- Rental income
- $29,610
- − Mortgage interest
- −$15,399
- − Property taxes
- −$7,838
- − Insurance
- −$1,374
- − Repairs & maintenance
- −$2,369
- − Management
- −$2,369
- − Depreciation
- −$7,997
- Taxable loss
- −$7,736
- Est. tax savings @ 24.0%
- +$1,857
- After-tax cash flow
- $-1,263/yr
For passive investors: Depreciation is non-cash, so a rental often shows a tax loss while cash-flowing — sheltering income. Rental losses are passive: they offset passive income freely, and up to $25,000/yr can offset ordinary (W-2) income if you actively participate and your MAGI is under $100k (phasing out to $0 by $150k); unused losses carry forward. On sale, claimed depreciation is recaptured at up to 25%, and gains may owe capital-gains tax (a 1031 exchange can defer both). Figures are a year-1 estimate at your 24.0% rate — not tax advice; consult a CPA.
Schools (NCES district)
- District
- Dickinson ISD
- NCES district ID
- 4817070
- Math proficiency
- 39% ▼ -11.00%
- Reading proficiency
- 40% ▼ -2.00%
- Median HH income
- $61,318
- Composite
- 35.16/100
- National rank
- #5005
- State rank
- #366 of 826 in TX
Livability — League City
- Score
- 75/100
- State rank
- #135
- US rank
- #3961
Category grades
Schools grade is shown separately in the Schools card above.
Census & demographics
- County
- Galveston County · 357,330 people
- City population
- 98,109
- Metro
- Houston-The Woodlands-Sugar Land, TX
- Population (ZIP)
- 49,375
- Household income
- $89,111
- Rent vs Own
- Severe rent burden
- 869.0
Population outlook (Galveston County) Hauer SSP2
- Today (2025)
- 390,640 people
- By 2030
- 425,226 · +8.9%
- By 2040
- 493,765 · +26.4%
- By 2050
- 559,698 · +43.3%
- By 2075
- 719,260 · +84.1%
- By 2100
- 819,628 · +109.8%
Race, ethnicity, and origin ACS 2023
- Neighborhood character
- Diverse neighborhood (Simpson 0.64)
- Race & ethnicity
- White 47% Hispanic / Latino 37% Two or more races 19% Black 10% Asian 3%
- Hispanic origin (detail)
- Mexican 29% Puerto Rican 2%
- Common ancestry
- Italian 3% Romanian 2% Lithuanian 1%
- Foreign-born
- 13% · Canada, Vietnam
- Languages at home
- 73% English-only · Spanish 24% Vietnamese 1% Other Indo-European 1%
Political lean MEDSL · Galveston
- 2024 margin
- Strong R (+27.4) · D 35.7% · R 63.1% · Other 1.2%
- 2008→2024 swing
- -7.9pp toward R · 2008: -19.5pp · 2024: -27.4pp
- All cycles
- 2024: R+27.4 2020: R+22.6 2016: R+22.6 2012: R+26.9 2008: R+19.5
Not yet ingested
- Civics
- —
Market trends
- HPI YoY
- ▼ -109.46%
- Current HPI
- 258.0104
- Rent YoY
- ▼ -0.12%
- Metro
- Houston-The Woodlands-Sugar Land, TX
- State GDP YoY
- ▲ 3.95%
- F500 in state
- 110
Industry mix (Fortune 500 HQ in TX)
| Industry | F500 HQs | Revenue |
|---|---|---|
| Energy | 16 | $1,198B |
|
||
| Technology | 5 | $198B |
|
||
| Engineering / Construction | 4 | $72B |
|
||
| Energy Services | 3 | $60B |
|
||
| Utilities | 3 | $41B |
|
||
| Healthcare | 2 | $330B |
|
||
Price history
3 events — show timeline
- 2026-06-19 Listed $274,900 HARMLS
- 2024-10-23 Sold (Public Records) — Public Records
- 2022-06-27 Sold (Public Records) — Public Records
Property tax history
+6.2%/yrLatest (2025): $7,838 · +25.7% YoY. Source: county tax records.
Cash-flow waterfall
monthlySold comps — $/sqft
last 12 mo · ≤1 miLoading sold comps…