616 N Kings Rd Trlr 1 Rd · Nampa, ID
Flood risk 1/10 · Minimal
- FEMA flood zone
- X (unshaded)
- Chance of flooding over 30 yrs
- 0.0%
- Est. flood insurance / yr
- $507 – $1,088
Fire risk 2/10 · Minimal
- Est. fire insurance / yr
- $584 – $1,086
Heat risk 5/10 · Moderate
- Hot days now (above 98°F)
- 7 days/yr
- Hot days in 30 yrs
- 18 days/yr
Wind risk 1/10 · Minimal
- Chance of severe wind over 30 yrs
- —
Air-quality risk 8/10 · Major
- Unhealthy air days now
- 12 days/yr
- Unhealthy air days in 30 yrs
- 18 days/yr
Risk factors via First Street. Map © Google.
Why this score? — see what drove the B- grade
The composite is a weighted blend of 9 inputs, each scored 0–100. Each bar is that input's sub-score; the figure is the points it added to the 100-point composite (weight × sub-score).
- Cash flow +30.0/30.0
- 1% rule +10.0/10.0
- DSCR +10.0/10.0
- ARV discount +7.6/15.0
- Livability +3.6/5.0
- Rent growth +3.4/5.0
- Schools +2.7/10.0
- Condition / age +2.5/5.0
- Appreciation +0.0/10.0
$89,900
🖨 Deal sheet 📄 Offer letter ✓ Due diligence
Listing remarks
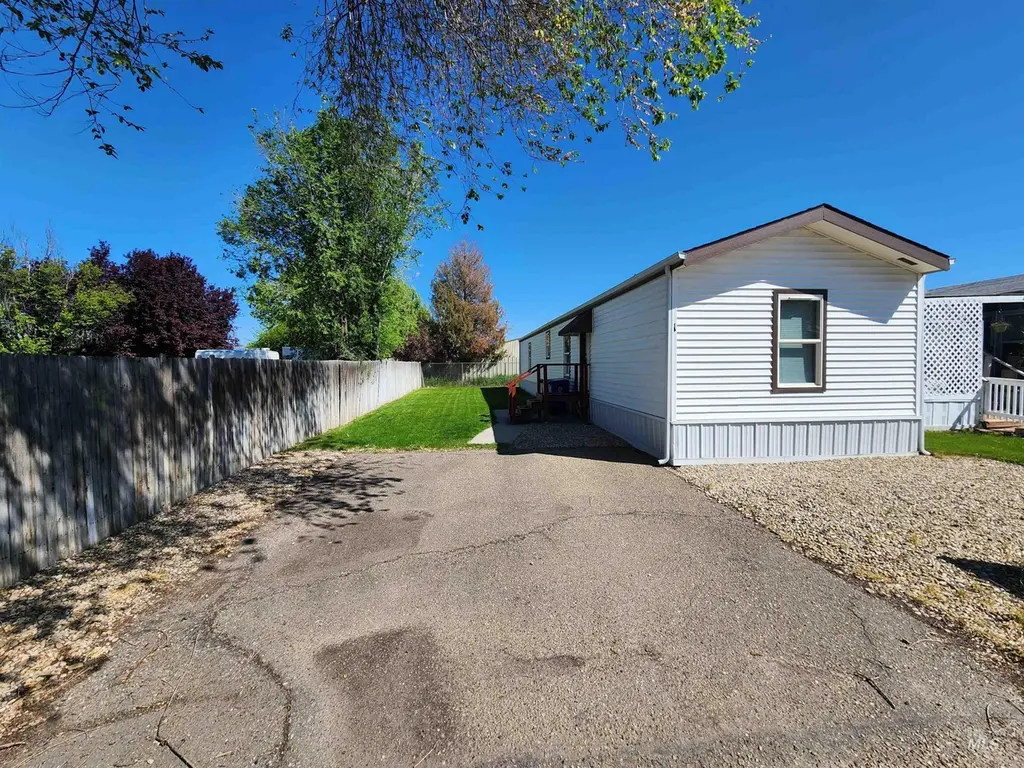
This well-maintained manufactured home is move-in ready and offers excellent value. Recent updates include a newer roof, siding, and skirting, giving the home a fresh and updated exterior. The kitchen comes fully equipped with a refrigerator, stove, and dishwasher, making it easy to settle in right away. Inside, you’ll find a comfortable layout, including a relaxing soaker tub in the master bathroom—perfect for unwinding after a long day. Two window A/C units are also included to help keep the home cool during warmer months. Don’t miss this opportunity to own a clean, updated home that’s ready for its next owner.
Key facts
- Newer roof
- Updated exterior
- Soaker tub
Tags
Property features AI
Exterior
- Utilities: City water service; Sewer connected; Broadband internet available
- Home design: Mobile/manufactured home on a rented lot; Built in 1995
- Construction: Built in 1995; Composition roof
- Exterior features: Composition roof; Manual/irrigation sprinkler system; Located in a mobile home park
Interior
- Kitchen: Breakfast bar; Laminate counters; Dishwasher; Oven/Range (freestanding); Refrigerator; Disposal
- Bedrooms: Master bedroom on main level (approx. 12 x 13); Second bedroom on main level (approx. 11 x 11)
- Flooring: Carpet; Vinyl
- Bathrooms: 2 bathrooms; Master bathroom with double vanity
- Heating & cooling: Electric forced-air heating; Wall/window cooling unit(s)
- Interior features: Bath in master bedroom; Double vanity; Breakfast bar; Laminate counters
- Laundry & utility: Electric water heater
Neighborhood map
What this means for you Summary
Snapshot
- This is a 3-bed/2.0-bath manufactured listed at $90k.
Deal economics
- At list price, monthly cash flow is $871 ($10k/yr) — positive.
- The deal already cash-flows at list — no discount required.
- Meets the 1% rule at list price ($2k rent vs $90k).
- Cap rate 17.9% vs local median 3.2% in Nampa — top-decile yield for the area; either an underpriced asset or a hidden risk that comps aren't pricing in. Stress-test before assuming the spread holds.
Location & tenants
- Location reads 72/100 on livability (#47 in ID) — a middle-class / working-renter tenant base. Strengths: housing A+, health & safety A+, cost of living A-; Watch: employment C-, amenities F, commute F.
- Nampa School District (suburban): math 23% / reading 41% proficiency, ranked #82 of 92 in ID (top 89%) — families likely to look elsewhere, expect single-tenant / working-renter base with shorter leases.
- Zoned schools: Columbia High School (math 16% / reading 52%, grade F, #115 of 169 statewide, top 68%, 1,239 students, 39% FRL).
- Market conditions: Rents rising (+3.4%/yr); 631 active listings in the ZIP; 8 comparable units currently listed for rent nearby; rentals at typical pace (median 21d on market — plan ~3-4 weeks tenant-placement turnaround); solid renter incomes; 3,620 units permitted in Canyon County in 2024 (196 in 5+ unit buildings).
Forward outlook
- Local home prices are declining (-3.0%/yr); year-one equity from $622 of loan paydown is wiped out by about $3k of value loss. Plan a longer hold.
- Canyon County population projected at +41% by 2050 — long-run rental-demand tailwind backs the buy-and-hold thesis.
- At projected returns (-3.0% appreciation + 3.4% rent growth), your $25k cash investment doubles in ~3 years — after that, you're playing with house money.
Negotiation context
- Only 6 days on market — expect competitive offers; lowballing is unlikely to land.
Risks & watch-outs
- Climate carrying-cost: extreme-heat days projected 7→18/yr by 2055 (HVAC capex compounding) — expect insurance premiums to compound above CPI over the hold.
Questions for the listing agent
- Is there a deadline driving the sale (1031 exchange, divorce, estate, relocation)? That informs how much negotiation room exists.
- Schools are D-rated, which usually means shorter tenancies and higher turnover. Who's the typical renter profile here, and what's been the actual vacancy rate?
- What's the average days-on-market for RENTAL listings here right now (not sales)? A rising rental-DOM trend means longer vacancies and softer asking-rent achievability than the comps imply.
- What's the recent tenant-quality profile in this submarket — average credit score on applications, eviction rate, late-payment / NSF rate, and stable-employment percentage? A property-management company in the area should have these aggregated.
- How much new for-sale + rental construction is in the pipeline within 1–3 miles? Heavy new supply typically softens prices + rents 12–24 months out; constrained supply supports both.
Investment metrics
- 1% rule
- 1.97% ✓
- Cap rate
- 17.92%
- Cash-on-cash
- 41.52%
- DSCR
- 2.85
- GRM
- 4.2
CMA / ARV
- ARV (on-the-fly)
- $90,048
- Comps found
- 5
Show comp detail 5 sales within ~0.75 mi
| Address | Dist | Beds/Ba | Sqft | Sold | Price | $/sf | Match |
|---|---|---|---|---|---|---|---|
| 616 N Kings Rd Trlr 1 Rd | 0.00mi | 2/2.0 (-1) | 938 (0%) | 0mo | $89,900 | $96 | 95 |
| 616 N Kings Rd Trlr 9 | 0.00mi | 3/2.0 | 924 (-2%) | 5mo | $99,900 | $108 | 94 |
| 3320 Airport #16 | 0.22mi | 2/2.0 (-1) | 946 (+1%) | 8mo | $83,000 | $88 | 77 |
| 3320 Airport Rd #7 | 0.22mi | 2/1.0 (-1) | 924 (-2%) | 9mo | $95,000 | $103 | 70 |
| 711 Round Vly | 0.73mi | 3/1.0 | 960 (+2%) | 7mo | $79,900 | $83 | 52 |
Match score weights: distance 35% · size 25% · config 20% · recency 20%. Top-matched comps best support the ARV.
Projected returns pro-forma
-3.0% appreciation · 3.44% rent growth · sell at horizon
- IRR
- 38.5%
- Equity multiple
- 2.65×
- Total profit
- $41,651
- Equity at exit
- $13,404
- IRR
- 45.2%
- Equity multiple
- 5.40×
- Total profit
- $110,812
- Equity at exit
- $7,773
Cash invested: $25,172 (down + closing). Projections, not guarantees.
Landlord ↔ Tenant lean methodology
- Overall (STATE)
- 91 Strongly Landlord-Friendly
- State Idaho
- 91 Strongly Landlord-Friendly · R+18
- County
- — inherits STATE
- City
- — inherits STATE
ZIP-level market 83687
- Home prices YoY
- -21.0%
- Rents YoY
- 3.4%
- Active inventory
- 631
- Price-to-rent
- 4.2×
Monthly cashflow live
- Estimated rent
- $1,767 high interval (Pro) →
- Mortgage (P&I)
- −$471
- Tax from tax record
- −$16 /mo · $198/yr
- Insurance
- −$37
- HOA
- −$0
- Vacancy / Maint / Mgmt
- −$371
- Net cashflow
- $871
Break-even live
UW: 25.0% down · 7.5% · 30yr · 1.5% tax · 5.0% vac · 8.0% maint · 8.0% mgmt
Financing live
Cash to close
- Down payment
- $22,475
- Closing costs
- $2,697
- Reserves months
- —
- Total cash needed
- —
Loan-product check · same deal, 3 products live
Conventional
25% down · 7.5% · 30yr
- Down + closing
- —
- Monthly P&I
- —
- Monthly cashflow
- —
- DSCR
- —
- Eligible?
- —
Personal DTI + credit; lowest rate.
DSCR
20% down · 8.5% · 30yr
- Down + closing
- —
- Monthly P&I
- —
- Monthly cashflow
- —
- DSCR
- —
- Eligible?
- —
No personal income docs; deal must DSCR.
Hard money
10% down · 12.0% · 12mo
- Down + closing
- —
- Monthly P&I
- —
- Monthly cashflow
- —
- DSCR
- —
- Eligible?
- —
Short-term bridge; refi at stabilization.
Rent comps 8 comps
| Address | Beds | Baths | Sqft | Rent | $/sqft | DOM | Units | Dist |
|---|---|---|---|---|---|---|---|---|
| 146 N Grant St Nampa, ID | 3.0 | 2.0 | 1100 | $1,900 | $1.73 | 21d | 1 | 0.43mi |
| 4595 Stamm Ln Nampa, ID | 1.0–3.0 | 1.0–2.0 | 933 | $1,927 | $2.07 | 14d | 24 | 0.96mi |
| 610 N Margot Ln , ID | 2.0 | 2.0 | 920 | $1,550 | $1.68 | 3d | 3 | 1.04mi |
| 1311 4th St N Nampa, ID | 2.0 | 1.0 | 864 | $1,475 | $1.71 | 14d | 1 | 1.16mi |
| 38 S White Oak Ln Nampa, ID | 2.0 | 1.0 | 879 | $1,295 | $1.47 | 23d | 1 | 1.34mi |
| 2107 E Whispering Willow Ln Nampa, ID | 2.0 | 1.0 | 858 | $1,295 | $1.51 | 21d | 1 | 1.36mi |
| 16025 N 19th St Unit 104 Nampa, ID | 3.0 | 1.5 | 1095 | $1,545 | $1.41 | 11d | 1 | 1.36mi |
| 2007 E Whispering Willow Ln Unit 101 Nampa, ID | 2.0 | 1.0 | 1000 | $1,300 | $1.30 | 23d | 1 | 1.39mi |
Listing history 2 events
-
2026-05-04status Pending
-
2026-04-28$89,900 Active
ⓘ Source: listings_history table (triggers on properties + properties_extension) + one-shot
backfill from property_details.listing_events for pre-trigger history.
Tax reassessment forecast ID · Resets to sale price
- Current annual tax
- $198 · $16/mo
- Projected year-2 tax
- $620 · $52/mo
- Expected delta
- +$422/yr (+$35/mo · 213.6%)
ⓘ Screening estimate from a state-policy table — verify with the county assessor before closing.
Climate risk First Street
- Flood 1/10 Low FEMA zone X (unshaded) · 0% chance over 30 yrs
- Wildfire 2/10 Low
- Heat 5/10 Major 7 d/yr ≥98°F today · 18 d/yr by 30 yrs out
- Wind 1/10 Low
- Air quality 8/10 Severe 12 unhealthy d/yr today · 18 by 30 yrs out
Nearby sold comps map
Loading sold comps map…
Walkable amenities ~0.75 mi
Loading nearby amenities…
Taxation est. · year 1
- Rental income
- $21,209
- − Mortgage interest
- −$5,036
- − Property taxes
- −$198
- − Insurance
- −$450
- − Repairs & maintenance
- −$1,697
- − Management
- −$1,697
- − Depreciation
- −$2,615
- Taxable income
- $9,517
- Est. tax owed @ 24.0%
- −$2,284
- After-tax cash flow
- $8,166/yr
For passive investors: Depreciation is non-cash, so a rental often shows a tax loss while cash-flowing — sheltering income. Rental losses are passive: they offset passive income freely, and up to $25,000/yr can offset ordinary (W-2) income if you actively participate and your MAGI is under $100k (phasing out to $0 by $150k); unused losses carry forward. On sale, claimed depreciation is recaptured at up to 25%, and gains may owe capital-gains tax (a 1031 exchange can defer both). Figures are a year-1 estimate at your 24.0% rate — not tax advice; consult a CPA.
Schools (NCES district)
- District
- Nampa School District
- NCES district ID
- 1602340
- Math proficiency
- 23% ▼ -13.00%
- Reading proficiency
- 41% ▼ -9.00%
- Median HH income
- $43,576
- Composite
- 27.18/100
- National rank
- #7022
- State rank
- #82 of 92 in ID
Livability — Nampa
- Score
- 72/100
- State rank
- #47
- US rank
- #6250
Category grades
Schools grade is shown separately in the Schools card above.
Census & demographics
- Census place
- Nampa, ID
- County
- Canyon County · 235,358 people
- City population
- 142,249
- Metro
- Boise City, ID
- Population (ZIP)
- 43,135
- Household income
- $76,682
- Rent vs Own
- Severe rent burden
- 683.0
Population outlook (Canyon County) Hauer SSP2
- Today (2025)
- 248,853 people
- By 2030
- 269,596 · +8.3%
- By 2040
- 311,081 · +25.0%
- By 2050
- 350,809 · +41.0%
- By 2075
- 441,884 · +77.6%
- By 2100
- 505,641 · +103.2%
Race, ethnicity, and origin ACS 2023
- Neighborhood character
- Predominantly White (71%)
- Race & ethnicity
- White 71% Hispanic / Latino 21% Two or more races 11% Black 2% Native American 1%
- Hispanic origin (detail)
- Mexican 18%
- Common ancestry
- Italian 4% Slovak 3% Lithuanian 2%
- Foreign-born
- 7% · Canada
- Languages at home
- 85% English-only · Spanish 12% Russian/Polish/Slavic 1%
Political lean MEDSL · Canyon
- 2024 margin
- Solid R (+46.6) · D 25.4% · R 72.0% · Other 2.5%
- 2008→2024 swing
- -11.4pp toward R · 2008: -35.2pp · 2024: -46.6pp
- All cycles
- 2024: R+46.6 2020: R+39.7 2016: R+41.8 2012: R+37.1 2008: R+35.2
Not yet ingested
- Civics
- —
Market trends
- HPI YoY
- ▼ -103.50%
- Current HPI
- 388.8148
- Rent YoY
- ▲ 3.44%
- Metro
- Boise City, ID
- State GDP YoY
- ▲ 4.51%
- F500 in state
- 6
Industry mix (Fortune 500 HQ in ID)
| Industry | F500 HQs | Revenue |
|---|---|---|
| Retail | 1 | $79B |
|
||
| Technology | 1 | $25B |
|
||
| Food / Agriculture | 1 | $6B |
|
||
Price history
2 events — show timeline
- 2026-05-04 Pending — IMLS
- 2026-04-28 Listed $89,900 IMLS
Property tax history
+2.9%/yrLatest (2025): $198 · +37.1% YoY. Source: county tax records.
Cash-flow waterfall
monthlySold comps — $/sqft
last 12 mo · ≤1 miLoading sold comps…