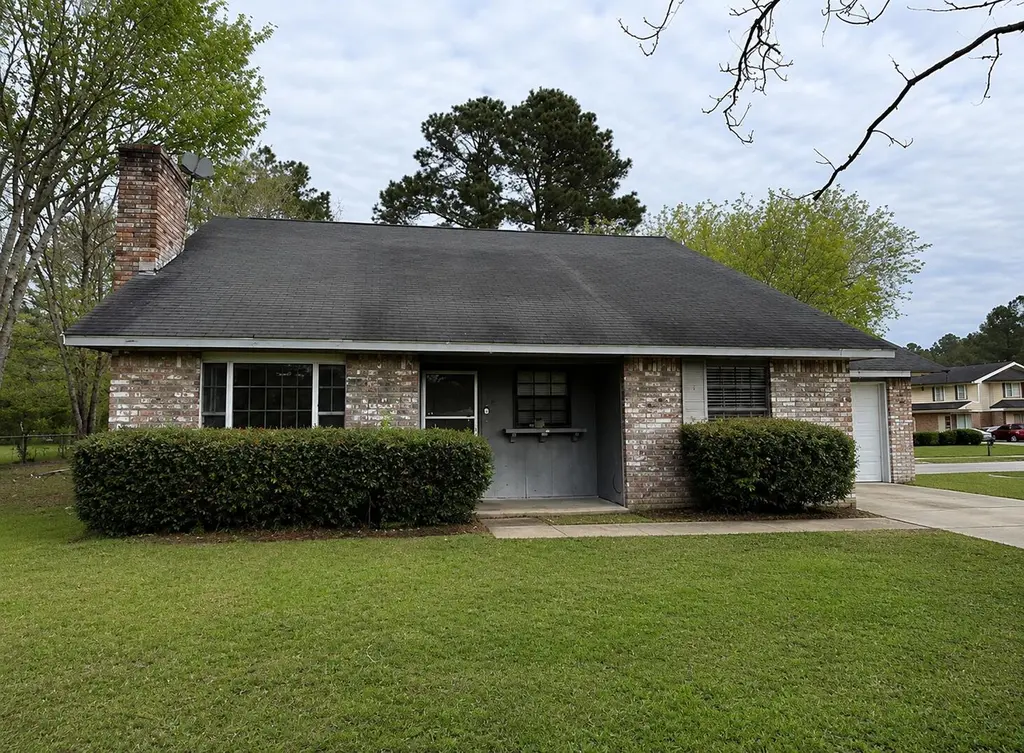
484 Nila Sue · New Llano, LA
Flood risk 1/10 · Minimal
- FEMA flood zone
- X (unshaded)
- Chance of flooding over 30 yrs
- 0.0%
- Est. flood insurance / yr
- $507 – $1,088
Fire risk 3/10 · Minor
- Est. fire insurance / yr
- $1,269 – $2,357
Heat risk 8/10 · Major
- Hot days now (above 110°F)
- 7 days/yr
- Hot days in 30 yrs
- 21 days/yr
Wind risk 8/10 · Major
- Chance of severe wind over 30 yrs
- 99.0%
Air-quality risk 1/10 · Minimal
- Unhealthy air days now
- 0 days/yr
- Unhealthy air days in 30 yrs
- 0 days/yr
Risk factors via First Street. Map © Google.
Why this score? — see what drove the B grade
The composite is a weighted blend of 9 inputs, each scored 0–100. Each bar is that input's sub-score; the figure is the points it added to the 100-point composite (weight × sub-score).
- Cash flow +23.4/30.0
- ARV discount +15.0/15.0
- DSCR +7.5/10.0
- Appreciation +7.1/10.0
- 1% rule +5.4/10.0
- Schools +3.6/10.0
- Livability +3.2/5.0
- Rent growth +2.5/5.0
- Condition / age +2.5/5.0
$121,000
🖨 Deal sheet (PDF) 📄 Offer letter ✓ Due diligence
Listing remarks MLS
Home has been a rental is currently generating income. This home sits on a large corner lot with fenced in back yard. It has 3 bedrooms and 2 bathrooms with a huge living room with fireplace. Upstairs has 2 bedrooms with a full bath. Close to all the amenities and only 15 minutes to Fort Polk.
Key facts
- Large corner lot
- Fenced in back yard
- Close to amenities
Tags
Neighborhood map
What this means for you Summary
Snapshot
- This is a 3-bed/2.0-bath single-family listed at $121k.
Deal economics
- At list price, monthly cash flow is $224 ($3k/yr) — positive.
- The deal already cash-flows at list — no discount required.
- Meets the 1% rule at list price ($1k rent vs $121k).
- Recommended offer: $114k (6.0% below list) — sets the bar for market timing.
Location & tenants
- Location reads 63/100 on livability (#190 in LA) — a middle-class / working-renter tenant base. Strengths: cost of living A+, housing A+, crime B+; Watch: health & safety C-, amenities F, commute F.
- Vernon Parish (rural): math 35% / reading 51% proficiency, ranked #18 of 98 in LA (top 18%) — families likely to look elsewhere, expect single-tenant / working-renter base with shorter leases.
- Zoned schools: Rosepine Elementary School (math 25% / reading 50%, grade F, #247 of 646 statewide, top 39%, 830 students, 55% FRL); Vernon Middle School (math 30% / reading 41%, grade F, #91 of 218 statewide, top 42%, 477 students, 60% FRL); Leesville High School (math 32% / reading 54%, grade F, #66 of 265 statewide, top 25%, 884 students, 47% FRL).
- Market conditions: 14 active listings in the ZIP; 26 units permitted in Vernon Parish in 2024 (0 in 5+ unit buildings).
Forward outlook
- In year one you build about $6k of equity ($837 loan paydown + $5k appreciation (4.2% local appreciation)).
- Vernon County population projected at -25% by 2050 — secular population decline; favor cash flow + early exit over multi-decade hold.
- At projected returns (4.2% appreciation + 3.0% rent growth), your $34k cash investment doubles in ~4 years — after that, you're playing with house money.
- By year 6, paydown + projected appreciation supports a ~$31k cash-out refi (75% LTV) — recoverable capital for the next deal without selling this one.
Negotiation context
- It's been on market 63 days — a 6% lower offer ($114k) is reasonable based on typical stale-listing flexibility.
- 2 sale attempts since 6y ago with the ask held roughly flat each time — persistent listings suggest the price (not the market) is what's stuck; bring a comps-based counter.
Risks & watch-outs
- Climate carrying-cost: severe wind risk, 99% chance of damaging wind over 30y; extreme-heat days projected 7→21/yr by 2055 (HVAC capex compounding) — expect insurance premiums to compound above CPI over the hold.
Questions for the listing agent
- It's been on market 63 days. Have you received any prior offers? Is the seller open to a 6% concession, seller financing, or rate buy-down credit?
- Why hasn't it sold? Are there any deal-killer items the seller is aware of (foundation, flood, title, zoning, code violations)?
- Is there a deadline driving the sale (1031 exchange, divorce, estate, relocation)? That informs how much negotiation room exists.
- Schools are F-rated, which usually means shorter tenancies and higher turnover. Who's the typical renter profile here, and what's been the actual vacancy rate?
- What's the average days-on-market for RENTAL listings here right now (not sales)? A rising rental-DOM trend means longer vacancies and softer asking-rent achievability than the comps imply.
- What's the recent tenant-quality profile in this submarket — average credit score on applications, eviction rate, late-payment / NSF rate, and stable-employment percentage? A property-management company in the area should have these aggregated.
- How much new for-sale + rental construction is in the pipeline within 1–3 miles? Heavy new supply typically softens prices + rents 12–24 months out; constrained supply supports both.
Investment metrics
- 1% rule
- 1.04% ✓
- Cap rate
- 8.51%
- Cash-on-cash
- 7.92%
- DSCR
- 1.35
- GRM
- 8.0
CMA / ARV
- ARV (median comp)
- $146,296
- List price
- $121,000
- Delta
- -17.29%
- Verdict
- UNDERPRICED
- Comps
- 20 within 1.0 mi
Show comp detail 4 sales within ~0.75 mi
| Address | Dist | Beds/Ba | Sqft | Sold | Price | $/sf | Match |
|---|---|---|---|---|---|---|---|
| 805 Stanton St | 0.62mi | 3/2.0 | 1,816 (+4%) | 16mo | $235,000 | $129 | 51 |
| 109 Burnley Dr | 0.63mi | 3/2.5 | 1,944 (+11%) | 5mo | $60,000 | $31 | 46 |
| 115 Jennifer Dr | 0.60mi | 4/2.0 (+1) | 1,873 (+7%) | 20mo | $217,000 | $116 | 39 |
| 112 Franklin St | 0.61mi | 3/2.0 | 1,522 (-13%) | 16mo | $155,000 | $102 | 36 |
Match score weights: distance 35% · size 25% · config 20% · recency 20%. Top-matched comps best support the ARV.
Projected returns pro-forma
4.16% appreciation · 3.0% rent growth · sell at horizon
- IRR
- 17.7%
- Equity multiple
- 2.07×
- Total profit
- $36,363
- Equity at exit
- $62,456
- IRR
- 18.3%
- Equity multiple
- 3.97×
- Total profit
- $100,592
- Equity at exit
- $103,046
Cash invested: $33,880 (down + closing). Projections, not guarantees.
Landlord ↔ Tenant lean methodology
- Overall (STATE)
- 90 Strongly Landlord-Friendly
- State Louisiana
- 90 Strongly Landlord-Friendly · R+12
- County
- — inherits STATE
- City
- — inherits STATE
ZIP-level market 71461
- Home prices YoY
- 3.8%
- Active inventory
- 14
- Price-to-rent
- 8.0×
Monthly cashflow live
- Estimated rent
- $1,260 medium interval (Pro) →
- Mortgage (P&I)
- −$635
- Tax from tax record
- −$87 /mo · $1,046/yr
- Insurance
- −$50
- HOA
- −$0
- Vacancy / Maint / Mgmt
- −$265
- Net cashflow
- $224
Break-even live
Sensitivity live
| Price | -10% $292 | -5% $258 | +0% $224 | +5% $189 | +10% $155 |
|---|---|---|---|---|---|
| Rent | -10% $124 | -5% $174 | +0% $224 | +5% $273 | +10% $323 |
| Rate | -1.0pp $285 | -0.5pp $254 | base $224 | +0.5pp $192 | +1.0pp $160 |
UW: 25.0% down · 7.5% · 30yr · 1.5% tax · 5.0% vac · 8.0% maint · 8.0% mgmt
Financing live
Cash to close
- Down payment
- $30,250
- Closing costs
- $3,630
- Reserves months
- —
- Total cash needed
- —
Loan-product check · same deal, 3 products live
Conventional
25% down · 7.5% · 30yr
- Down + closing
- —
- Monthly P&I
- —
- Monthly cashflow
- —
- DSCR
- —
- Eligible?
- —
Personal DTI + credit; lowest rate.
DSCR
20% down · 8.5% · 30yr
- Down + closing
- —
- Monthly P&I
- —
- Monthly cashflow
- —
- DSCR
- —
- Eligible?
- —
No personal income docs; deal must DSCR.
Hard money
10% down · 12.0% · 12mo
- Down + closing
- —
- Monthly P&I
- —
- Monthly cashflow
- —
- DSCR
- —
- Eligible?
- —
Short-term bridge; refi at stabilization.
Listing history 19 events
-
2026-06-19days on market $121,000 Active 63 DOM
-
2026-06-18days on market $121,000 Active 62 DOM
-
2026-06-17days on market $121,000 Active 61 DOM
-
2026-06-16days on market $121,000 Active 60 DOM
-
2026-06-15days on market $121,000 Active 59 DOM
-
2026-06-14days on market $121,000 Active 57 DOM
-
2026-06-12days on market $121,000 Active 56 DOM
-
2026-06-09days on market $121,000 Active 53 DOM
-
2026-06-08days on market $121,000 Active 52 DOM
-
2026-06-07days on market $121,000 Active 51 DOM
-
2026-06-07days on market $121,000 Active 50 DOM
-
2026-06-04days on market $121,000 Active 47 DOM
-
2026-06-02days on market $121,000 Active 46 DOM
-
2026-06-01days on market $121,000 Active 45 DOM
-
2026-05-31days on market $121,000 Active 44 DOM
-
2026-05-31days on market $121,000 Active 43 DOM
-
2026-04-17$121,000 Active 294-char remark
Show marketing remark (294 chars)
Home has been a rental is currently generating income. This home sits on a large corner lot with fenced in back yard. It has 3 bedrooms and 2 bathrooms with a huge living room with fireplace. Upstairs has 2 bedrooms with a full bath. Close to all the amenities and only 15 minutes to Fort Polk.
-
2022-08-09soldstatus 303-char remark
Show marketing remark (303 chars)
Home is under a rental lease through early November, 2021. This home is on a large corner lot with a fenced in back yard, this home has 3 bedrooms, 2 baths, with a huge living room with fireplace, 2 bedrooms, upstairs with a full bath. Home has a renter in a lease. Would be best suited for an investor.
-
2020-11-13$100,000 303-char remark
Show marketing remark (303 chars)
Home is under a rental lease through early November, 2021. This home is on a large corner lot with a fenced in back yard, this home has 3 bedrooms, 2 baths, with a huge living room with fireplace, 2 bedrooms, upstairs with a full bath. Home has a renter in a lease. Would be best suited for an investor.
ⓘ Source: listings_history table (triggers on properties + properties_extension) + one-shot
backfill from property_details.listing_events for pre-trigger history.
Tax reassessment forecast LA · Resets to sale price
- Current annual tax
- $1,046 · $87/mo
- Projected year-2 tax
- $1,046 · $87/mo
- Expected delta
- $0/yr ($0/mo · 0.0%)
ⓘ Screening estimate from a state-policy table — verify with the county assessor before closing.
Climate risk First Street
- Flood 1/10 Low FEMA zone X (unshaded) · 0% chance over 30 yrs
- Wildfire 3/10 Moderate
- Heat 8/10 Severe 7 d/yr ≥110°F today · 21 d/yr by 30 yrs out
- Wind 8/10 Severe 99% chance of damaging wind over 30 yrs
- Air quality 1/10 Low 0 unhealthy d/yr today · 0 by 30 yrs out
Nearby sold comps map
Loading sold comps map…
Walkable amenities ~0.75 mi
Loading nearby amenities…
Taxation est. · year 1
- Rental income
- $15,124
- − Mortgage interest
- −$6,778
- − Property taxes
- −$1,046
- − Insurance
- −$605
- − Repairs & maintenance
- −$1,210
- − Management
- −$1,210
- − Depreciation
- −$3,520
- Taxable income
- $756
- Est. tax owed @ 24.0%
- −$181
- After-tax cash flow
- $2,502/yr
For passive investors: Depreciation is non-cash, so a rental often shows a tax loss while cash-flowing — sheltering income. Rental losses are passive: they offset passive income freely, and up to $25,000/yr can offset ordinary (W-2) income if you actively participate and your MAGI is under $100k (phasing out to $0 by $150k); unused losses carry forward. On sale, claimed depreciation is recaptured at up to 25%, and gains may owe capital-gains tax (a 1031 exchange can defer both). Figures are a year-1 estimate at your 24.0% rate — not tax advice; consult a CPA.
Schools (NCES district)
- District
- Vernon Parish
- NCES district ID
- 2201830
- Math proficiency
- 35% ▼ -42.00%
- Reading proficiency
- 51% ▼ -32.00%
- Median HH income
- $44,822
- Composite
- 36.42/100
- National rank
- #4674
- State rank
- #18 of 98 in LA
Livability — New Llano
- Score
- 63/100
- State rank
- #190
- US rank
- #15143
Category grades
Schools grade is shown separately in the Schools card above.
Census & demographics
- Census place
- New Llano, LA
- Population (ZIP)
- 2,253
Population outlook (Vernon County) Hauer SSP2
- Today (2025)
- 45,401 people
- By 2030
- 43,015 · -5.3%
- By 2040
- 38,171 · -15.9%
- By 2050
- 34,087 · -24.9%
- By 2075
- 28,267 · -37.7%
- By 2100
- 25,486 · -43.9%
Race, ethnicity, and origin ACS 2023
- Neighborhood character
- Highly diverse neighborhood (Simpson 0.76)
- Race & ethnicity
- White 36% Black 30% Two or more races 17% Hispanic / Latino 13% Asian 3% Pacific Islander 2% Native American 1%
- Hispanic origin (detail)
- Mexican 7% Puerto Rican 4%
- Common ancestry
- Romanian 1% Lithuanian 1% Slovak 1%
- Foreign-born
- 6% · Canada, South Korea, China
- Languages at home
- 87% English-only · Spanish 6% German/W. Germanic 1% Korean 1%
Political lean MEDSL · Vernon
- 2024 margin
- Solid R (+67.9) · D 15.6% · R 83.4% · Other 1.0%
- 2008→2024 swing
- -14.5pp toward R · 2008: -53.4pp · 2024: -67.9pp
- All cycles
- 2024: R+67.9 2020: R+64.9 2016: R+65.0 2012: R+57.5 2008: R+53.4
Not yet ingested
- Civics
- —
Market trends
- HPI YoY
- ▲ 4.16%
- Current HPI
- 112.2651
- Rent YoY
- —
- Metro
- —
- State GDP YoY
- ▲ 3.29%
- F500 in state
- 10
Industry mix (Fortune 500 HQ in LA)
| Industry | F500 HQs | Revenue |
|---|---|---|
| Telecommunications | 2 | $23B |
|
||
| Utilities | 1 | $12B |
|
||
| Wholesale / Distribution | 1 | $5B |
|
||
| Advertising | 1 | $2B |
|
||
Price history
+21.0% since first listed3 events — show timeline
- 2026-04-17 Listed $121,000 GFPAR
- 2022-08-09 Sold (MLS) — GFPAR
- 2020-11-13 Listed $100,000 GFPAR
Property tax history
-0.9%/yrLatest (2025): $1,046 · -4.1% YoY. Source: county tax records.
Cash-flow waterfall
monthlySold comps — $/sqft
last 12 mo · ≤1 miLoading sold comps…