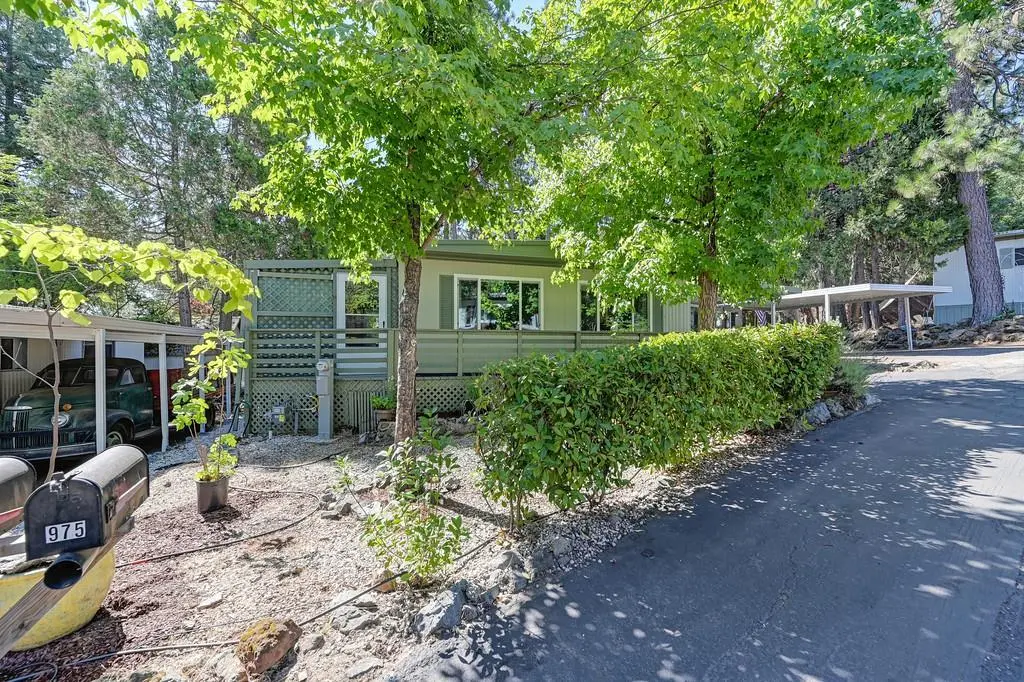
975 Amber Loop · Grass Valley, CA
Flood risk 1/10 · Minimal
- FEMA flood zone
- X (unshaded)
- Chance of flooding over 30 yrs
- 0.0%
- Est. flood insurance / yr
- $507 – $1,088
Fire risk 8/10 · Major
- Est. fire insurance / yr
- $659 – $1,223
Heat risk 4/10 · Minor
- Hot days now (above 95°F)
- 7 days/yr
- Hot days in 30 yrs
- 15 days/yr
Wind risk 1/10 · Minimal
- Chance of severe wind over 30 yrs
- —
Air-quality risk 10/10 · Severe
- Unhealthy air days now
- 34 days/yr
- Unhealthy air days in 30 yrs
- 40 days/yr
Risk factors via First Street. Map © Google.
Why this score? — see what drove the B+ grade
The composite is a weighted blend of 9 inputs, each scored 0–100. Each bar is that input's sub-score; the figure is the points it added to the 100-point composite (weight × sub-score).
- Cash flow +30.0/30.0
- ARV discount +14.4/15.0
- 1% rule +10.0/10.0
- DSCR +10.0/10.0
- Schools +3.8/10.0
- Livability +3.7/5.0
- Rent growth +2.6/5.0
- Condition / age +2.5/5.0
- Appreciation +0.0/10.0
$85,000
🖨 Deal sheet 📄 Offer letter ✓ Due diligence
Listing remarks
Charming Mobile home in sought-After 55+ Community - Move-In Ready! Don't miss this 3 bedroom, 2 bath, double wide mobile located in one of Nevada County's most desirable adult parks for residents aged 55 and older. This peaceful, tree-filled community offers the best of both worlds-quiet country living with modern conveniences just minutes away. Enjoy access to a recently remodeled clubhouse, a sparkling community pool, and a relaxing spa. The park's central location puts you close to shopping, dining, and the local hospital-perfect for convenience and peace of mind. This home is neat, clean, and ready for you to settle in. Pets are welcome, and buyers must qualify with the onsite park m
Key facts
- Relaxing spa
- Community pool
- Central location
Tags
Property features AI
Finance
- Financial info: Land lease: No (listing includes a land lease amount entry of $1,250 noted)
- HOA & community: No homeowners association; Located in a senior community
Exterior
- Parking: Off-street covered parking
- Utilities: Cable available; Internet available; Individual electric meter; Individual gas meter; Natural gas connected; Public water; Public sewer
- Home design: Manufactured home in park; Double-wide; Built in 1971; Located at 975 Amber Loop, Grass Valley, CA; Senior community
- Construction: Olympia make (manufactured home)
- Exterior features: Metal roof; Landscaped yard with backyard; Vinyl skirting
Interior
- Kitchen: Free-standing gas range; Free-standing gas oven; Free-standing refrigerator; Microwave; Hood over range
- Bedrooms: 3 bedrooms
- Flooring: Carpet; Simulated wood; Tile
- Bathrooms: 2 full bathrooms; Tubs with shower over
- Heating & cooling: Central heating; Wood stove; Evaporative cooler
- Interior features: Accessible approach with ramp; Dual-pane partial windows; Deck attached to living room; Dining and living room combined; Synthetic kitchen counters; Cats and dogs allowed (with number limit)
- Laundry & utility: Washer and dryer included; Laundry closet inside the home; 220-volt outlet in laundry
Neighborhood map
What this means for you Summary
Snapshot
- This is a 3-bed/2.0-bath manufactured listed at $85k.
Deal economics
- At list price, monthly cash flow is $1k ($15k/yr) — positive.
- The deal already cash-flows at list — no discount required.
- Meets the 1% rule at list price ($2k rent vs $85k).
- Recommended offer: $82k (3.0% below list) — sets the bar for market timing.
- Cap rate 23.5% vs local median 2.0% in Grass Valley — top-decile yield for the area; either an underpriced asset or a hidden risk that comps aren't pricing in. Stress-test before assuming the spread holds.
Location & tenants
- Location reads 74/100 on livability (#134 in CA, #4,710 nationally) — a middle-class / working-renter tenant base. Strengths: amenities A+, commute A+, health & safety A+; Watch: employment D+, crime F, cost of living F.
- Nevada Joint Union High (town): math 25% / reading 61% proficiency, ranked #201 of 517 in CA (top 39%) — families likely to look elsewhere, expect single-tenant / working-renter base with shorter leases.
- Market conditions: Rents flat; 197 active listings in the ZIP; 1 comparable units currently listed for rent nearby; 215 units permitted in Nevada County in 2024 (0 in 5+ unit buildings).
- This rent runs 42% of the median local income ($66k/yr) — at the standard rent-burdened threshold; future hikes will face affordability resistance.
Forward outlook
- Local home prices are declining (-3.0%/yr); year-one equity from $588 of loan paydown is wiped out by about $3k of value loss. Plan a longer hold.
- Nevada County population projected at -14% by 2050 — secular population decline; favor cash flow + early exit over multi-decade hold.
- At projected returns (-3.0% appreciation + 0.4% rent growth), your $24k cash investment doubles in ~2 years — after that, you're playing with house money.
Negotiation context
- It's been on market 49 days — a 3% lower offer ($82k) is reasonable based on typical stale-listing flexibility.
Risks & watch-outs
- Climate carrying-cost: severe wildfire risk — expect insurance premiums to compound above CPI over the hold.
Questions for the listing agent
- It's been on market 49 days. Have you received any prior offers? Is the seller open to a 3% concession, seller financing, or rate buy-down credit?
- Built in 1971 — when were the roof, HVAC, electrical panel, plumbing, and water heater last replaced?
- Is there a deadline driving the sale (1031 exchange, divorce, estate, relocation)? That informs how much negotiation room exists.
- Crime grade is F in this area — have there been break-ins, vandalism, or insurance claims at this property in the last 3 years? What carrier currently insures it and at what premium?
- What's the average days-on-market for RENTAL listings here right now (not sales)? A rising rental-DOM trend means longer vacancies and softer asking-rent achievability than the comps imply.
- What's the recent tenant-quality profile in this submarket — average credit score on applications, eviction rate, late-payment / NSF rate, and stable-employment percentage? A property-management company in the area should have these aggregated.
- How much new for-sale + rental construction is in the pipeline within 1–3 miles? Heavy new supply typically softens prices + rents 12–24 months out; constrained supply supports both.
Investment metrics
- 1% rule
- 2.69% ✓
- Cap rate
- 23.51%
- Cash-on-cash
- 61.49%
- DSCR
- 3.74
- GRM
- 3.1
CMA / ARV
- ARV (on-the-fly)
- $100,320
- Comps found
- 7
Show comp detail 7 sales within ~0.75 mi
| Address | Dist | Beds/Ba | Sqft | Sold | Price | $/sf | Match |
|---|---|---|---|---|---|---|---|
| 1567 Mulberry Dr | 0.20mi | 2/2.0 (-1) | 1,248 (-6%) | 12mo | $95,000 | $76 | 67 |
| 970 Laurel Ln | 0.10mi | 2/2.0 (-1) | 1,152 (-13%) | 3mo | $38,000 | $33 | 66 |
| 1519 Redwood Dr | 0.17mi | 2/2.0 (-1) | 1,200 (-9%) | 11mo | $105,000 | $88 | 63 |
| 1486 Mulberry Dr | 0.15mi | 3/2.0 | 1,440 (+9%) | 20mo | $120,000 | $83 | 61 |
| 1566 Mulberry Dr | 0.21mi | 2/2.0 (-1) | 1,440 (+9%) | 11mo | $72,500 | $50 | 60 |
| 1529 Redwood Dr #165 | 0.19mi | 2/1.5 (-1) | 1,152 (-13%) | 6mo | $55,000 | $48 | 58 |
| 1536 Mulberry Dr | 0.18mi | 2/2.0 (-1) | 1,152 (-13%) | 10mo | $135,000 | $117 | 57 |
Match score weights: distance 35% · size 25% · config 20% · recency 20%. Top-matched comps best support the ARV.
Projected returns pro-forma
-3.0% appreciation · 0.38% rent growth · sell at horizon
- IRR
- 57.4%
- Equity multiple
- 3.44×
- Total profit
- $58,058
- Equity at exit
- $12,674
- IRR
- 61.3%
- Equity multiple
- 6.37×
- Total profit
- $127,834
- Equity at exit
- $7,349
Cash invested: $23,800 (down + closing). Projections, not guarantees.
Landlord ↔ Tenant lean methodology
- Overall (STATE)
- 18 Strongly Tenant-Friendly
- State California
- 18 Strongly Tenant-Friendly · D+13
- County
- — inherits STATE
- City
- — inherits STATE
ZIP-level market 95945
- Rents YoY
- 0.4%
- Active inventory
- 197
- Price-to-rent
- 3.1×
Monthly cashflow live
- Estimated rent
- $2,287 medium interval (Pro) →
- Mortgage (P&I)
- −$446
- Tax est. 1.5%
- −$106 /mo · $1,275/yr
- Insurance
- −$35
- HOA
- −$0
- Vacancy / Maint / Mgmt
- −$480
- Net cashflow
- $1,220
Break-even live
UW: 25.0% down · 7.5% · 30yr · 1.5% tax · 5.0% vac · 8.0% maint · 8.0% mgmt
Financing live
Cash to close
- Down payment
- $21,250
- Closing costs
- $2,550
- Reserves months
- —
- Total cash needed
- —
Loan-product check · same deal, 3 products live
Conventional
25% down · 7.5% · 30yr
- Down + closing
- —
- Monthly P&I
- —
- Monthly cashflow
- —
- DSCR
- —
- Eligible?
- —
Personal DTI + credit; lowest rate.
DSCR
20% down · 8.5% · 30yr
- Down + closing
- —
- Monthly P&I
- —
- Monthly cashflow
- —
- DSCR
- —
- Eligible?
- —
No personal income docs; deal must DSCR.
Hard money
10% down · 12.0% · 12mo
- Down + closing
- —
- Monthly P&I
- —
- Monthly cashflow
- —
- DSCR
- —
- Eligible?
- —
Short-term bridge; refi at stabilization.
Rent comps 1 comps
| Address | Beds | Baths | Sqft | Rent | $/sqft | DOM | Units | Dist |
|---|---|---|---|---|---|---|---|---|
| 126 W Berryhill Dr Grass Valley, CA | 1.0–3.0 | 1.0–2.0 | 797 | $2,325 | $2.92 | 2d | 7 | 1.06mi |
Listing history 17 events
-
2026-06-19days on market $85,000 Active 49 DOM
-
2026-06-18days on market $85,000 Active 48 DOM
-
2026-06-17days on market $85,000 Active 47 DOM
-
2026-06-16days on market $85,000 Active 46 DOM
-
2026-06-15days on market $85,000 Active 45 DOM
-
2026-06-14days on market $85,000 Active 43 DOM
-
2026-06-13days on market $85,000 Active 42 DOM
-
2026-06-10days on market $85,000 Active 40 DOM
-
2026-06-09days on market $85,000 Active 39 DOM
-
2026-06-08days on market $85,000 Active 38 DOM
-
2026-06-07days on market $85,000 Active 37 DOM
-
2026-06-05days on market $85,000 Active 34 DOM
-
2026-06-03days on market $85,000 Active 33 DOM
-
2026-06-02days on market $85,000 Active 32 DOM
-
2026-06-01days on market $85,000 Active 31 DOM
-
2026-05-31days on market $85,000 Active 30 DOM
-
2026-05-30days on market $85,000 Active 29 DOM
ⓘ Source: listings_history table (triggers on properties + properties_extension) + one-shot
backfill from property_details.listing_events for pre-trigger history.
Climate risk First Street
- Flood 1/10 Low FEMA zone X (unshaded) · 0% chance over 30 yrs
- Wildfire 8/10 Severe
- Heat 4/10 Moderate 7 d/yr ≥95°F today · 15 d/yr by 30 yrs out
- Wind 1/10 Low
- Air quality 10/10 Extreme 34 unhealthy d/yr today · 40 by 30 yrs out
Nearby sold comps map
Loading sold comps map…
Walkable amenities ~0.75 mi
Loading nearby amenities…
Taxation est. · year 1
- Rental income
- $27,447
- − Mortgage interest
- −$4,761
- − Property taxes
- −$1,275
- − Insurance
- −$425
- − Repairs & maintenance
- −$2,196
- − Management
- −$2,196
- − Depreciation
- −$2,473
- Taxable income
- $14,122
- Est. tax owed @ 24.0%
- −$3,389
- After-tax cash flow
- $11,245/yr
For passive investors: Depreciation is non-cash, so a rental often shows a tax loss while cash-flowing — sheltering income. Rental losses are passive: they offset passive income freely, and up to $25,000/yr can offset ordinary (W-2) income if you actively participate and your MAGI is under $100k (phasing out to $0 by $150k); unused losses carry forward. On sale, claimed depreciation is recaptured at up to 25%, and gains may owe capital-gains tax (a 1031 exchange can defer both). Figures are a year-1 estimate at your 24.0% rate — not tax advice; consult a CPA.
Schools (NCES district)
- District
- Nevada Joint Union High
- NCES district ID
- 0626880
- Math proficiency
- 25% ▼ -14.00%
- Reading proficiency
- 61% ▼ -7.00%
- Median HH income
- $57,336
- Composite
- 37.53/100
- National rank
- #4393
- State rank
- #201 of 517 in CA
Livability — Grass Valley
- Score
- 74/100
- State rank
- #134
- US rank
- #4710
Category grades
Schools grade is shown separately in the Schools card above.
Census & demographics
- Census place
- Grass Valley, CA
- County
- Nevada County · 85,339 people
- City population
- 48,022
- Metro
- Truckee-Grass Valley, CA
- Population (ZIP)
- 27,470
- Household income
- $65,989
- Rent vs Own
- Severe rent burden
- 1624.0
Population outlook (Nevada County) Hauer SSP2
- Today (2025)
- 98,490 people
- By 2030
- 97,295 · -1.2%
- By 2040
- 92,041 · -6.5%
- By 2050
- 85,164 · -13.5%
- By 2075
- 68,436 · -30.5%
- By 2100
- 49,536 · -49.7%
Race, ethnicity, and origin ACS 2023
- Neighborhood character
- Predominantly White (81%)
- Race & ethnicity
- White 81% Hispanic / Latino 11% Two or more races 9%
- Hispanic origin (detail)
- Mexican 9%
- Common ancestry
- Italian 4% Lithuanian 3% Portuguese 2%
- Foreign-born
- 7% · Canada
- Languages at home
- 89% English-only · Spanish 7% Arabic 1% Other Asian/Pacific 1%
Political lean MEDSL · Nevada
- 2024 margin
- D (+12.2) · D 54.4% · R 42.1% · Other 3.5%
- 2008→2024 swing
- +6.9pp toward D · 2008: 5.3pp · 2024: 12.2pp
- All cycles
- 2024: D+12.2 2020: D+14.8 2016: D+4.5 2012: R+4.7 2008: D+5.3
Not yet ingested
- Civics
- —
Market trends
- HPI YoY
- ▼ -191.74%
- Current HPI
- 253.8946
- Rent YoY
- ▲ 0.38%
- Metro
- Truckee-Grass Valley, CA
- State GDP YoY
- ▲ 3.21%
- F500 in state
- 116
Industry mix (Fortune 500 HQ in CA)
| Industry | F500 HQs | Revenue |
|---|---|---|
| Technology | 27 | $1,492B |
|
||
| Financial Services | 3 | $174B |
|
||
| Retail | 3 | $44B |
|
||
| Insurance | 3 | $26B |
|
||
| Media / Entertainment | 2 | $115B |
|
||
| Pharmaceuticals / Biotech | 2 | $62B |
|
||
Cash-flow waterfall
monthlySold comps — $/sqft
last 12 mo · ≤1 miLoading sold comps…