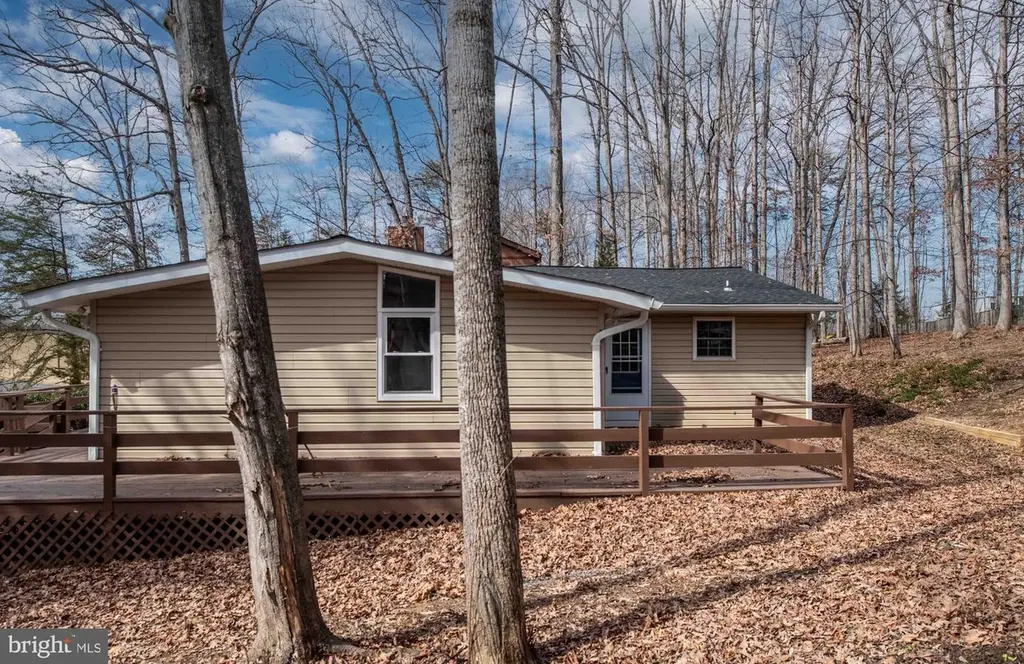
116 Lakeview Pkwy · Lake of the Woods, VA
Flood risk 1/10 · Minimal
- FEMA flood zone
- X (unshaded)
- Chance of flooding over 30 yrs
- 0.0%
- Est. flood insurance / yr
- $473 – $860
Fire risk 2/10 · Minimal
- Est. fire insurance / yr
- $666 – $1,236
Heat risk 7/10 · Major
- Hot days now (above 104°F)
- 7 days/yr
- Hot days in 30 yrs
- 16 days/yr
Wind risk 3/10 · Minor
- Chance of severe wind over 30 yrs
- 9.0%
Air-quality risk 1/10 · Minimal
- Unhealthy air days now
- 0 days/yr
- Unhealthy air days in 30 yrs
- 0 days/yr
Risk factors via First Street. Map © Google.
Why this score? — see what drove the D+ grade
The composite is a weighted blend of 9 inputs, each scored 0–100. Each bar is that input's sub-score; the figure is the points it added to the 100-point composite (weight × sub-score).
- Cash flow +12.9/30.0
- ARV discount +11.8/15.0
- Schools +4.8/10.0
- DSCR +3.9/10.0
- 1% rule +3.4/10.0
- Livability +3.2/5.0
- Rent growth +2.5/5.0
- Condition / age +2.5/5.0
- Appreciation +0.0/10.0
$349,999
🖨 Deal sheet (PDF) 📄 Offer letter ✓ Due diligence
Listing remarks MLS
Charming 4-Bedroom, 2-Bathroom One-Level Home in a Resort-Style Community Step into comfort and style with this beautifully updated 4- bedrooms, 2-bathroom gem, ideally situated just moments from the gate entrance for effortless access. Designed with convenience in mind, this single-level home offers spacious living areas perfect for relaxing and entertaining. (Not far from the new Kalahari Resort opening in 2026.) The large primary bedroom has vaulted ceilings and a private bathroom. The bright, modern kitchen and refreshed bedrooms add a touch of contemporary charm, while the brand-new roof (installed in early 2024) offers long-term peace of mind. Step outside to your expansive backyard—ideal for weekend barbecues, garden parties, or simply soaking up the sun in your private outdoor retreat. Nestled in a vibrant, resort-like community, this home offers the perfect balance of privacy and connection. It offers access to a variety of amenities designed for year-round enjoyment, whether you're looking for a peaceful escape or an active lifestyle. The amenities include: golf course, walking trails, horse stables, beaches and more. Don’t miss this rare opportunity to own a move-in-ready home in a community that feels like a vacation every day!
Key facts
- 0.32 acre lot
- Community pool
- Built 1979
Property features AI
Finance
- HOA & community: Annual HOA fee; Community amenities include outdoor pool, clubhouse/community center, golf course, lake access, pier/dock, boat ramp and slips, basketball courts, baseball field, bike trail, jog/walk path, picnic area, riding/stables
Exterior
- Parking: Gravel driveway; Driveway parking
- Utilities: Public water; Public sewer; Electric service
- Home design: Detached single-story home; Effective major renovation in 2023; Year built per assessor; Lake-facing location
- Construction: Vinyl siding; Architectural shingle roof; Concrete perimeter foundation; Detached structure
- Exterior features: Wrap-around deck; Above-grade and below-grade structures; Located on navigable lakefront (Lake of the Woods); Water access with canoe/kayak access and fishing; limited-hours PWC operation allowed
Interior
- Kitchen: Dishwasher; Disposal; Microwave; Built-in microwave; Refrigerator; Electric oven/range
- Bedrooms: Four bedrooms on the main level
- Flooring: Carpet; Luxury vinyl plank
- Bathrooms: Two full bathrooms (both on the main level)
- Heating & cooling: Heat pump(s); Central air (electric cooling); Electric hot water
- Interior features: Open floor plan with combination dining/living area; Breakfast area; Pantry; Upgraded countertops; Ceiling fan(s); Walk-in closet(s)
- Laundry & utility: Washer in unit; Dryer in unit (electric)
Neighborhood map
What this means for you Summary
Snapshot
- This is a 4-bed/2.0-bath single-family listed at $350k.
Deal economics
- At list price, monthly cash flow is $-24 ($-290/yr) — negative.
- To cash-flow at today's rent, offer at most $346k (1.2% below list).
- To meet the 1% rule (rent ≥ 1% of price), the offer needs to be $294k (16.1% below list).
- Recommended offer: $294k (16.1% below list) — sets the bar for 1% rule.
- Cap rate 6.2% vs local median 4.3% in Lake of the Woods — top-decile yield for the area; either an underpriced asset or a hidden risk that comps aren't pricing in. Stress-test before assuming the spread holds.
Location & tenants
- Location reads 65/100 on livability (#341 in VA) — a middle-class / working-renter tenant base. Strengths: employment A+, housing A+, crime A-; Watch: cost of living C-, amenities F, commute F.
- Orange County Public School District (rural): math 47% / reading 64% proficiency, ranked #71 of 131 in VA (top 54%) — acceptable for families but not a draw, mixed tenant base, ~2y average lease.
- Zoned schools: Locust Grove Elementary (math 51% / reading 64%, grade C+, #588 of 1,108 statewide, top 54%, 520 students, 70% FRL); Locust Grove Middle (math 42% / reading 66%, grade B-, #205 of 342 statewide, top 61%, 693 students, 69% FRL); Orange County High (math 61% / reading 72%, grade B, #195 of 319 statewide, top 62%, 1,476 students, 43% FRL) — zoned schools average 61% FRL vs 34% district-wide (27 pts higher); higher-poverty schools than district average — tighter screening recommended.
- Market conditions: 197 active listings in the ZIP; 8 comparable units currently listed for rent nearby; rentals leasing fast (median 5d on market — plan ~1-2 weeks tenant-placement turnaround); high-income renter base; 412 units permitted in Orange County in 2024 (0 in 5+ unit buildings).
- This rent runs 32% of the median local income ($111k/yr) — at the standard rent-burdened threshold; future hikes will face affordability resistance.
Forward outlook
- Local home prices are declining (-3.0%/yr); year-one equity from $2k of loan paydown is wiped out by about $10k of value loss. Plan a longer hold.
- Orange County population projected at +18% by 2050 — long-run rental-demand tailwind backs the buy-and-hold thesis.
Negotiation context
- Only 14 days on market — expect competitive offers; lowballing is unlikely to land.
- 26 sale attempts since 28y ago; this cycle's ask is 14794% above the opening price — seller raised mid-cycle; expect resistance to lowballs.
Risks & watch-outs
- Climate carrying-cost: extreme-heat days projected 7→16/yr by 2055 (HVAC capex compounding) — expect insurance premiums to compound above CPI over the hold.
Questions for the listing agent
- What do current leases actually rent for vs. the listed asking? Can we see a recent rent roll and the last 12 months of T-12 income?
- Built in 1979 — when were the roof, HVAC, electrical panel, plumbing, and water heater last replaced?
- What does the HOA fee cover, when was the last increase, and are there any pending special assessments or reserve-fund shortfalls?
- Is there a deadline driving the sale (1031 exchange, divorce, estate, relocation)? That informs how much negotiation room exists.
- Schools are D-rated, which usually means shorter tenancies and higher turnover. Who's the typical renter profile here, and what's been the actual vacancy rate?
- The area grade is low — what's the realistic commute time and amenity access for the typical tenant pool here? Any planned neighborhood developments (good or bad) we should know about?
- What's the average days-on-market for RENTAL listings here right now (not sales)? A rising rental-DOM trend means longer vacancies and softer asking-rent achievability than the comps imply.
- What's the recent tenant-quality profile in this submarket — average credit score on applications, eviction rate, late-payment / NSF rate, and stable-employment percentage? A property-management company in the area should have these aggregated.
- How much new for-sale + rental construction is in the pipeline within 1–3 miles? Heavy new supply typically softens prices + rents 12–24 months out; constrained supply supports both.
Investment metrics
- 1% rule
- 0.84% ✗
- Cap rate
- 6.21%
- Cash-on-cash
- -0.30%
- DSCR
- 0.99
- GRM
- 9.9
CMA / ARV
- ARV (on-the-fly)
- $387,246
- Comps found
- 12
Show comp detail 12 sales within ~0.75 mi
| Address | Dist | Beds/Ba | Sqft | Sold | Price | $/sf | Match |
|---|---|---|---|---|---|---|---|
| 116 Lakeview Pkwy | 0.00mi | 4/2.0 | 1,662 (0%) | 12mo | $359,000 | $216 | 90 |
| 4621 Lakeview Pkwy | 0.23mi | 3/2.0 (-1) | 1,652 (-1%) | 9mo | $411,000 | $249 | 76 |
| 411 Lakeview Pkwy | 0.34mi | 4/2.0 | 1,650 (-1%) | 9mo | $390,000 | $236 | 76 |
| 207 Spotswood Rd | 0.41mi | 4/2.0 | 1,530 (-8%) | 2mo | $379,000 | $248 | 66 |
| 413 Lakeview Pkwy | 0.35mi | 3/2.0 (-1) | 1,822 (+10%) | 3mo | $358,850 | $197 | 60 |
| 203 Musket Ln | 0.58mi | 3/2.0 (-1) | 1,737 (+4%) | 2mo | $405,000 | $233 | 59 |
| 202 Wilderness Dr | 0.34mi | 3/2.0 (-1) | 1,820 (+10%) | 9mo | $342,500 | $188 | 56 |
| 206 Liberty Blvd | 0.74mi | 3/2.0 (-1) | 1,620 (-2%) | 2mo | $329,000 | $203 | 54 |
| 215 Mt Pleasant Dr | 0.39mi | 3/2.5 (-1) | 1,512 (-9%) | 7mo | $365,000 | $241 | 53 |
| 106 Wakefield Dr | 0.56mi | 3/2.0 (-1) | 1,792 (+8%) | 10mo | $468,000 | $261 | 47 |
| 314 Fairway Dr | 0.74mi | 3/2.0 (-1) | 1,794 (+8%) | 6mo | $400,000 | $223 | 43 |
| 331 Fairway Dr | 0.75mi | 3/2.5 (-1) | 1,900 (+14%) | 7mo | $400,000 | $211 | 28 |
Match score weights: distance 35% · size 25% · config 20% · recency 20%. Top-matched comps best support the ARV.
Projected returns pro-forma
-3.0% appreciation · 3.0% rent growth · sell at horizon
- IRR
- -16.8%
- Equity multiple
- 0.41×
- Total profit
- $-58,255
- Equity at exit
- $52,186
- IRR
- -8.6%
- Equity multiple
- 0.46×
- Total profit
- $-52,715
- Equity at exit
- $30,262
Cash invested: $98,000 (down + closing). Projections, not guarantees.
Landlord ↔ Tenant lean methodology
- Overall (STATE)
- 55 Moderately Landlord-Leaning
- State Virginia
- 55 Moderately Landlord-Leaning · D+2
- County
- — inherits STATE
- City
- — inherits STATE
ZIP-level market 22508
- Home prices YoY
- -5.0%
- Active inventory
- 197
- Price-to-rent
- 9.9×
Monthly cashflow live
- Estimated rent
- $2,937 high interval (Pro) →
- Mortgage (P&I)
- −$1,835
- Tax from tax record
- −$146 /mo · $1,751/yr
- Insurance
- −$146
- HOA
- −$217
- Vacancy / Maint / Mgmt
- −$617
- Net cashflow
- $-24
Break-even live
Sensitivity live
| Price | -10% $174 | -5% $75 | +0% $-24 | +5% $-123 | +10% $-222 |
|---|---|---|---|---|---|
| Rent | -10% $-256 | -5% $-140 | +0% $-24 | +5% $92 | +10% $208 |
| Rate | -1.0pp $152 | -0.5pp $65 | base $-24 | +0.5pp $-115 | +1.0pp $-207 |
UW: 25.0% down · 7.5% · 30yr · 1.5% tax · 5.0% vac · 8.0% maint · 8.0% mgmt
Financing live
Cash to close
- Down payment
- $87,500
- Closing costs
- $10,500
- Reserves months
- —
- Total cash needed
- —
Loan-product check · same deal, 3 products live
Conventional
25% down · 7.5% · 30yr
- Down + closing
- —
- Monthly P&I
- —
- Monthly cashflow
- —
- DSCR
- —
- Eligible?
- —
Personal DTI + credit; lowest rate.
DSCR
20% down · 8.5% · 30yr
- Down + closing
- —
- Monthly P&I
- —
- Monthly cashflow
- —
- DSCR
- —
- Eligible?
- —
No personal income docs; deal must DSCR.
Hard money
10% down · 12.0% · 12mo
- Down + closing
- —
- Monthly P&I
- —
- Monthly cashflow
- —
- DSCR
- —
- Eligible?
- —
Short-term bridge; refi at stabilization.
Rent comps 8 comps
| Address | Beds | Baths | Sqft | Rent | $/sqft | DOM | Units | Dist |
|---|---|---|---|---|---|---|---|---|
| 210 Wakefield Dr Locust Grove, VA | 3.0 | 2.5 | 2211 | $2,500 | $1.13 | 0d | 1 | 0.60mi |
| 1006 Lakeview Pkwy Locust Grove, VA | 3.0 | 2.0 | 1222 | $2,200 | $1.80 | 45d | 1 | 0.85mi |
| 110 Parliament St Locust Grove, VA | 3.0 | 2.5 | 1786 | $2,300 | $1.29 | 2d | 1 | 1.09mi |
| 35514 Aspen Way Locust Grove, VA | 4.0 | 2.5 | 2180 | $3,200 | $1.47 | 0d | 1 | 1.12mi |
| 405 Cornwallis Ave Locust Grove, VA | 3.0 | 2.0 | 1728 | $2,800 | $1.62 | 0d | 1 | 1.16mi |
| 3216 White Tail Dr Locust Grove, VA | 4.0 | 2.5 | 1906 | $2,700 | $1.42 | 5d | 1 | 1.23mi |
| 306 Happy Creek Rd Locust Grove, VA | 3.0 | 2.0 | 1630 | $2,695 | $1.65 | 45d | 1 | 1.24mi |
| 2736 Bears Den Dr Locust Grove, VA | 3.0 | 2.5 | 1720 | $2,299 | $1.34 | 20d | 1 | 1.43mi |
HOA detail
- Monthly dues
- $217 · $2,604/yr
Listing history 9 events
-
2026-06-21days on market $349,999 Coming Soon 14 DOM
-
2026-06-18days on market $349,999 Coming Soon 11 DOM
-
2026-06-17days on market $349,999 Coming Soon 10 DOM
-
2026-06-16days on market $349,999 Coming Soon 9 DOM
-
2026-06-15days on market $349,999 Coming Soon 8 DOM
-
2026-06-13days on market $349,999 Coming Soon 6 DOM
-
2026-06-09days on market $349,999 Coming Soon 2 DOM
-
2026-06-08remarks 699-char remark
-
2026-06-08$349,999 Coming Soon 1 DOM
ⓘ Source: listings_history table (triggers on properties + properties_extension) + one-shot
backfill from property_details.listing_events for pre-trigger history.
Tax reassessment forecast VA · Resets to sale price
- Current annual tax
- $1,751 · $146/mo
- Projected year-2 tax
- $2,870 · $239/mo
- Expected delta
- +$1,119/yr (+$93/mo · 63.9%)
ⓘ Screening estimate from a state-policy table — verify with the county assessor before closing.
Climate risk First Street
- Flood 1/10 Low FEMA zone X (unshaded) · 0% chance over 30 yrs
- Wildfire 2/10 Low
- Heat 7/10 Severe 7 d/yr ≥104°F today · 16 d/yr by 30 yrs out
- Wind 3/10 Moderate 9% chance of damaging wind over 30 yrs
- Air quality 1/10 Low 0 unhealthy d/yr today · 0 by 30 yrs out
Nearby sold comps map
Loading sold comps map…
Walkable amenities ~0.75 mi
Loading nearby amenities…
Taxation est. · year 1
- Rental income
- $35,241
- − Mortgage interest
- −$19,605
- − Property taxes
- −$1,751
- − Insurance
- −$1,750
- − Repairs & maintenance
- −$2,819
- − Management
- −$2,819
- − HOA
- −$2,604
- − Depreciation
- −$10,182
- Taxable loss
- −$6,290
- Est. tax savings @ 24.0%
- +$1,510
- After-tax cash flow
- $1,220/yr
For passive investors: Depreciation is non-cash, so a rental often shows a tax loss while cash-flowing — sheltering income. Rental losses are passive: they offset passive income freely, and up to $25,000/yr can offset ordinary (W-2) income if you actively participate and your MAGI is under $100k (phasing out to $0 by $150k); unused losses carry forward. On sale, claimed depreciation is recaptured at up to 25%, and gains may owe capital-gains tax (a 1031 exchange can defer both). Figures are a year-1 estimate at your 24.0% rate — not tax advice; consult a CPA.
Schools (NCES district)
- District
- Orange County Public School District
- NCES district ID
- 5102820
- Math proficiency
- 47% ▼ -35.00%
- Reading proficiency
- 64% ▼ -14.00%
- Median HH income
- $61,086
- Composite
- 48.34/100
- National rank
- #2147
- State rank
- #71 of 131 in VA
Livability — Lake of the Woods
- Score
- 65/100
- State rank
- #341
- US rank
- #13456
Category grades
Schools grade is shown separately in the Schools card above.
Census & demographics
- Census place
- Lake of the Woods, VA
- County
- Orange County · 21,992 people
- Metro
- Washington-Arlington-Alexandria, DC-VA-MD-WV
- Population (ZIP)
- 15,557
- Household income
- $111,357
- Rent vs Own
- Severe rent burden
- 102.0
Population outlook (Orange County) Hauer SSP2
- Today (2025)
- 38,758 people
- By 2030
- 40,411 · +4.3%
- By 2040
- 43,477 · +12.2%
- By 2050
- 45,856 · +18.3%
- By 2075
- 51,067 · +31.8%
- By 2100
- 51,387 · +32.6%
Race, ethnicity, and origin ACS 2023
- Neighborhood character
- Predominantly White (73%)
- Race & ethnicity
- White 73% Two or more races 10% Hispanic / Latino 10% Black 8% Asian 2%
- Hispanic origin (detail)
- Mexican 3% Puerto Rican 2%
- Common ancestry
- Serbian 3% Romanian 3% Lithuanian 3%
- Foreign-born
- 7% · Canada, South Korea
- Languages at home
- 91% English-only · Spanish 5% French/Haitian/Cajun 2% Other Indo-European 1%
Political lean MEDSL · Orange
- 2024 margin
- Strong R (+24.7) · D 37.2% · R 61.9%
- 2008→2024 swing
- -15.8pp toward R · 2008: -8.8pp · 2024: -24.7pp
- All cycles
- 2024: R+24.7 2020: R+21.4 2016: R+26.6 2012: R+14.5 2008: R+8.8
Not yet ingested
- Civics
- —
Market trends
- HPI YoY
- ▼ -20.88%
- Current HPI
- 401.2932
- Rent YoY
- —
- Metro
- Washington-Arlington-Alexandria, DC-VA-MD-WV
- State GDP YoY
- ▲ 2.40%
- F500 in state
- 50
Industry mix (Fortune 500 HQ in VA)
| Industry | F500 HQs | Revenue |
|---|---|---|
| Aerospace / Defense | 4 | $236B |
|
||
| Technology / Defense | 3 | $32B |
|
||
| Financial Services | 2 | $176B |
|
||
| Utilities | 2 | $27B |
|
||
| Insurance | 2 | $25B |
|
||
| Technology | 2 | $15B |
|
||
Price history
+368.2% since first listed81 events — show timeline
- 2026-06-07 Coming Soon $349,999 BRIGHT MLS
- 2025-07-03 Rental Removed $2,350 CAAR
- 2025-07-02 Sold (MLS) $359,000 BRIGHT MLS
- 2025-06-21 Price Changed $349,999 BRIGHT MLS
- 2025-06-18 Listed for Rent $2,350 CAAR
- 2025-06-11 Rental Removed $2,650 CAAR
- 2025-06-04 Price Changed $369,999 BRIGHT MLS
- 2025-05-17 Listed for Rent $2,650 CAAR
- 2025-04-30 Listing Removed — BRIGHT MLS
- 2025-04-30 Listed $374,999 BRIGHT MLS
- 2025-04-18 Price Changed $379,999 BRIGHT MLS
- 2025-03-31 Price Changed $389,999 BRIGHT MLS
- 2025-03-17 Price Changed $405,999 BRIGHT MLS
- 2025-02-18 Listed $415,000 BRIGHT MLS
- 2025-01-22 Coming Soon — BRIGHT MLS
- 2024-03-06 Rental Removed $2,300 BRIGHTMLS
- 2024-01-31 Price Changed $2,300 BRIGHTMLS
- 2024-01-17 Price Changed $2,400 BRIGHTMLS
- 2024-01-11 Price Changed $2,500 BRIGHTMLS
- 2023-12-29 Listed for Rent $2,600 BRIGHTMLS
- 2023-12-14 Sold (Public Records) $299,500 Public Records
- 2023-12-13 Sold (MLS) $299,500 BRIGHT MLS
- 2023-12-09 Rental Removed $2,600 RENT.
- 2023-11-29 Contingent — BRIGHT MLS
- 2023-11-23 Price Changed $315,000 BRIGHT MLS
- 2023-11-16 Price Changed $329,000 BRIGHT MLS
- 2023-11-02 Listed for Rent $2,600 RENT.
- 2023-10-19 Price Changed $339,000 BRIGHT MLS
- 2023-09-30 Listed $359,000 BRIGHT MLS
- 2017-11-21 Listing Removed — BRIGHT MLS
- 2017-11-21 Delisted — MRIS
- 2017-10-31 Price Changed — MRIS
- 2017-10-30 Listed — MRIS
- 2017-10-30 Listed $199,000 BRIGHT MLS
- 2015-11-13 Delisted — MRIS
- 2015-11-13 Listing Removed — BRIGHT MLS
- 2015-10-26 Listed — MRIS
- 2015-10-26 Listed $159,000 BRIGHT MLS
- 2015-08-14 Sold (MLS) $101,000 MRIS
- 2015-08-14 Sold (MLS) $101,000 BRIGHT MLS
- 2015-07-09 Pending — MRIS
- 2015-07-09 Listing Removed — BRIGHT MLS
- 2015-06-23 Relisted — MRIS
- 2015-06-03 Pending — MRIS
- 2015-05-12 Listed $137,000 MRIS
- 2015-05-12 Listed $137,000 BRIGHT MLS
- 2014-06-26 Delisted — MRIS
- 2014-06-26 Listing Removed — BRIGHT MLS
- 2014-06-18 Pending — MRIS
- 2014-06-09 Relisted — MRIS
- 2014-05-02 Listed $110,000 BRIGHT MLS
- 2014-05-02 Delisted — MRIS
- 2014-05-02 Listed — MRIS
- 2009-05-15 Sold (Public Records) $145,000 Public Records
- 2009-05-15 Sold (Public Records) $145,000 Public Records
- 2009-05-13 Sold (MLS) $145,000 MRIS
- 2009-05-13 Sold (MLS) $145,000 BRIGHT MLS
- 2009-05-09 Delisted — MRIS
- 2009-04-30 Contingent — MRIS
- 2009-04-29 Listing Removed — BRIGHT MLS
- 2009-04-10 Price Changed $145,000 MRIS
- 2009-01-29 Listed $168,000 MRIS
- 2009-01-28 Listed $145,000 BRIGHT MLS
- 2008-04-01 Delisted — MRIS
- 2007-10-19 Listed — MRIS
- 2007-10-16 Delisted — MRIS
- 2007-08-02 Listed — MRIS
- 2007-08-02 Delisted — MRIS
- 2007-06-24 Listed — MRIS
- 2007-02-25 Delisted — MRIS
- 2007-02-12 Listed — MRIS
- 2003-08-29 Sold (MLS) $135,000 MRIS
- 2003-07-18 Delisted — MRIS
- 2003-07-17 Listed $135,000 MRIS
- 1998-10-02 Sold (MLS) $82,000 MRIS
- 1998-08-24 Delisted — MRIS
- 1998-06-16 Listed $82,000 MRIS
- 1998-06-12 Delisted — MRIS
- 1998-03-19 Listed — MRIS
- 1994-05-16 Sold (Public Records) $74,750 Public Records
- 1994-05-16 Sold (Public Records) $74,750 Public Records
Property tax history
+3.3%/yrLatest (2025): $1,751 · +34.9% YoY. Source: county tax records.
Cash-flow waterfall
monthlySold comps — $/sqft
last 12 mo · ≤1 miLoading sold comps…