3101 Bapaume Ave · Norfolk, VA
Flood risk 4/10 · Minor
- FEMA flood zone
- X (unshaded)
- Chance of flooding over 30 yrs
- 0.13%
- Est. flood insurance / yr
- $507 – $1,088
Fire risk 1/10 · Minimal
- Est. fire insurance / yr
- $666 – $1,236
Heat risk 9/10 · Severe
- Hot days now (above 105°F)
- 7 days/yr
- Hot days in 30 yrs
- 16 days/yr
Wind risk 8/10 · Major
- Chance of severe wind over 30 yrs
- 80.0%
Air-quality risk 3/10 · Minor
- Unhealthy air days now
- 2 days/yr
- Unhealthy air days in 30 yrs
- 5 days/yr
Risk factors via First Street. Map © Google.
Why this score? — see what drove the D grade
The composite is a weighted blend of 9 inputs, each scored 0–100. Each bar is that input's sub-score; the figure is the points it added to the 100-point composite (weight × sub-score).
- Cash flow +11.0/30.0
- ARV discount +7.1/15.0
- Rent growth +5.0/5.0
- Livability +4.2/5.0
- Schools +3.5/10.0
- DSCR +3.2/10.0
- Appreciation +2.9/10.0
- 1% rule +2.8/10.0
- Condition / age +2.5/5.0
$350,000
🖨 Deal sheet (PDF) 📄 Offer letter ✓ Due diligence
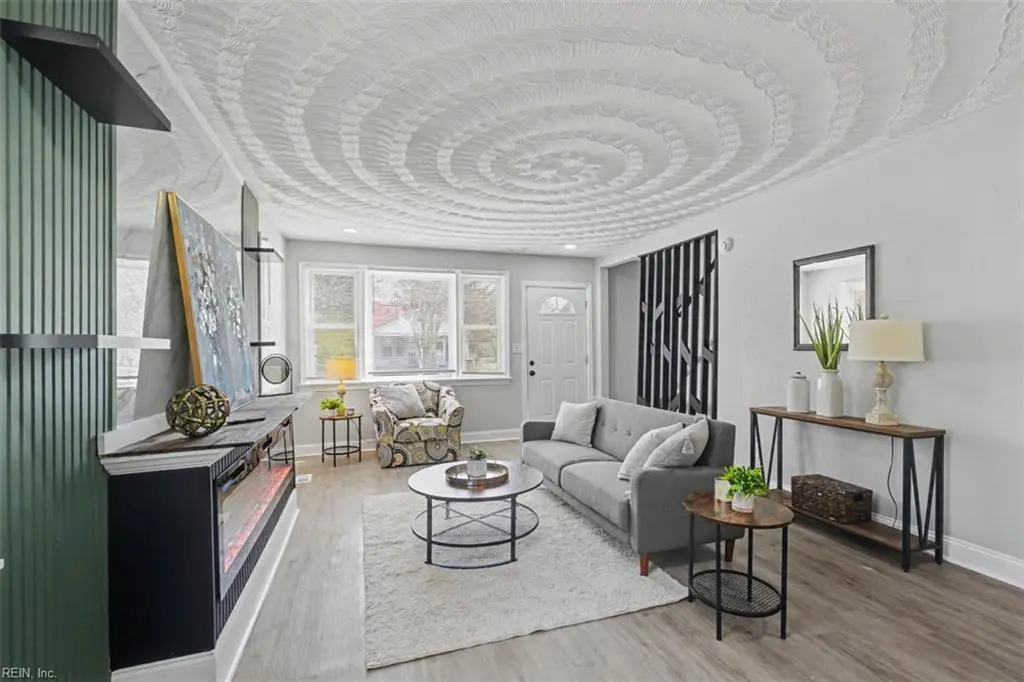
Listing remarks
Welcome home to this beautifully remodeled 4-bedroom, 2-bathroom Cape Cod that perfectly blends classic charm with modern updates. Every detail has been thoughtfully upgraded, making this home completely move-in ready. Step inside to find a bright and inviting layout featuring a brand-new kitchen with updated cabinetry, countertops, and stainless steel appliances. Both bathrooms have been fully renovated with stylish finishes, offering a fresh and modern feel throughout. Come see this turn-key home today!
Key facts
- 2 parking spots
- Built 1952
- Listed 6 days
Property features AI
Finance
- Other: Simple ownership
- HOA & community: No HOA fees reported
Exterior
- Parking: Carport with space for 2 vehicles
- Utilities: City water; City sewer; Electric power
- Home design: Detached home; Cape Cod / Traditional style; 2 stories; Crawl foundation
- Construction: Asphalt shingle roof
- Exterior features: Vinyl siding; Full fence
Interior
- Kitchen: Dishwasher; Microwave; Electric range; Refrigerator; Breakfast area
- Bedrooms: Master bedroom; Master bedroom on first floor; Additional bedroom
- Flooring: Laminate
- Bathrooms: Two full bathrooms; Full bathroom on first floor
- Heating & cooling: Heat pump; Central air
- Interior features: Cable hookup; Ceiling fan; One fireplace
- Laundry & utility: Washer hookup; Dryer hookup; Utility room; Electric water heater
Neighborhood map
What this means for you Summary
Snapshot
- This is a 5-bed/2.5-bath single-family listed at $350k.
Deal economics
- At list price, monthly cash flow is $-145 ($-2k/yr) — negative.
- To cash-flow at today's rent, offer at most $324k (7.3% below list).
- To meet the 1% rule (rent ≥ 1% of price), the offer needs to be $272k (22.2% below list).
- Recommended offer: $272k (22.2% below list) — sets the bar for 1% rule.
- Cap rate 5.8% vs local median 4.0% in Norfolk — top-decile yield for the area; either an underpriced asset or a hidden risk that comps aren't pricing in. Stress-test before assuming the spread holds.
Location & tenants
- Location reads 83/100 on livability (#43 in VA, #1,026 nationally) — a professional / high-income tenant draw. Strengths: amenities A+, commute A+, health & safety A+; Watch: employment C-, crime F.
- Norfolk City Public School District (urban): math 27% / reading 56% proficiency, ranked #118 of 131 in VA (top 90%) — families likely to look elsewhere, expect single-tenant / working-renter base with shorter leases.
- Zoned schools: Lindenwood Elementary (math 8% / reading 32%, grade F, #1,082 of 1,108 statewide, top 98%, 262 students, 98% FRL); Azalea Gardens Middle (math 21% / reading 54%, grade F, #315 of 342 statewide, top 93%, 848 students, 84% FRL); Matthew Fontaine Maury High (math 46% / reading 90%, grade B, #180 of 319 statewide, top 57%, 1,697 students, 96% FRL) — zoned schools average 93% FRL vs 59% district-wide (34 pts higher); higher-poverty schools than district average — tighter screening recommended.
- Market conditions: Rents rising fast (+14.0%/yr); 82 active listings in the ZIP; 19 comparable units currently listed for rent nearby; rentals at typical pace (median 26d on market — plan ~3-4 weeks tenant-placement turnaround); 438 units permitted in Norfolk city in 2024 (273 in 5+ unit buildings).
- This rent runs 45% of the median local income ($73k/yr) — at the standard rent-burdened threshold; future hikes will face affordability resistance.
Forward outlook
- Local home prices are declining (-3.0%/yr); year-one equity from $2k of loan paydown is wiped out by about $10k of value loss. Plan a longer hold.
Negotiation context
- Only 6 days on market — expect competitive offers; lowballing is unlikely to land.
- 3 sale attempts with the ask held roughly flat each time — persistent listings suggest the price (not the market) is what's stuck; bring a comps-based counter.
- Current owner paid $196k; list at $350k implies a 79% gain — meaningful room to come down on a strong offer.
Risks & watch-outs
- Watch-outs: built in 1952 — expect roof / HVAC / electrical / plumbing capex.
- Climate carrying-cost: severe wind risk, 80% chance of damaging wind over 30y; extreme-heat days projected 7→16/yr by 2055 (HVAC capex compounding) — expect insurance premiums to compound above CPI over the hold.
Questions for the listing agent
- What do current leases actually rent for vs. the listed asking? Can we see a recent rent roll and the last 12 months of T-12 income?
- Built in 1952 — when were the roof, HVAC, electrical panel, plumbing, and water heater last replaced?
- Is there a deadline driving the sale (1031 exchange, divorce, estate, relocation)? That informs how much negotiation room exists.
- Schools are A-rated — typically a magnet for longer-tenancy family renters. What's the average tenant stay here, and is there a school-zone premium baked into asking?
- Crime grade is F in this area — have there been break-ins, vandalism, or insurance claims at this property in the last 3 years? What carrier currently insures it and at what premium?
- The area grade is low — what's the realistic commute time and amenity access for the typical tenant pool here? Any planned neighborhood developments (good or bad) we should know about?
- What's the average days-on-market for RENTAL listings here right now (not sales)? A rising rental-DOM trend means longer vacancies and softer asking-rent achievability than the comps imply.
- What's the recent tenant-quality profile in this submarket — average credit score on applications, eviction rate, late-payment / NSF rate, and stable-employment percentage? A property-management company in the area should have these aggregated.
- How much new for-sale + rental construction is in the pipeline within 1–3 miles? Heavy new supply typically softens prices + rents 12–24 months out; constrained supply supports both.
Investment metrics
- 1% rule
- 0.78% ✗
- Cap rate
- 5.79%
- Cash-on-cash
- -1.78%
- DSCR
- 0.92
- GRM
- 10.7
CMA / ARV
- ARV (median comp)
- $347,032
- List price
- $350,000
- Delta
- 0.86%
- Verdict
- FAIR
- Comps
- 20 within 1.0 mi
Show comp detail 12 sales within ~0.75 mi
| Address | Dist | Beds/Ba | Sqft | Sold | Price | $/sf | Match |
|---|---|---|---|---|---|---|---|
| 2924 Somme Ave | 0.20mi | 4/2.5 (-1) | 2,050 (+3%) | 2mo | $402,000 | $196 | 80 |
| 1734 Lasalle Ave | 0.31mi | 4/2.5 (-1) | 2,100 (+5%) | 0mo | $445,000 | $212 | 72 |
| 2200 Lafayette Blvd | 0.11mi | 4/3.0 (-1) | 1,809 (-10%) | 4mo | $350,000 | $193 | 69 |
| 2830 Vincent Ave | 0.47mi | 4/2.5 (-1) | 2,000 (+0%) | 5mo | $350,000 | $175 | 69 |
| 2729 Vimy Ridge Ave | 0.38mi | 4/2.0 (-1) | 2,086 (+4%) | 4mo | $255,000 | $122 | 65 |
| 2908 Tait Ter | 0.66mi | 4/3.0 (-1) | 1,994 (-0%) | 2mo | $329,900 | $165 | 60 |
| 3018 Lorraine Ave | 0.30mi | 5/2.0 | 1,709 (-14%) | 0mo | $325,000 | $190 | 60 |
| 1740 Hancock Ave | 0.51mi | 4/2.0 (-1) | 1,908 (-4%) | 4mo | $370,000 | $194 | 58 |
| 3012 Ballentine Blvd | 0.47mi | 4/2.0 (-1) | 1,840 (-8%) | 2mo | $325,000 | $177 | 57 |
| 3122 Montana Ave | 0.73mi | 4/2.5 (-1) | 1,946 (-3%) | 6mo | $300,000 | $154 | 52 |
| 1455 Ashland Cir | 0.67mi | 5/2.0 | 2,215 (+11%) | 1mo | $435,000 | $196 | 48 |
| 2509 Cottage Ave | 0.75mi | 4/2.5 (-1) | 2,250 (+13%) | 6mo | $327,500 | $146 | 34 |
Match score weights: distance 35% · size 25% · config 20% · recency 20%. Top-matched comps best support the ARV.
Projected returns pro-forma
-3.0% appreciation · 8.0% rent growth · sell at horizon
- IRR
- -14.1%
- Equity multiple
- 0.47×
- Total profit
- $-51,611
- Equity at exit
- $52,186
- IRR
- 1.0%
- Equity multiple
- 1.09×
- Total profit
- $8,532
- Equity at exit
- $30,262
Cash invested: $98,000 (down + closing). Projections, not guarantees.
Landlord ↔ Tenant lean methodology
- Overall (STATE)
- 55 Moderately Landlord-Leaning
- State Virginia
- 55 Moderately Landlord-Leaning · D+2
- County
- — inherits STATE
- City
- — inherits STATE
ZIP-level market 23509
- Home prices YoY
- -1.3%
- Rents YoY
- 14.0%
- Active inventory
- 82
- Price-to-rent
- 10.7×
Monthly cashflow live
- Estimated rent
- $2,725 high interval (Pro) →
- Mortgage (P&I)
- −$1,835
- Tax from tax record
- −$317 /mo · $3,798/yr
- Insurance
- −$146
- HOA
- −$0
- Vacancy / Maint / Mgmt
- −$572
- Net cashflow
- $-145
Break-even live
Sensitivity live
| Price | -10% $53 | -5% $-46 | +0% $-145 | +5% $-244 | +10% $-344 |
|---|---|---|---|---|---|
| Rent | -10% $-361 | -5% $-253 | +0% $-145 | +5% $-38 | +10% $70 |
| Rate | -1.0pp $31 | -0.5pp $-56 | base $-145 | +0.5pp $-236 | +1.0pp $-328 |
UW: 25.0% down · 7.5% · 30yr · 1.5% tax · 5.0% vac · 8.0% maint · 8.0% mgmt
Financing live
Cash to close
- Down payment
- $87,500
- Closing costs
- $10,500
- Reserves months
- —
- Total cash needed
- —
Loan-product check · same deal, 3 products live
Conventional
25% down · 7.5% · 30yr
- Down + closing
- —
- Monthly P&I
- —
- Monthly cashflow
- —
- DSCR
- —
- Eligible?
- —
Personal DTI + credit; lowest rate.
DSCR
20% down · 8.5% · 30yr
- Down + closing
- —
- Monthly P&I
- —
- Monthly cashflow
- —
- DSCR
- —
- Eligible?
- —
No personal income docs; deal must DSCR.
Hard money
10% down · 12.0% · 12mo
- Down + closing
- —
- Monthly P&I
- —
- Monthly cashflow
- —
- DSCR
- —
- Eligible?
- —
Short-term bridge; refi at stabilization.
Rent comps 19 comps
| Address | Beds | Baths | Sqft | Rent | $/sqft | DOM | Units | Dist |
|---|---|---|---|---|---|---|---|---|
| 2914 Peronne Ave Norfolk, VA | 4.0 | 2.0 | 1764 | $2,495 | $1.41 | 25d | 1 | 0.22mi |
| 3301 Vimy Ridge Ave Norfolk, VA | 4.0 | 2.0 | 1300 | $2,150 | $1.65 | 6d | 1 | 0.24mi |
| 1801 Saint Denis Ave Unit 3 Norfolk, VA | 4.0 | 2.0 | 1500 | $2,400 | $1.60 | 25d | 1 | 0.28mi |
| 3126 Marne Ave Norfolk, VA | 5.0 | 2.0 | 1943 | $3,000 | $1.54 | 45d | 1 | 0.34mi |
| 3414 Tidewater Dr Norfolk, VA | 4.0 | 2.5 | 2200 | $3,000 | $1.36 | 45d | 1 | 0.44mi |
| 3114 Luxembourg Ave Norfolk, VA | 4.0 | 2.5 | 2300 | $3,100 | $1.35 | 19d | 1 | 0.51mi |
| 2537 McKann Ave Norfolk, VA | 4.0 | 2.5 | 2321 | $2,695 | $1.16 | 16d | 1 | 0.73mi |
| 3640 Robin Hood Rd Norfolk, VA | 4.0 | 2.5 | 1400 | $2,999 | $2.14 | 19d | 1 | 0.75mi |
| 3541 Chesapeake Blvd Norfolk, VA | 5.0 | 1.0 | 1476 | $1,275 | $0.86 | 9d | 1 | 0.89mi |
| 3776 Wayne Cir Norfolk, VA | 4.0 | 3.0 | 2301 | $2,795 | $1.21 | 45d | 1 | 1.10mi |
| 3239 Granby St Norfolk, VA | 4.0 | 3.5 | 2350 | $2,600 | $1.11 | 14d | 1 | 1.17mi |
| 766 A Ave Norfolk, VA | 5.0 | 2.0 | 1544 | $1,400 | $0.91 | 45d | 1 | 1.20mi |
| 212 Broadway St Norfolk, VA | 4.0 | 2.5 | 2349 | $2,900 | $1.23 | 19d | 1 | 1.24mi |
| 212 Broadway St Norfolk, VA | 4.0 | 2.5 | 2350 | $2,800 | $1.19 | 16d | 1 | 1.24mi |
| 1403 Lead St Norfolk, VA | 4.0 | 2.5 | 1854 | $2,550 | $1.38 | 45d | 1 | 1.24mi |
| 220 Broadway St Norfolk, VA | 4.0 | 3.0 | 2540 | $3,500 | $1.38 | 45d | 1 | 1.26mi |
| 219 W 27th St Norfolk, VA | 5.0 | 3.5 | 2268 | $2,900 | $1.28 | 25d | 1 | 1.38mi |
| 407 Pennsylvania Ave Norfolk, VA | 4.0 | 2.5 | 2200 | $3,200 | $1.45 | 45d | 1 | 1.41mi |
| 410 W 29th St Norfolk, VA | 4.0 | 2.0 | 2001 | $2,500 | $1.25 | 16d | 1 | 1.49mi |
Listing history 17 events
-
2026-06-21days on market $350,000 Active 6 DOM
-
2026-06-18days on market $350,000 Active 3 DOM
-
2026-06-17days on market $350,000 Active 2 DOM
-
2026-06-16statusdays on market $350,000 Active 1 DOM
-
2026-05-11historical Active Under Contract 508-char remark
-
2026-05-08price $350,000 508-char remark
-
2026-04-28status Active 508-char remark
-
2026-04-20historical Active Under Contract 508-char remark
-
2026-04-14price $360,000 508-char remark
-
2026-04-02price $370,000 508-char remark
-
2026-03-23$375,000 Active 508-char remark
-
2025-11-21soldstatus $196,000
-
2014-07-28soldstatus $160,300
-
2014-06-12price $154,900 Active
-
2014-05-13price $159,900 Active
-
1983-09-30soldstatus $48,800
-
1979-12-04soldstatus $40,000
ⓘ Source: listings_history table (triggers on properties + properties_extension) + one-shot
backfill from property_details.listing_events for pre-trigger history.
Tax reassessment forecast VA · Resets to sale price
- Current annual tax
- $3,798 · $317/mo
- Projected year-2 tax
- $3,798 · $317/mo
- Expected delta
- $0/yr ($0/mo · 0.0%)
ⓘ Screening estimate from a state-policy table — verify with the county assessor before closing.
Climate risk First Street
- Flood 4/10 Moderate FEMA zone X (unshaded) · 13% chance over 30 yrs
- Wildfire 1/10 Low
- Heat 9/10 Extreme 7 d/yr ≥105°F today · 16 d/yr by 30 yrs out
- Wind 8/10 Severe 80% chance of damaging wind over 30 yrs
- Air quality 3/10 Moderate 2 unhealthy d/yr today · 5 by 30 yrs out
Nearby sold comps map
Loading sold comps map…
Walkable amenities ~0.75 mi
Loading nearby amenities…
Taxation est. · year 1
- Rental income
- $32,694
- − Mortgage interest
- −$19,605
- − Property taxes
- −$3,798
- − Insurance
- −$1,750
- − Repairs & maintenance
- −$2,616
- − Management
- −$2,616
- − Depreciation
- −$10,182
- Taxable loss
- −$7,872
- Est. tax savings @ 24.0%
- +$1,889
- After-tax cash flow
- $144/yr
For passive investors: Depreciation is non-cash, so a rental often shows a tax loss while cash-flowing — sheltering income. Rental losses are passive: they offset passive income freely, and up to $25,000/yr can offset ordinary (W-2) income if you actively participate and your MAGI is under $100k (phasing out to $0 by $150k); unused losses carry forward. On sale, claimed depreciation is recaptured at up to 25%, and gains may owe capital-gains tax (a 1031 exchange can defer both). Figures are a year-1 estimate at your 24.0% rate — not tax advice; consult a CPA.
Schools (NCES district)
- District
- Norfolk City Public School District
- NCES district ID
- 5102670
- Math proficiency
- 27% ▼ -44.00%
- Reading proficiency
- 56% ▼ -10.00%
- Median HH income
- $44,358
- Composite
- 35.08/100
- National rank
- #5026
- State rank
- #118 of 131 in VA
Livability — Norfolk
- Score
- 83/100
- State rank
- #43
- US rank
- #1026
Category grades
Schools grade is shown separately in the Schools card above.
Census & demographics
- Census place
- Norfolk, VA
- County
- Norfolk City · 214,042 people
- City population
- 214,042
- Metro
- Virginia Beach-Norfolk-Newport News, VA-NC
- Population (ZIP)
- 13,105
- Household income
- $72,816
- Rent vs Own
- Severe rent burden
- 575.0
Population outlook (Norfolk County) Hauer SSP2
- Today (2025)
- 249,032 people
- By 2030
- 252,347 · +1.3%
- By 2040
- 253,644 · +1.9%
- By 2050
- 251,913 · +1.2%
- By 2075
- 245,281 · -1.5%
- By 2100
- 219,548 · -11.8%
Race, ethnicity, and origin ACS 2023
- Neighborhood character
- Diverse neighborhood (Simpson 0.64)
- Race & ethnicity
- White 44% Black 39% Hispanic / Latino 9% Two or more races 8% Asian 2%
- Hispanic origin (detail)
- Mexican 2% Puerto Rican 2%
- Common ancestry
- Italian 4% Serbian 2% Romanian 1%
- Foreign-born
- 6% · Canada, China
- Languages at home
- 91% English-only · Spanish 5% Other Asian/Pacific 1%
Political lean MEDSL · Norfolk
- 2024 margin
- Solid D (+41.5) · D 70.0% · R 28.5% · Other 1.6%
- 2008→2024 swing
- -1.4pp toward R · 2008: 43.0pp · 2024: 41.5pp
- All cycles
- 2024: D+41.5 2020: D+45.6 2016: D+42.0 2012: D+44.0 2008: D+43.0
Not yet ingested
- Civics
- —
Market trends
- HPI YoY
- ▼ -4.16%
- Current HPI
- 321.56
- Rent YoY
- ▲ 13.99%
- Metro
- Virginia Beach-Norfolk-Newport News, VA-NC
- State GDP YoY
- ▲ 2.40%
- F500 in state
- 50
Industry mix (Fortune 500 HQ in VA)
| Industry | F500 HQs | Revenue |
|---|---|---|
| Aerospace / Defense | 4 | $236B |
|
||
| Technology / Defense | 3 | $32B |
|
||
| Financial Services | 2 | $176B |
|
||
| Utilities | 2 | $27B |
|
||
| Insurance | 2 | $25B |
|
||
| Technology | 2 | $15B |
|
||
Price history
+775.0% since first listed16 events — show timeline
- 2026-06-15 Listed $350,000 REINMLS
- 2026-05-27 Pending — REINMLS
- 2026-05-11 Contingent — REINMLS
- 2026-05-10 Listing Removed — REINMLS
- 2026-05-08 Price Changed $350,000 REINMLS
- 2026-04-28 Relisted — REINMLS
- 2026-04-20 Contingent — REINMLS
- 2026-04-14 Price Changed $360,000 REINMLS
- 2026-04-02 Price Changed $370,000 REINMLS
- 2026-03-23 Listed $375,000 REINMLS
- 2025-11-21 Sold (Public Records) $196,000 Public Records
- 2014-07-28 Sold (Public Records) $160,300 Public Records
- 2014-06-12 Price Changed $154,900 REINMLS
- 2014-05-13 Price Changed $159,900 REINMLS
- 1983-09-30 Sold (Public Records) $48,800 Public Records
- 1979-12-04 Sold (Public Records) $40,000 Public Records
Property tax history
+7.4%/yrLatest (2025): $3,798 · +10.2% YoY. Source: county tax records.
Cash-flow waterfall
monthlySold comps — $/sqft
last 12 mo · ≤1 miLoading sold comps…