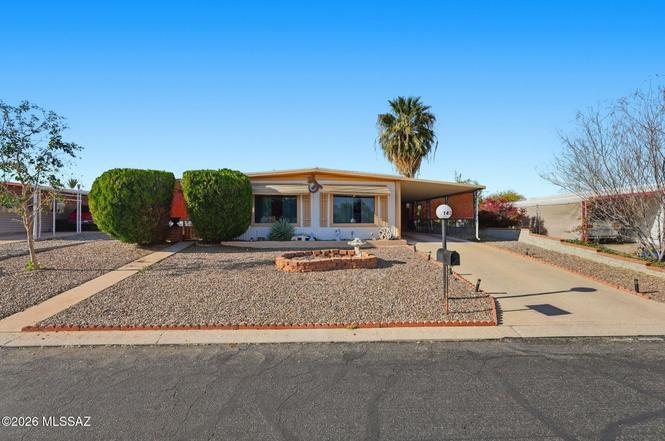
142 W Aliso Dr · Green Valley, AZ
Flood risk 1/10 · Minimal
- FEMA flood zone
- X (unshaded)
- Chance of flooding over 30 yrs
- 0.0%
- Est. flood insurance / yr
- $507 – $1,088
Fire risk 6/10 · Moderate
- Est. fire insurance / yr
- $610 – $1,132
Heat risk 7/10 · Major
- Hot days now (above 106°F)
- 6 days/yr
- Hot days in 30 yrs
- 16 days/yr
Wind risk 1/10 · Minimal
- Chance of severe wind over 30 yrs
- —
Air-quality risk 1/10 · Minimal
- Unhealthy air days now
- 0 days/yr
- Unhealthy air days in 30 yrs
- 0 days/yr
Risk factors via First Street. Map © Google.
Why this score? — see what drove the C- grade
The composite is a weighted blend of 9 inputs, each scored 0–100. Each bar is that input's sub-score; the figure is the points it added to the 100-point composite (weight × sub-score).
- Cash flow +22.7/30.0
- DSCR +7.3/10.0
- ARV discount +5.6/15.0
- 1% rule +5.1/10.0
- Rent growth +3.9/5.0
- Schools +3.3/10.0
- Livability +3.1/5.0
- Condition / age +2.5/5.0
- Appreciation +0.0/10.0
$159,000
🖨 Deal sheet 📄 Offer letter ✓ Due diligence
Listing remarks
ENJOY THE MOUNTAIN VIEWS FROM THIS CHARMING 2 BEDROOM, 2 BATH HOME. LOW MAINTENANCE DESIGN. LOCATED IN A HIGHLY SOUGHT-AFTER 55+C0MMUNITY. THE BEST PART? YOU OWN YOUR LOT. A/C AND GAS HEAT FOR COMFORT. ALL APPLIANCES INCLUDED. SIZEABLE WORKSHOP FOR TINKERING OR STORAGE. RELAX ON YOUR PRIVATE PATIO OR ENJOY FULL ACCESS TO THE RECREATIONAL FACILITIES. HOA ONLY $65.00 MO. GREAT LOCATION, CLOSE TO SHOPPING, RESTAURANTS, MEDICAL FACILITIES, AND GOLF. NO GVR BUT IT IS AVAILABLE.
Key facts
- 5,271 sq ft lot
- Garage
- Community pool
Property features AI
Finance
- HOA & community: Pueblo Estates association with monthly HOA fee ($65); HOA transfer fee ($250); HOA covers common area and street maintenance; Community clubhouse, pool, spa/hot tub, recreation room, fitness center, lighted areas, paved streets
Exterior
- Parking: Attached garage; 2 covered/carport spaces
- Security: Smoke detector(s); Carbon monoxide detector(s)
- Utilities: Public water; Sewer connected
- Home design: Mobile home; Single-story; Faces south
- Construction: 1,152 living area
- Exterior features: Block fencing; Previously developed lot; Paved roads
Interior
- Kitchen: Disposal; Refrigerator; Gas range
- Flooring: Laminate
- Bathrooms: 2 full bathrooms
- Heating & cooling: Forced air heating (natural gas); Central air conditioning; Ceiling fans
- Interior features: Skylights; Smoke and carbon monoxide detectors
- Laundry & utility: Laundry closet with washer and dryer
Neighborhood map
What this means for you Summary
Snapshot
- This is a 2-bed/2.0-bath manufactured listed at $159k.
Deal economics
- At list price, monthly cash flow is $273 ($3k/yr) — positive.
- The deal already cash-flows at list — no discount required.
- Meets the 1% rule at list price ($2k rent vs $159k).
- Recommended offer: $140k (12.0% below list) — sets the bar for market timing.
- Cap rate 8.4% vs local median 4.5% in Green Valley — top-decile yield for the area; either an underpriced asset or a hidden risk that comps aren't pricing in. Stress-test before assuming the spread holds.
Location & tenants
- Location reads 61/100 on livability (#165 in AZ) — a middle-class / working-renter tenant base. Strengths: cost of living A+, housing A+; Watch: amenities F, commute F, health & safety F.
- Continental Elementary District (4416) (rural): math 35% / reading 42% proficiency, ranked #72 of 249 in AZ (top 29%) — families likely to look elsewhere, expect single-tenant / working-renter base with shorter leases; only 19% free/reduced lunch — higher-income household profile.
- Zoned schools: Continental Elementary School (math 35% / reading 42%, grade F, #418 of 1,109 statewide, top 38%, 639 students, 31% FRL).
- Market conditions: Rents rising fast (+5.6%/yr); 411 active listings in the ZIP; 14 comparable units currently listed for rent nearby; rentals leasing fast (median 11d on market — plan ~1-2 weeks tenant-placement turnaround); 5,268 units permitted in Pima County in 2024 (996 in 5+ unit buildings).
Forward outlook
- Local home prices are declining (-3.0%/yr); year-one equity from $1k of loan paydown is wiped out by about $5k of value loss. Plan a longer hold.
- Pima County population projected at +8% by 2050 — modest demand growth; plan on rents tracking national, not racing it.
- At projected returns (-3.0% appreciation + 5.6% rent growth), your $45k cash investment doubles in ~10 years — after that, you're playing with house money.
Negotiation context
- It's been on market 131 days — a 12% lower offer ($140k) is reasonable based on typical stale-listing flexibility.
- Current owner paid $40k; list at $159k implies a 298% gain — meaningful room to come down on a strong offer.
Risks & watch-outs
- Climate carrying-cost: major wildfire risk; extreme-heat days projected 6→16/yr by 2055 (HVAC capex compounding) — expect insurance premiums to compound above CPI over the hold.
Questions for the listing agent
- It's been on market 131 days. Have you received any prior offers? Is the seller open to a 12% concession, seller financing, or rate buy-down credit?
- Built in 1970 — when were the roof, HVAC, electrical panel, plumbing, and water heater last replaced?
- What does the HOA fee cover, when was the last increase, and are there any pending special assessments or reserve-fund shortfalls?
- Why hasn't it sold? Are there any deal-killer items the seller is aware of (foundation, flood, title, zoning, code violations)?
- Is there a deadline driving the sale (1031 exchange, divorce, estate, relocation)? That informs how much negotiation room exists.
- What's the average days-on-market for RENTAL listings here right now (not sales)? A rising rental-DOM trend means longer vacancies and softer asking-rent achievability than the comps imply.
- What's the recent tenant-quality profile in this submarket — average credit score on applications, eviction rate, late-payment / NSF rate, and stable-employment percentage? A property-management company in the area should have these aggregated.
- How much new for-sale + rental construction is in the pipeline within 1–3 miles? Heavy new supply typically softens prices + rents 12–24 months out; constrained supply supports both.
Investment metrics
- 1% rule
- 1.01% ✓
- Cap rate
- 8.35%
- Cash-on-cash
- 7.35%
- DSCR
- 1.33
- GRM
- 8.3
CMA / ARV
- ARV (on-the-fly)
- $152,400
- Comps found
- 12
Show comp detail 12 sales within ~0.75 mi
| Address | Dist | Beds/Ba | Sqft | Sold | Price | $/sf | Match |
|---|---|---|---|---|---|---|---|
| 267 W Tuna Dr | 0.11mi | 2/2.0 | 1,248 (+4%) | 3mo | $189,000 | $151 | 86 |
| 266 W Pinon Dr | 0.17mi | 2/2.0 | 1,232 (+3%) | 2mo | $168,000 | $136 | 86 |
| 167 W Cedro Dr | 0.11mi | 2/2.0 | 1,248 (+4%) | 5mo | $158,000 | $127 | 84 |
| 32 W Pinon Dr | 0.19mi | 2/1.0 | 1,190 (-1%) | 5mo | $118,000 | $99 | 82 |
| 269 W Mora Dr | 0.14mi | 3/2.0 (+1) | 1,152 (-4%) | 1mo | $150,000 | $130 | 81 |
| 270 W Palma Dr | 0.23mi | 1/2.0 (-1) | 1,196 (-0%) | 7mo | $190,000 | $159 | 78 |
| 247 W Palma Dr | 0.23mi | 2/2.0 | 1,248 (+4%) | 7mo | $140,000 | $112 | 77 |
| 182 W Palma Dr | 0.14mi | 2/2.0 | 1,320 (+10%) | 3mo | $155,000 | $117 | 74 |
| 30 W Rosa Dr | 0.16mi | 2/2.0 | 1,344 (+12%) | 2mo | $143,500 | $107 | 71 |
| 209 W Rama Dr | 0.10mi | 2/2.0 | 1,064 (-11%) | 8mo | $90,000 | $85 | 70 |
| 161 W Olive Dr | 0.12mi | 3/2.0 (+1) | 1,347 (+12%) | 1mo | $107,500 | $80 | 69 |
| 145 W Pinon Dr | 0.25mi | 2/2.0 | 1,344 (+12%) | 0mo | $195,000 | $145 | 68 |
Match score weights: distance 35% · size 25% · config 20% · recency 20%. Top-matched comps best support the ARV.
Projected returns pro-forma
-3.0% appreciation · 5.6% rent growth · sell at horizon
- IRR
- -2.4%
- Equity multiple
- 0.91×
- Total profit
- $-4,124
- Equity at exit
- $23,707
- IRR
- 9.8%
- Equity multiple
- 1.84×
- Total profit
- $37,266
- Equity at exit
- $13,747
Cash invested: $44,520 (down + closing). Projections, not guarantees.
Landlord ↔ Tenant lean methodology
- Overall (STATE)
- 87 Strongly Landlord-Friendly
- State Arizona
- 87 Strongly Landlord-Friendly · R+3
- County
- — inherits STATE
- City
- — inherits STATE
ZIP-level market 85614
- Rents YoY
- 5.6%
- Active inventory
- 411
- Price-to-rent
- 8.3×
Monthly cashflow live
- Estimated rent
- $1,605 high interval (Pro) →
- Mortgage (P&I)
- −$834
- Tax from tax record
- −$30 /mo · $364/yr
- Insurance
- −$66
- HOA
- −$65
- Vacancy / Maint / Mgmt
- −$337
- Net cashflow
- $273
Break-even live
UW: 25.0% down · 7.5% · 30yr · 1.5% tax · 5.0% vac · 8.0% maint · 8.0% mgmt
Financing live
Cash to close
- Down payment
- $39,750
- Closing costs
- $4,770
- Reserves months
- —
- Total cash needed
- —
Loan-product check · same deal, 3 products live
Conventional
25% down · 7.5% · 30yr
- Down + closing
- —
- Monthly P&I
- —
- Monthly cashflow
- —
- DSCR
- —
- Eligible?
- —
Personal DTI + credit; lowest rate.
DSCR
20% down · 8.5% · 30yr
- Down + closing
- —
- Monthly P&I
- —
- Monthly cashflow
- —
- DSCR
- —
- Eligible?
- —
No personal income docs; deal must DSCR.
Hard money
10% down · 12.0% · 12mo
- Down + closing
- —
- Monthly P&I
- —
- Monthly cashflow
- —
- DSCR
- —
- Eligible?
- —
Short-term bridge; refi at stabilization.
Rent comps 14 comps
| Address | Beds | Baths | Sqft | Rent | $/sqft | DOM | Units | Dist |
|---|---|---|---|---|---|---|---|---|
| 1567 N Paseo La Tinaja Green Valley, AZ | 2.0 | 2.0 | 1071 | $1,250 | $1.17 | 2d | 1 | 0.37mi |
| 1091 W Beta St Green Valley, AZ | 2.0–3.0 | 2.0 | 917 | $1,350 | $1.47 | 2d | 5 | 0.42mi |
| 312 E Calle Cerita Green Valley, AZ | 3.0 | 2.0 | 1406 | $1,700 | $1.21 | 10d | 1 | 0.75mi |
| 2181 N Avenida Tabica Green Valley, AZ | 3.0 | 2.0 | 1433 | $1,695 | $1.18 | 2d | 1 | 0.76mi |
| 457 W Windham Blvd Green Valley, AZ | 2.0 | 2.0 | 1369 | $2,300 | $1.68 | 2d | 1 | 0.76mi |
| 18878 S Esherton Dr Green Valley, AZ | 3.0 | 2.0 | 1329 | $1,850 | $1.39 | 24d | 1 | 0.79mi |
| 724 W Rio Moctezuma Green Valley, AZ | 2.0 | 2.0 | 1234 | $1,450 | $1.18 | 10d | 1 | 0.84mi |
| 18828 S Esherton Dr Green Valley, AZ | 3.0 | 2.5 | 1466 | $1,625 | $1.11 | 3d | 1 | 0.86mi |
| 18744 S Via Santa Bonita Sahuarita, AZ | 2.0 | 2.0 | 1261 | $1,595 | $1.26 | 44d | 1 | 0.96mi |
| 2535 N Avenida Tabica Green Valley, AZ | 3.0 | 2.0 | 1483 | $1,725 | $1.16 | 44d | 1 | 1.00mi |
| 390 N Calle de las Profetas Green Valley, AZ | 2.0 | 1.0 | 965 | $1,250 | $1.30 | 3d | 1 | 1.38mi |
| 359 N Calle del Chancero Green Valley, AZ | 2.0 | 2.0 | 1061 | $1,475 | $1.39 | 16d | 1 | 1.42mi |
| 327 N Calle del Chancero Green Valley, AZ | 2.0 | 2.0 | 1343 | $1,400 | $1.04 | 3d | 1 | 1.46mi |
| 936 W Placita Canalito Green Valley, AZ | 3.0 | 2.0 | 1258 | $1,715 | $1.36 | 12d | 1 | 1.48mi |
HOA detail
- Monthly dues
- $65 · $780/yr
- Likely covers
- gas
Listing history 15 events
-
2026-06-18days on market $159,000 Active 131 DOM
-
2026-06-17days on market $159,000 Active 130 DOM
-
2026-06-16days on market $159,000 Active 129 DOM
-
2026-06-15days on market $159,000 Active 128 DOM
-
2026-06-13days on market $159,000 Active 126 DOM
-
2026-06-10days on market $159,000 Active 123 DOM
-
2026-06-09days on market $159,000 Active 122 DOM
-
2026-06-08days on market $159,000 Active 121 DOM
-
2026-06-07days on market $159,000 Active 120 DOM
-
2026-06-03days on market $159,000 Active 116 DOM
-
2026-06-02days on market $159,000 Active 115 DOM
-
2026-06-01days on market $159,000 Active 114 DOM
-
2026-05-31days on market $159,000 Active 113 DOM
-
2026-02-07$170,000 Active
-
2003-09-26soldstatus $40,000
ⓘ Source: listings_history table (triggers on properties + properties_extension) + one-shot
backfill from property_details.listing_events for pre-trigger history.
Tax reassessment forecast AZ · Resets to sale price
- Current annual tax
- $364 · $30/mo
- Projected year-2 tax
- $1,049 · $87/mo
- Expected delta
- +$686/yr (+$57/mo · 188.4%)
ⓘ Screening estimate from a state-policy table — verify with the county assessor before closing.
Climate risk First Street
- Flood 1/10 Low FEMA zone X (unshaded) · 0% chance over 30 yrs
- Wildfire 6/10 Major
- Heat 7/10 Severe 6 d/yr ≥106°F today · 16 d/yr by 30 yrs out
- Wind 1/10 Low
- Air quality 1/10 Low 0 unhealthy d/yr today · 0 by 30 yrs out
Nearby sold comps map
Loading sold comps map…
Walkable amenities ~0.75 mi
Loading nearby amenities…
Taxation est. · year 1
- Rental income
- $19,263
- − Mortgage interest
- −$8,906
- − Property taxes
- −$364
- − Insurance
- −$795
- − Repairs & maintenance
- −$1,541
- − Management
- −$1,541
- − HOA
- −$780
- − Depreciation
- −$4,625
- Taxable income
- $710
- Est. tax owed @ 24.0%
- −$170
- After-tax cash flow
- $3,103/yr
For passive investors: Depreciation is non-cash, so a rental often shows a tax loss while cash-flowing — sheltering income. Rental losses are passive: they offset passive income freely, and up to $25,000/yr can offset ordinary (W-2) income if you actively participate and your MAGI is under $100k (phasing out to $0 by $150k); unused losses carry forward. On sale, claimed depreciation is recaptured at up to 25%, and gains may owe capital-gains tax (a 1031 exchange can defer both). Figures are a year-1 estimate at your 24.0% rate — not tax advice; consult a CPA.
Schools (NCES district)
- District
- Continental Elementary District (4416)
- NCES district ID
- 0402250
- Math proficiency
- 35% ▼ -11.00%
- Reading proficiency
- 42% ▬ 0.00%
- Median HH income
- $48,475
- Composite
- 33.08/100
- National rank
- #5565
- State rank
- #72 of 249 in AZ
Livability — Green Valley
- Score
- 61/100
- State rank
- #165
- US rank
- #18276
Category grades
Schools grade is shown separately in the Schools card above.
Census & demographics
- Census place
- Green Valley, AZ
- County
- Pima County · 1,012,107 people
- City population
- 25,381
- Metro
- Tucson, AZ
- Population (ZIP)
- 25,381
- Household income
- $64,879
- Rent vs Own
- Severe rent burden
- 860.0
Population outlook (Pima County) Hauer SSP2
- Today (2025)
- 1,066,056 people
- By 2030
- 1,086,684 · +1.9%
- By 2040
- 1,117,160 · +4.8%
- By 2050
- 1,149,778 · +7.9%
- By 2075
- 1,271,480 · +19.3%
- By 2100
- 1,321,160 · +23.9%
Race, ethnicity, and origin ACS 2023
- Neighborhood character
- Predominantly White (80%)
- Race & ethnicity
- White 80% Hispanic / Latino 15% Two or more races 7% Black 2%
- Hispanic origin (detail)
- Mexican 14%
- Common ancestry
- Portuguese 4% Slovak 4% Italian 3%
- Foreign-born
- 8% · Canada, China
- Languages at home
- 87% English-only · Spanish 9% French/Haitian/Cajun 1% German/W. Germanic 0%
Political lean MEDSL · Pima
- 2024 margin
- D (+15.2) · D 57.0% · R 41.8% · Other 1.2%
- 2008→2024 swing
- +9.1pp toward D · 2008: 6.1pp · 2024: 15.2pp
- All cycles
- 2024: D+15.2 2020: D+18.7 2016: D+13.5 2012: D+5.8 2008: D+6.1
Not yet ingested
- Civics
- —
Market trends
- HPI YoY
- ▼ -231.05%
- Current HPI
- 250.5933
- Rent YoY
- ▲ 5.60%
- Metro
- Tucson, AZ
- State GDP YoY
- ▲ 4.54%
- F500 in state
- 20
Industry mix (Fortune 500 HQ in AZ)
| Industry | F500 HQs | Revenue |
|---|---|---|
| Technology | 2 | $13B |
|
||
| Mining / Metals | 1 | $23B |
|
||
| Environmental Services | 1 | $16B |
|
||
| Metals / Steel | 1 | $14B |
|
||
| Technology Distribution | 1 | $9B |
|
||
| Homebuilding | 1 | $8B |
|
||
Price history
+325.0% since first listed2 events — show timeline
- 2026-02-07 Listed $170,000 MLSSAZ
- 2003-09-26 Sold (Public Records) $40,000 Public Records
Property tax history
-2.8%/yrLatest (2025): $364 · +9.0% YoY. Source: county tax records.
Cash-flow waterfall
monthlySold comps — $/sqft
last 12 mo · ≤1 miLoading sold comps…