5437 Stag Mountain Rd · Lake Shastina, CA
Flood risk 7/10 · Major
- FEMA flood zone
- X (unshaded)
- Chance of flooding over 30 yrs
- 0.78%
- Est. flood insurance / yr
- $507 – $1,088
Fire risk 6/10 · Moderate
- Est. fire insurance / yr
- $659 – $1,223
Heat risk 6/10 · Moderate
- Hot days now (above 92°F)
- 7 days/yr
- Hot days in 30 yrs
- 16 days/yr
Wind risk 1/10 · Minimal
- Chance of severe wind over 30 yrs
- —
Air-quality risk 10/10 · Severe
- Unhealthy air days now
- 31 days/yr
- Unhealthy air days in 30 yrs
- 34 days/yr
Risk factors via First Street. Map © Google.
Why this score? — see what drove the C+ grade
The composite is a weighted blend of 9 inputs, each scored 0–100. Each bar is that input's sub-score; the figure is the points it added to the 100-point composite (weight × sub-score).
- Cash flow +23.1/30.0
- ARV discount +15.0/15.0
- DSCR +7.4/10.0
- 1% rule +5.4/10.0
- Schools +3.6/10.0
- Rent growth +2.5/5.0
- Livability +2.5/5.0
- Condition / age +2.5/5.0
- Appreciation +0.0/10.0
$212,000
🖨 Deal sheet 📄 Offer letter ✓ Due diligence
Listing remarks
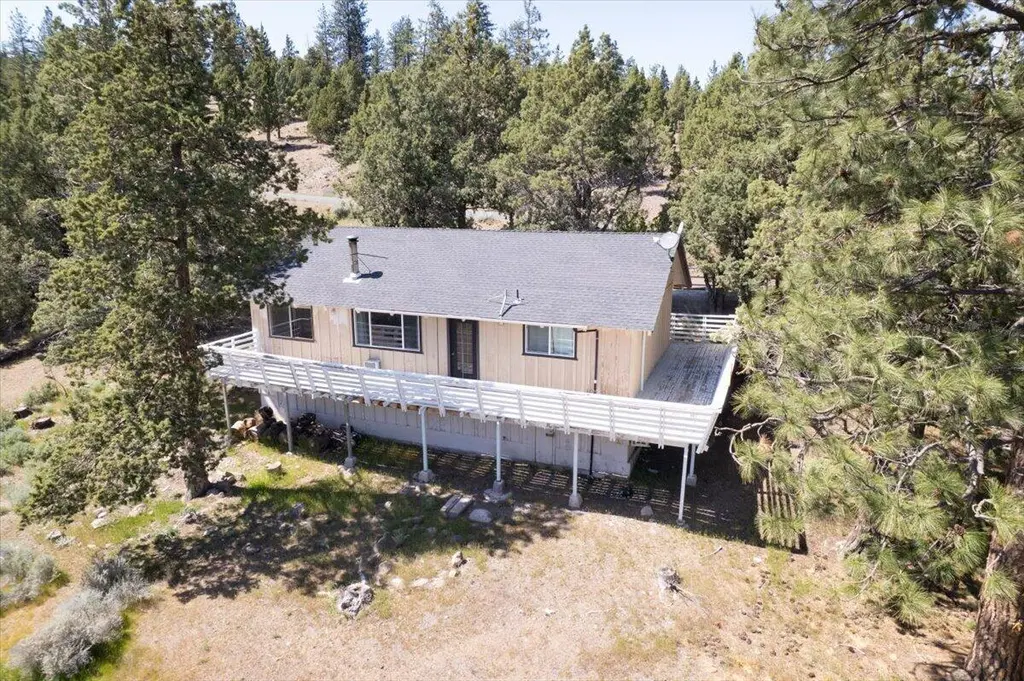
This charming two-bed, two-bath home in Lake Shastina offers the perfect blend of comfort and breathtaking views. Tucked away with stunning vistas of Mount Shasta, it features a cozy wood stove, efficient mini-split heating and cooling, and a spacious wrap-around deck--ideal for relaxing and taking in the scenery. With two bedrooms and two full bathrooms, it's perfect for couples or small families looking for a peaceful retreat in this desirable community. Come see why this cute home is a true gem!
Key facts
- Breathtaking views
- Cozy wood stove
- 0.38 acre lot
Tags
Property features AI
Finance
- Other: Property type: Residential
- HOA & community: Homeowners association with a $35 fee
Exterior
- Parking: Oversized parking
- Utilities: 220-volt electric service; Public sewer
- Home design: Single-family residence; One level
- Construction: Wood siding; Composition roof; Concrete perimeter foundation; Built as residential single-family home
- Exterior features: Steep slope lot; Gravel road access; Has a view; No pool
Interior
- Kitchen: Refrigerator
- Flooring: Wood flooring
- Bathrooms: 2 full bathrooms
- Heating & cooling: Has heating; Ductless cooling
- Interior features: Wood-burning stove fireplace; Refrigerator included; Washer included
- Laundry & utility: Washer
Neighborhood map
What this means for you Summary
Snapshot
- This is a 3-bed/1.0-bath single-family listed at $212k.
Deal economics
- At list price, monthly cash flow is $314 ($4k/yr) — positive.
- The deal already cash-flows at list — no discount required.
- Meets the 1% rule at list price ($2k rent vs $212k).
- Recommended offer: $206k (3.0% below list) — sets the bar for market timing.
- Cap rate 8.4% vs local median 3.5% in Lake Shastina — top-decile yield for the area; either an underpriced asset or a hidden risk that comps aren't pricing in. Stress-test before assuming the spread holds.
Location & tenants
- Location reads: area grade C — affects rentability + tenant quality, not the cash-flow math above.
- Siskiyou Union High (rural): math 25% / reading 55% proficiency, ranked #763 of 1,400 in CA (top 54%) — families likely to look elsewhere, expect single-tenant / working-renter base with shorter leases; only 12% free/reduced lunch — higher-income household profile.
- Market conditions: 273 active listings in the ZIP; 1 comparable units currently listed for rent nearby; 50 units permitted in Siskiyou County in 2024 (0 in 5+ unit buildings).
Forward outlook
- Local home prices are declining (-3.0%/yr); year-one equity from $1k of loan paydown is wiped out by about $6k of value loss. Plan a longer hold.
- Siskiyou County population projected at -26% by 2050 — secular population decline; favor cash flow + early exit over multi-decade hold.
Negotiation context
- It's been on market 56 days — a 3% lower offer ($206k) is reasonable based on typical stale-listing flexibility.
- Current owner paid $138k; list at $212k implies a 54% gain — meaningful room to come down on a strong offer.
Risks & watch-outs
- Watch-outs: flood insurance adds $66/mo.
- Climate carrying-cost: major flood risk; major wildfire risk; extreme-heat days projected 7→16/yr by 2055 (HVAC capex compounding) — expect insurance premiums to compound above CPI over the hold.
Questions for the listing agent
- It's been on market 56 days. Have you received any prior offers? Is the seller open to a 3% concession, seller financing, or rate buy-down credit?
- Built in 1974 — when were the roof, HVAC, electrical panel, plumbing, and water heater last replaced?
- What's the actual annual flood-insurance premium (NFIP or private), and is the property in a SFHA with mandatory coverage?
- What does the HOA fee cover, when was the last increase, and are there any pending special assessments or reserve-fund shortfalls?
- Is there a deadline driving the sale (1031 exchange, divorce, estate, relocation)? That informs how much negotiation room exists.
- What's the average days-on-market for RENTAL listings here right now (not sales)? A rising rental-DOM trend means longer vacancies and softer asking-rent achievability than the comps imply.
- What's the recent tenant-quality profile in this submarket — average credit score on applications, eviction rate, late-payment / NSF rate, and stable-employment percentage? A property-management company in the area should have these aggregated.
- How much new for-sale + rental construction is in the pipeline within 1–3 miles? Heavy new supply typically softens prices + rents 12–24 months out; constrained supply supports both.
Investment metrics
- 1% rule
- 1.04% ✓
- Cap rate
- 8.45%
- Cash-on-cash
- 7.69%
- DSCR
- 1.34
- GRM
- 8.0
CMA / ARV
- ARV (on-the-fly)
- $299,904
- Comps found
- 2
Show comp detail 2 sales within ~0.75 mi
| Address | Dist | Beds/Ba | Sqft | Sold | Price | $/sf | Match |
|---|---|---|---|---|---|---|---|
| 5001 Indian Island Rd | 0.26mi | 2/2.0 (-1) | 1,092 (+3%) | 20mo | $310,000 | $284 | 57 |
| 4143 Rainbow Dr | 0.48mi | 2/1.0 (-1) | 1,166 (+10%) | 22mo | $235,000 | $202 | 37 |
Match score weights: distance 35% · size 25% · config 20% · recency 20%. Top-matched comps best support the ARV.
Projected returns pro-forma
-3.0% appreciation · 3.0% rent growth · sell at horizon
- IRR
- -6.5%
- Equity multiple
- 0.76×
- Total profit
- $-14,352
- Equity at exit
- $31,610
- IRR
- 3.1%
- Equity multiple
- 1.22×
- Total profit
- $13,280
- Equity at exit
- $18,330
Cash invested: $59,360 (down + closing). Projections, not guarantees.
Landlord ↔ Tenant lean methodology
- Overall (STATE)
- 18 Strongly Tenant-Friendly
- State California
- 18 Strongly Tenant-Friendly · D+13
- County
- — inherits STATE
- City
- — inherits STATE
ZIP-level market 96094
- Active inventory
- 273
- Price-to-rent
- 8.0×
Monthly cashflow live
- Estimated rent
- $2,200 medium interval (Pro) →
- Mortgage (P&I)
- −$1,112
- Tax from tax record
- −$123 /mo · $1,471/yr
- Insurance
- −$88
- Flood insurance flood zone
- −$66 /mo · $798/yr
- HOA
- −$35
- Vacancy / Maint / Mgmt
- −$462
- Net cashflow
- $314
Break-even live
UW: 25.0% down · 7.5% · 30yr · 1.5% tax · 5.0% vac · 8.0% maint · 8.0% mgmt
Financing live
Cash to close
- Down payment
- $53,000
- Closing costs
- $6,360
- Reserves months
- —
- Total cash needed
- —
Loan-product check · same deal, 3 products live
Conventional
25% down · 7.5% · 30yr
- Down + closing
- —
- Monthly P&I
- —
- Monthly cashflow
- —
- DSCR
- —
- Eligible?
- —
Personal DTI + credit; lowest rate.
DSCR
20% down · 8.5% · 30yr
- Down + closing
- —
- Monthly P&I
- —
- Monthly cashflow
- —
- DSCR
- —
- Eligible?
- —
No personal income docs; deal must DSCR.
Hard money
10% down · 12.0% · 12mo
- Down + closing
- —
- Monthly P&I
- —
- Monthly cashflow
- —
- DSCR
- —
- Eligible?
- —
Short-term bridge; refi at stabilization.
Rent comps 1 comps
| Address | Beds | Baths | Sqft | Rent | $/sqft | DOM | Units | Dist |
|---|---|---|---|---|---|---|---|---|
| 5407 Stag Mountain Rd Weed, CA | 3.0 | 2.0 | 1450 | $2,200 | $1.52 | 44d | 1 | 0.03mi |
HOA detail
- Monthly dues
- $35 · $420/yr
Listing history 20 events
-
2026-06-19days on market $212,000 Active 56 DOM
-
2026-06-18days on market $212,000 Active 55 DOM
-
2026-06-17days on market $212,000 Active 54 DOM
-
2026-06-16days on market $212,000 Active 53 DOM
-
2026-06-15days on market $212,000 Active 52 DOM
-
2026-06-14days on market $212,000 Active 50 DOM
-
2026-06-12days on market $212,000 Active 49 DOM
-
2026-06-09days on market $212,000 Active 46 DOM
-
2026-06-08days on market $212,000 Active 45 DOM
-
2026-06-07days on market $212,000 Active 44 DOM
-
2026-06-07days on market $212,000 Active 43 DOM
-
2026-06-05days on market $212,000 Active 42 DOM
-
2026-06-04days on market $212,000 Active 40 DOM
-
2026-06-02days on market $212,000 Active 39 DOM
-
2026-06-01days on market $212,000 Active 38 DOM
-
2026-05-31days on market $212,000 Active 37 DOM
-
2026-05-31days on market $212,000 Active 36 DOM
-
2026-04-24$212,000 Active
-
2004-06-18soldstatus $137,500
-
1993-07-13soldstatus $65,000
ⓘ Source: listings_history table (triggers on properties + properties_extension) + one-shot
backfill from property_details.listing_events for pre-trigger history.
Tax reassessment forecast CA · Resets to sale price
- Current annual tax
- $1,471 · $123/mo
- Projected year-2 tax
- $1,611 · $134/mo
- Expected delta
- +$141/yr (+$12/mo · 9.6%)
ⓘ Screening estimate from a state-policy table — verify with the county assessor before closing.
Climate risk First Street
- Flood 7/10 Severe FEMA zone X (unshaded) · 78% chance over 30 yrs
- Wildfire 6/10 Major
- Heat 6/10 Major 7 d/yr ≥92°F today · 16 d/yr by 30 yrs out
- Wind 1/10 Low
- Air quality 10/10 Extreme 31 unhealthy d/yr today · 34 by 30 yrs out
Nearby sold comps map
Loading sold comps map…
Walkable amenities ~0.75 mi
Loading nearby amenities…
Taxation est. · year 1
- Rental income
- $26,400
- − Mortgage interest
- −$11,875
- − Property taxes
- −$1,471
- − Insurance
- −$1,858
- − Repairs & maintenance
- −$2,112
- − Management
- −$2,112
- − HOA
- −$420
- − Depreciation
- −$6,167
- Taxable income
- $385
- Est. tax owed @ 24.0%
- −$92
- After-tax cash flow
- $3,674/yr
For passive investors: Depreciation is non-cash, so a rental often shows a tax loss while cash-flowing — sheltering income. Rental losses are passive: they offset passive income freely, and up to $25,000/yr can offset ordinary (W-2) income if you actively participate and your MAGI is under $100k (phasing out to $0 by $150k); unused losses carry forward. On sale, claimed depreciation is recaptured at up to 25%, and gains may owe capital-gains tax (a 1031 exchange can defer both). Figures are a year-1 estimate at your 24.0% rate — not tax advice; consult a CPA.
Schools (NCES district)
- District
- Siskiyou Union High
- NCES district ID
- 0636940
- Math proficiency
- 25% ▲ 5.00%
- Reading proficiency
- 55% ▲ 5.00%
- Median HH income
- $39,293
- Composite
- 35.84/100
- National rank
- #9605
- State rank
- #763 of 1400 in CA
Livability — Lake Shastina
No livability data for this city. (Only ~50 U.S. cities are tracked.)
Census & demographics
- Census place
- Lake Shastina, CA
- Population (ZIP)
- 6,674
Population outlook (Siskiyou County) Hauer SSP2
- Today (2025)
- 39,337 people
- By 2030
- 36,930 · -6.1%
- By 2040
- 32,367 · -17.7%
- By 2050
- 29,030 · -26.2%
- By 2075
- 23,534 · -40.2%
- By 2100
- 19,312 · -50.9%
Race, ethnicity, and origin ACS 2023
- Neighborhood character
- Predominantly White (69%)
- Race & ethnicity
- White 69% Hispanic / Latino 16% Two or more races 8% Black 4% Asian 4% Native American 2%
- Hispanic origin (detail)
- Mexican 13%
- Common ancestry
- Russian 4% Lithuanian 3% Italian 3%
- Foreign-born
- 6% · Canada, China
- Languages at home
- 88% English-only · Spanish 9% Other Asian/Pacific 1% German/W. Germanic 1%
Political lean MEDSL · Siskiyou
- 2024 margin
- R (+19.2) · D 38.8% · R 58.0% · Other 3.2%
- 2008→2024 swing
- -8.8pp toward R · 2008: -10.4pp · 2024: -19.2pp
- All cycles
- 2024: R+19.2 2020: R+15.8 2016: R+20.7 2012: R+15.6 2008: R+10.4
Not yet ingested
- Civics
- —
Market trends
- HPI YoY
- ▼ -170.11%
- Current HPI
- 152.605
- Rent YoY
- —
- Metro
- —
- State GDP YoY
- ▲ 3.21%
- F500 in state
- 116
Industry mix (Fortune 500 HQ in CA)
| Industry | F500 HQs | Revenue |
|---|---|---|
| Technology | 27 | $1,492B |
|
||
| Financial Services | 3 | $174B |
|
||
| Retail | 3 | $44B |
|
||
| Insurance | 3 | $26B |
|
||
| Media / Entertainment | 2 | $115B |
|
||
| Pharmaceuticals / Biotech | 2 | $62B |
|
||
Price history
+226.2% since first listed3 events — show timeline
- 2026-04-24 Listed $212,000 SAOR
- 2004-06-18 Sold (Public Records) $137,500 Public Records
- 1993-07-13 Sold (Public Records) $65,000 Public Records
Property tax history
+3.0%/yrLatest (2025): $1,471 · -2.5% YoY. Source: county tax records.
Cash-flow waterfall
monthlySold comps — $/sqft
last 12 mo · ≤1 miLoading sold comps…