 Multi-family
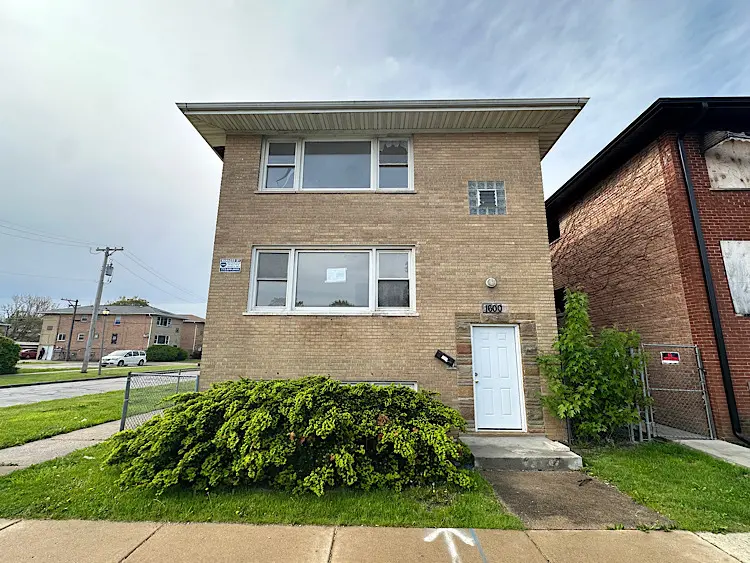
1600 Madison St · Maywood, IL
Flood risk 5/10 · Moderate
- FEMA flood zone
- X (unshaded)
- Chance of flooding over 30 yrs
- 0.47%
- Est. flood insurance / yr
- $473 – $860
Fire risk 1/10 · Minimal
- Est. fire insurance / yr
- $804 – $1,492
Heat risk 3/10 · Minor
- Hot days now (above 101°F)
- 7 days/yr
- Hot days in 30 yrs
- 14 days/yr
Wind risk 2/10 · Minimal
- Chance of severe wind over 30 yrs
- 1.0%
Air-quality risk 4/10 · Minor
- Unhealthy air days now
- 6 days/yr
- Unhealthy air days in 30 yrs
- 7 days/yr
Risk factors via First Street. Map © Google.
Why this score? — see what drove the C- grade
The composite is a weighted blend of 9 inputs, each scored 0–100. Each bar is that input's sub-score; the figure is the points it added to the 100-point composite (weight × sub-score).
- Cash flow +20.4/30.0
- 1% rule +8.1/10.0
- ARV discount +7.5/15.0
- DSCR +6.5/10.0
- Livability +3.9/5.0
- Rent growth +2.5/5.0
- Condition / age +2.5/5.0
- Schools +1.9/10.0
- Appreciation +0.0/10.0
$360,000
🖨 Deal sheet 📄 Offer letter ✓ Due diligence
Multi-family units
County records classify this as Multi-Family (2-4 Unit). Listing-text estimate: 1 unit. estimate disagrees with records
Listing remarks MLS
Great income producing property, perfect investment or primary residence. Updated all around with a newer roof, windows, plumbing, and doors. Newer electrical, plumbing and heating in all the units. All separate furnaces, water heaters. Neutral decor with refinished hardwood floors in the 2 - 3 BR apartments. Ceramic floors in the basement apt. Remodeled kitchen and baths. Ready for immediate possession. Great investment!Can be sold in a package with 1024 s 11th Ave which is identical as building.
Key facts
- Close to schools
- North facing
- Corner lot
Tags
Property features AI
Finance
- Other: Three total units in the building; Possession at closing
- Financial info: Special service area: No
Exterior
- Parking: Three owned parking spaces
- Utilities: Public water; Public sewer
- Home design: Two- to four-unit multi-family property; Fee simple ownership; Building age approximately 51–60 years; Brick exterior; Built before 1978
- Construction: Brick construction
- Exterior features: Lot dimensions approximately 38 x 124; Lot under 0.25 acre; Zoned for multi-family
Interior
- Kitchen: Unit 1: Stove, Refrigerator; Unit 2: Stove; Unit 3: Stove
- Bedrooms: Eight total bedrooms (distributed across units: two 3-bedroom units and one 2-bedroom unit)
- Bathrooms: Three full bathrooms (one in each unit)
- Heating & cooling: Natural gas forced-air heating
- Interior features: Finished full basement; 14 total rooms; Three 3-bedroom units in the building
- Laundry & utility: Tenants pay electric, gas, and heat (utilities paid by tenants)
Neighborhood map
What this means for you Summary
Snapshot
- This is a 8-bed/3.0-bath multifamily listed at $360k.
Deal economics
- At list price, monthly cash flow is $471 ($6k/yr) — positive.
- The deal already cash-flows at list — no discount required.
- Meets the 1% rule at list price ($5k rent vs $360k).
- Cap rate 7.9% vs local median 4.5% in Maywood — top-decile yield for the area; either an underpriced asset or a hidden risk that comps aren't pricing in. Stress-test before assuming the spread holds.
Location & tenants
- Location reads 78/100 on livability (#146 in IL, #2,694 nationally) — a middle-class / working-renter tenant base. Strengths: commute A+, cost of living A+, housing A+; Watch: health & safety C-, crime D+, schools F.
- Maywood-Melrose Park-Broadview 89 (suburban): math 14% / reading 21% proficiency, ranked #738 of 919 in IL (top 80%) — low school quality limits family demand, transient renter base, plan for 1-2y turnover; 74% free/reduced lunch — lower-income household profile, screen leases tightly.
- Market conditions: 72 active listings in the ZIP; 6,272 units permitted in Cook County in 2024 (4,658 in 5+ unit buildings).
- At $4,721/mo this rent would consume 82% of the median local household income ($69k/yr) (locally 869% of renters already pay >50% of income on rent) — very limited rent-growth headroom before tenants either downsize or default.
Forward outlook
- Local home prices are declining (-3.0%/yr); year-one equity from $2k of loan paydown is wiped out by about $11k of value loss. Plan a longer hold.
Negotiation context
- Only 7 days on market — expect competitive offers; lowballing is unlikely to land.
- 8 sale attempts since 16y ago; this cycle's ask is 31% above the opening price — seller raised mid-cycle; expect resistance to lowballs.
- Current owner paid $274k; 31% above their basis — modest negotiation headroom, anchor on the comps not their cost.
Risks & watch-outs
- Watch-outs: property tax is 4.1% of price.
- Climate carrying-cost: moderate flood risk — expect insurance premiums to compound above CPI over the hold.
Questions for the listing agent
- Built in 1968 — when were the roof, HVAC, electrical panel, plumbing, and water heater last replaced?
- Property tax is high relative to price — has the assessment been appealed recently, and will the sale trigger a re-assessment?
- Is there a deadline driving the sale (1031 exchange, divorce, estate, relocation)? That informs how much negotiation room exists.
- Schools are F-rated, which usually means shorter tenancies and higher turnover. Who's the typical renter profile here, and what's been the actual vacancy rate?
- Crime grade is D in this area — have there been break-ins, vandalism, or insurance claims at this property in the last 3 years? What carrier currently insures it and at what premium?
- What's the average days-on-market for RENTAL listings here right now (not sales)? A rising rental-DOM trend means longer vacancies and softer asking-rent achievability than the comps imply.
- What's the recent tenant-quality profile in this submarket — average credit score on applications, eviction rate, late-payment / NSF rate, and stable-employment percentage? A property-management company in the area should have these aggregated.
- How much new apartment / multifamily construction is in the pipeline within 1–3 miles? Heavy new supply (>2% of stock underway) typically softens rents 12–24 months out; light construction supports rent growth.
Investment metrics
- 1% rule
- 1.31% ✓
- Cap rate
- 7.86%
- Cash-on-cash
- 5.61%
- DSCR
- 1.25
- GRM
- 6.4
CMA / ARV
No comps found within radius.
Projected returns pro-forma
-3.0% appreciation · 3.0% rent growth · sell at horizon
- IRR
- -7.5%
- Equity multiple
- 0.72×
- Total profit
- $-27,792
- Equity at exit
- $53,677
- IRR
- 2.3%
- Equity multiple
- 1.17×
- Total profit
- $16,642
- Equity at exit
- $31,126
Cash invested: $100,800 (down + closing). Projections, not guarantees.
Landlord ↔ Tenant lean methodology
- Overall (STATE)
- 43 Moderately Tenant-Leaning
- State Illinois
- 43 Moderately Tenant-Leaning · D+7
- County
- — inherits STATE
- City
- — inherits STATE
ZIP-level market 60153
- Home prices YoY
- -20.5%
- Active inventory
- 72
- Price-to-rent
- 19.8×
Monthly cashflow live
- Estimated rent
- $4,721 high interval (Pro) →
- Mortgage (P&I)
- −$1,888
- Tax from tax record
- −$1,221 /mo · $14,648/yr
- Insurance
- −$150
- HOA
- −$0
- Vacancy / Maint / Mgmt
- −$991
- Net cashflow
- $471
Break-even live
3-unit breakdown (identical units grouped — click to expand)
| Units | Beds | Baths | Est. rent |
|---|---|---|---|
| 2× units | 2 | 1 | $3,024 |
| #1 | 2 | 1 | $1,512 |
| #2 | 2 | 1 | $1,512 |
| 1× unit | 3 | 1 | $1,697 |
| Total (3 units) | $4,721 | ||
UW: 25.0% down · 7.5% · 30yr · 1.5% tax · 5.0% vac · 8.0% maint · 8.0% mgmt
Financing live
Cash to close
- Down payment
- $90,000
- Closing costs
- $10,800
- Reserves months
- —
- Total cash needed
- —
Loan-product check · same deal, 3 products live
Conventional
25% down · 7.5% · 30yr
- Down + closing
- —
- Monthly P&I
- —
- Monthly cashflow
- —
- DSCR
- —
- Eligible?
- —
Personal DTI + credit; lowest rate.
DSCR
20% down · 8.5% · 30yr
- Down + closing
- —
- Monthly P&I
- —
- Monthly cashflow
- —
- DSCR
- —
- Eligible?
- —
No personal income docs; deal must DSCR.
Hard money
10% down · 12.0% · 12mo
- Down + closing
- —
- Monthly P&I
- —
- Monthly cashflow
- —
- DSCR
- —
- Eligible?
- —
Short-term bridge; refi at stabilization.
Listing history 28 events
-
2026-06-04statusdays on market $360,000 Pending 7 DOM
-
2026-06-03days on market $360,000 Active 6 DOM
-
2026-06-02days on market $360,000 Active 5 DOM
-
2026-06-01days on market $360,000 Active 4 DOM
-
2026-05-31days on market $360,000 Active 3 DOM
-
2019-09-23soldstatus $274,000
-
2019-09-13soldstatus $273,900 Closed Sale 505-char remark
Show marketing remark (505 chars)
Great income producing property, perfect investment or primary residence. Updated all around with a newer roof, windows, plumbing, and doors. Newer electrical, plumbing and heating in all the units. All separate furnaces, water heaters. Neutral decor with refinished hardwood floors in the 2 - 3 BR apartments. Ceramic floors in the basement apt. Remodeled kitchen and baths. Ready for immediate possession. Great investment!Can be sold in a package with 1024 s 11th Ave which is identical as building.
-
2019-07-30historical Contingent 505-char remark
Show marketing remark (505 chars)
Great income producing property, perfect investment or primary residence. Updated all around with a newer roof, windows, plumbing, and doors. Newer electrical, plumbing and heating in all the units. All separate furnaces, water heaters. Neutral decor with refinished hardwood floors in the 2 - 3 BR apartments. Ceramic floors in the basement apt. Remodeled kitchen and baths. Ready for immediate possession. Great investment!Can be sold in a package with 1024 s 11th Ave which is identical as building.
-
2019-07-01$273,900 New 505-char remark
Show marketing remark (505 chars)
Great income producing property, perfect investment or primary residence. Updated all around with a newer roof, windows, plumbing, and doors. Newer electrical, plumbing and heating in all the units. All separate furnaces, water heaters. Neutral decor with refinished hardwood floors in the 2 - 3 BR apartments. Ceramic floors in the basement apt. Remodeled kitchen and baths. Ready for immediate possession. Great investment!Can be sold in a package with 1024 s 11th Ave which is identical as building.
-
2015-03-24soldstatus $168,000 Closed Sale 360-char remark
Show marketing remark (360 chars)
Newly rehabbed 3 unit building with new tear off roof, many new windows, all new doors. New electrical,new plumbing new heating in all the units. All separate furnaces,water heaters. Neutral decor with refinished hardwood floors in the 2 - 3 br apartments. Ceramic floots in the basement apt. Remodelled kitchen and baths. Ready for immediate poseession.
-
2015-03-20soldstatus $168,000
-
2015-01-02historical Contingent 360-char remark
Show marketing remark (360 chars)
Newly rehabbed 3 unit building with new tear off roof, many new windows, all new doors. New electrical,new plumbing new heating in all the units. All separate furnaces,water heaters. Neutral decor with refinished hardwood floors in the 2 - 3 br apartments. Ceramic floots in the basement apt. Remodelled kitchen and baths. Ready for immediate poseession.
-
2014-07-30$189,900 New 360-char remark
Show marketing remark (360 chars)
Newly rehabbed 3 unit building with new tear off roof, many new windows, all new doors. New electrical,new plumbing new heating in all the units. All separate furnaces,water heaters. Neutral decor with refinished hardwood floors in the 2 - 3 br apartments. Ceramic floots in the basement apt. Remodelled kitchen and baths. Ready for immediate poseession.
-
2013-02-01soldstatus $30,000 Closed Sale
-
2012-12-06status Pending
-
2012-11-12$20,000 New
-
2012-09-20historical
-
2012-09-19New
-
2012-09-18historical
-
2012-09-17status Reactivated
-
2012-09-14historical Contingent
-
2012-09-14status Reactivated
-
2012-09-13historical
-
2012-09-07price Price Change
-
2012-08-29New
-
2010-04-27historical
-
2010-03-22New
-
2001-04-12soldstatus $175,000
ⓘ Source: listings_history table (triggers on properties + properties_extension) + one-shot
backfill from property_details.listing_events for pre-trigger history.
Tax reassessment forecast IL · Partial reset (capped growth)
- Current annual tax
- $14,648 · $1,221/mo
- Projected year-2 tax
- $14,648 · $1,221/mo
- Expected delta
- $0/yr ($0/mo · 0.0%)
ⓘ Screening estimate from a state-policy table — verify with the county assessor before closing.
Climate risk First Street
- Flood 5/10 Major FEMA zone X (unshaded) · 47% chance over 30 yrs
- Wildfire 1/10 Low
- Heat 3/10 Moderate 7 d/yr ≥101°F today · 14 d/yr by 30 yrs out
- Wind 2/10 Low 100% chance of damaging wind over 30 yrs
- Air quality 4/10 Moderate 6 unhealthy d/yr today · 7 by 30 yrs out
Nearby sold comps map
Loading sold comps map…
Walkable amenities ~0.75 mi
Loading nearby amenities…
Taxation est. · year 1
- Rental income
- $56,652
- − Mortgage interest
- −$20,166
- − Property taxes
- −$14,648
- − Insurance
- −$1,800
- − Repairs & maintenance
- −$4,532
- − Management
- −$4,532
- − Depreciation
- −$10,473
- Taxable income
- $501
- Est. tax owed @ 24.0%
- −$120
- After-tax cash flow
- $5,532/yr
For passive investors: Depreciation is non-cash, so a rental often shows a tax loss while cash-flowing — sheltering income. Rental losses are passive: they offset passive income freely, and up to $25,000/yr can offset ordinary (W-2) income if you actively participate and your MAGI is under $100k (phasing out to $0 by $150k); unused losses carry forward. On sale, claimed depreciation is recaptured at up to 25%, and gains may owe capital-gains tax (a 1031 exchange can defer both). Figures are a year-1 estimate at your 24.0% rate — not tax advice; consult a CPA.
Schools (NCES district)
- District
- Maywood-Melrose Park-Broadview 89
- NCES district ID
- 1725110
- Math proficiency
- 14% ▲ 1.00%
- Reading proficiency
- 21% ▲ 4.00%
- Median HH income
- $45,567
- Composite
- 18.75/100
- National rank
- #14003
- State rank
- #738 of 919 in IL
Livability — Maywood
- Score
- 78/100
- State rank
- #146
- US rank
- #2694
Category grades
Schools grade is shown separately in the Schools card above.
Census & demographics
- Census place
- Maywood, IL
- County
- Cook County · 4,486,803 people
- City population
- 23,201
- Metro
- Chicago-Naperville-Elgin, IL-IN-WI
- Population (ZIP)
- 23,201
- Household income
- $68,815
- Rent vs Own
- Severe rent burden
- 869.0
Population outlook (Cook County) Hauer SSP2
- Today (2025)
- 5,347,519 people
- By 2030
- 5,357,703 · +0.2%
- By 2040
- 5,324,924 · -0.4%
- By 2050
- 5,230,762 · -2.2%
- By 2075
- 4,785,735 · -10.5%
- By 2100
- 4,188,836 · -21.7%
Race, ethnicity, and origin ACS 2023
- Neighborhood character
- Diverse neighborhood (Simpson 0.56)
- Race & ethnicity
- Black 57% Hispanic / Latino 33% Two or more races 11% White 6%
- Hispanic origin (detail)
- Mexican 28% Puerto Rican 3%
- Common ancestry
- Romanian 1% British 1%
- Foreign-born
- 14% · Canada, Jamaica
- Languages at home
- 68% English-only · Spanish 30% French/Haitian/Cajun 2%
Political lean MEDSL · Cook
- 2024 margin
- Solid D (+42.0) · D 70.4% · R 28.4% · Other 1.2%
- 2008→2024 swing
- -11.4pp toward R · 2008: 53.4pp · 2024: 42.0pp
- All cycles
- 2024: D+42.0 2020: D+50.3 2016: D+53.0 2012: D+49.4 2008: D+53.4
Not yet ingested
- Civics
- —
Market trends
- HPI YoY
- ▼ -86.90%
- Current HPI
- 336.2159
- Rent YoY
- —
- Metro
- Chicago-Naperville-Elgin, IL-IN-WI
- State GDP YoY
- ▲ 1.59%
- F500 in state
- 60
Industry mix (Fortune 500 HQ in IL)
| Industry | F500 HQs | Revenue |
|---|---|---|
| Insurance | 4 | $201B |
|
||
| Consumer Goods | 4 | $87B |
|
||
| Industrial Machinery | 3 | $64B |
|
||
| Healthcare | 2 | $55B |
|
||
| Retail / Pharmacy | 1 | $148B |
|
||
| Agriculture / Food | 1 | $86B |
|
||
Price history
+56.6% since first listed23 events — show timeline
- 2019-09-23 Sold (Public Records) $274,000 Public Records
- 2019-09-13 Sold (MLS) $273,900 MRED as Distributed by MLS Grid
- 2019-07-30 Contingent — MRED as Distributed by MLS Grid
- 2019-07-01 Listed $273,900 MRED as Distributed by MLS Grid
- 2015-03-24 Sold (MLS) $168,000 MRED as Distributed by MLS Grid
- 2015-03-20 Sold (Public Records) $168,000 Public Records
- 2015-01-02 Contingent — MRED as Distributed by MLS Grid
- 2014-07-30 Listed $189,900 MRED as Distributed by MLS Grid
- 2013-02-01 Sold (MLS) $30,000 MRED as Distributed by MLS Grid
- 2012-12-06 Pending — MRED as Distributed by MLS Grid
- 2012-11-12 Listed $20,000 MRED as Distributed by MLS Grid
- 2012-09-20 Listing Removed — MRED as Distributed by MLS Grid
- 2012-09-19 Listed — MRED as Distributed by MLS Grid
- 2012-09-18 Listing Removed — MRED as Distributed by MLS Grid
- 2012-09-17 Relisted — MRED as Distributed by MLS Grid
- 2012-09-14 Contingent — MRED as Distributed by MLS Grid
- 2012-09-14 Relisted — MRED as Distributed by MLS Grid
- 2012-09-13 Listing Removed — MRED as Distributed by MLS Grid
- 2012-09-07 Price Changed — MRED as Distributed by MLS Grid
- 2012-08-29 Listed — MRED as Distributed by MLS Grid
- 2010-04-27 Listing Removed — MRED as Distributed by MLS Grid
- 2010-03-22 Listed — MRED as Distributed by MLS Grid
- 2001-04-12 Sold (Public Records) $175,000 Public Records
Property tax history
+6.0%/yrLatest (2023): $14,648 · +2.4% YoY. Source: county tax records.
Cash-flow waterfall
monthlySold comps — $/sqft
last 12 mo · ≤1 miLoading sold comps…