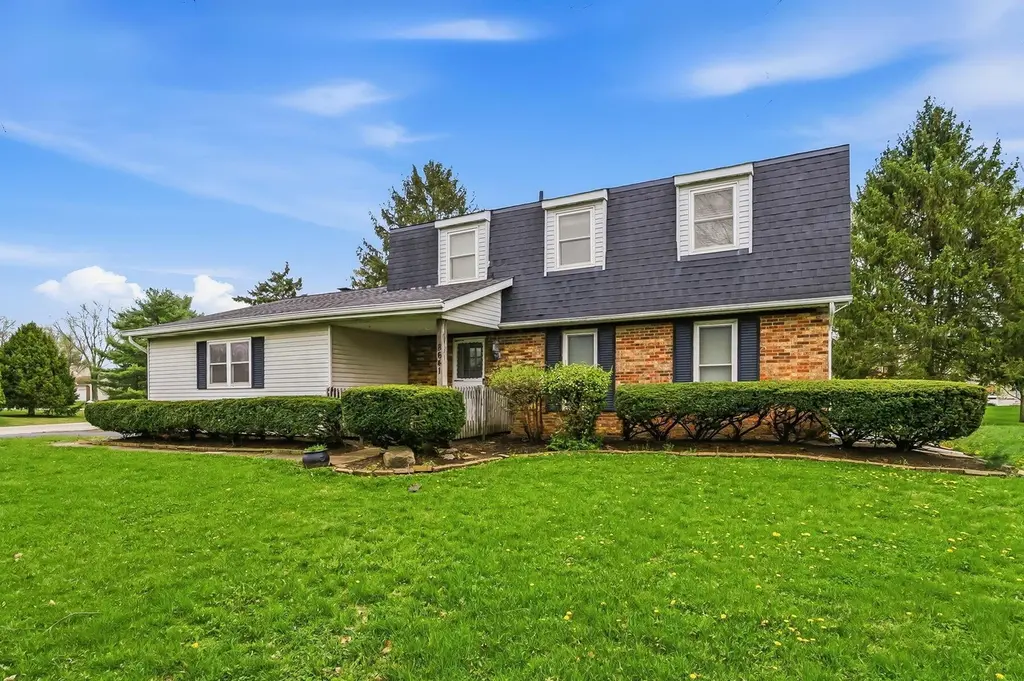
8641 Easton Dr · Pickerington, OH
Flood risk 1/10 · Minimal
- FEMA flood zone
- X (unshaded)
- Chance of flooding over 30 yrs
- 0.0%
- Est. flood insurance / yr
- $473 – $860
Fire risk 1/10 · Minimal
- Est. fire insurance / yr
- $713 – $1,323
Heat risk 3/10 · Minor
- Hot days now (above 99°F)
- 7 days/yr
- Hot days in 30 yrs
- 18 days/yr
Wind risk 2/10 · Minimal
- Chance of severe wind over 30 yrs
- 1.0%
Air-quality risk 2/10 · Minimal
- Unhealthy air days now
- 1 days/yr
- Unhealthy air days in 30 yrs
- 3 days/yr
Risk factors via First Street. Map © Google.
Why this score? — see what drove the B grade
The composite is a weighted blend of 9 inputs, each scored 0–100. Each bar is that input's sub-score; the figure is the points it added to the 100-point composite (weight × sub-score).
- Cash flow +30.0/30.0
- 1% rule +10.0/10.0
- DSCR +10.0/10.0
- ARV discount +7.5/15.0
- Schools +5.7/10.0
- Livability +3.9/5.0
- Rent growth +3.3/5.0
- Condition / age +2.5/5.0
- Appreciation +0.0/10.0
$195,000
🖨 Deal sheet 📄 Offer letter ✓ Due diligence
Listing remarks MLS
List price is minimum reserve for this online auction. See agent to agent remarks for instructions to register buyer and participate in online auction. Desirable Pickerington location in Easton Village. Lots of potential in this 4-bedroom, 2.5 bath 2 story on large corner lot. Full basement, lots of newer mechanicals but needs cosmetic updating. This one is ready for your creative ideas and finishes.
Key facts
- Large corner lot
- Full basement
- Newer mechanicals
Tags
Neighborhood map
What this means for you Summary
Snapshot
- This is a 4-bed/2.5-bath single-family listed at $195k.
Deal economics
- At list price, monthly cash flow is $906 ($11k/yr) — positive.
- The deal already cash-flows at list — no discount required.
- Meets the 1% rule at list price ($3k rent vs $195k).
- Recommended offer: $192k (1.5% below list) — sets the bar for market timing.
- Cap rate 11.9% vs local median 3.3% in Pickerington — top-decile yield for the area; either an underpriced asset or a hidden risk that comps aren't pricing in. Stress-test before assuming the spread holds.
Location & tenants
- Location reads 77/100 on livability (#197 in OH, #3,031 nationally) — a middle-class / working-renter tenant base. Strengths: schools A+, employment A+, housing A+; Watch: amenities F, commute F.
- Pickerington Local (suburban): math 58% / reading 69% proficiency, ranked #186 of 656 in OH (top 28%) — acceptable for families but not a draw, mixed tenant base, ~2y average lease; only 19% free/reduced lunch — higher-income household profile.
- Market conditions: Rents rising (+3.0%/yr); 223 active listings in the ZIP; 7 comparable units currently listed for rent nearby; rentals at typical pace (median 20d on market — plan ~3-4 weeks tenant-placement turnaround); 43% of comp listings sitting > 30 days — soft ceiling on asking rent; high-income renter base; 475 units permitted in Fairfield County in 2024 (0 in 5+ unit buildings).
Forward outlook
- Local home prices are declining (-3.0%/yr); year-one equity from $1k of loan paydown is wiped out by about $6k of value loss. Plan a longer hold.
- Fairfield County population projected at +8% by 2050 — modest demand growth; plan on rents tracking national, not racing it.
- At projected returns (-3.0% appreciation + 3.0% rent growth), your $55k cash investment doubles in ~7 years — after that, you're playing with house money.
Negotiation context
- It's been on market 28 days — a 2% lower offer ($192k) is reasonable based on typical stale-listing flexibility.
Questions for the listing agent
- Built in 1977 — when were the roof, HVAC, electrical panel, plumbing, and water heater last replaced?
- What does the HOA fee cover, when was the last increase, and are there any pending special assessments or reserve-fund shortfalls?
- Is there a deadline driving the sale (1031 exchange, divorce, estate, relocation)? That informs how much negotiation room exists.
- Schools are A-rated — typically a magnet for longer-tenancy family renters. What's the average tenant stay here, and is there a school-zone premium baked into asking?
- What's the average days-on-market for RENTAL listings here right now (not sales)? A rising rental-DOM trend means longer vacancies and softer asking-rent achievability than the comps imply.
- What's the recent tenant-quality profile in this submarket — average credit score on applications, eviction rate, late-payment / NSF rate, and stable-employment percentage? A property-management company in the area should have these aggregated.
- How much new for-sale + rental construction is in the pipeline within 1–3 miles? Heavy new supply typically softens prices + rents 12–24 months out; constrained supply supports both.
Investment metrics
- 1% rule
- 1.51% ✓
- Cap rate
- 11.87%
- Cash-on-cash
- 19.91%
- DSCR
- 1.89
- GRM
- 5.5
CMA / ARV
- ARV (median comp)
- $402,999
- List price
- $195,000
- Delta
- -51.61%
- Verdict
- UNDERPRICED
- Comps
- 20 within 1.0 mi
Show comp detail 12 sales within ~0.75 mi
| Address | Dist | Beds/Ba | Sqft | Sold | Price | $/sf | Match |
|---|---|---|---|---|---|---|---|
| 8641 Easton Dr | 0.00mi | 4/2.5 | 1,886 (0%) | 1mo | $295,900 | $157 | 100 |
| 11474 NW Chanticleer Ter NW | 0.30mi | 4/3.5 | 1,870 (-1%) | 4mo | $400,000 | $214 | 77 |
| 8732 Eastfield Ct | 0.10mi | 4/2.5 | 2,010 (+7%) | 11mo | $397,000 | $198 | 75 |
| 11658 Eastmeadow Ct | 0.08mi | 4/2.5 | 2,008 (+6%) | 14mo | $358,000 | $178 | 74 |
| 8741 Ramblewood Ct | 0.24mi | 4/2.5 | 1,794 (-5%) | 12mo | $430,500 | $240 | 71 |
| 11722 Streamside Dr | 0.16mi | 4/2.5 | 2,142 (+14%) | 8mo | $400,000 | $187 | 63 |
| 11760 Chanticleer Dr NW | 0.29mi | 4/2.5 | 2,124 (+13%) | 5mo | $357,000 | $168 | 61 |
| 11760 Bridgewater Dr | 0.41mi | 3/2.0 (-1) | 1,893 (+0%) | 15mo | $400,000 | $211 | 61 |
| 11841 Milnor Rd NW | 0.27mi | 4/2.5 | 2,154 (+14%) | 9mo | $360,000 | $167 | 57 |
| 471 N Center St | 0.75mi | 3/2.0 (-1) | 1,900 (+1%) | 8mo | $399,990 | $211 | 50 |
| 982 Paisley Pl | 0.66mi | 3/2.5 (-1) | 2,054 (+9%) | 14mo | $405,000 | $197 | 38 |
| 832 Mcleod Parc | 0.71mi | 4/2.5 | 2,155 (+14%) | 12mo | $435,000 | $202 | 33 |
Match score weights: distance 35% · size 25% · config 20% · recency 20%. Top-matched comps best support the ARV.
Projected returns pro-forma
-3.0% appreciation · 3.01% rent growth · sell at horizon
- IRR
- 12.1%
- Equity multiple
- 1.48×
- Total profit
- $26,216
- Equity at exit
- $29,075
- IRR
- 21.1%
- Equity multiple
- 2.79×
- Total profit
- $97,612
- Equity at exit
- $16,860
Cash invested: $54,600 (down + closing). Projections, not guarantees.
Landlord ↔ Tenant lean methodology
- Overall (STATE)
- 73 Landlord-Friendly
- State Ohio
- 73 Landlord-Friendly · R+6
- County
- — inherits STATE
- City
- — inherits STATE
ZIP-level market 43147
- Rents YoY
- 3.0%
- Active inventory
- 223
- Price-to-rent
- 5.5×
Monthly cashflow live
- Estimated rent
- $2,950 high interval (Pro) →
- Mortgage (P&I)
- −$1,023
- Tax from tax record
- −$316 /mo · $3,786/yr
- Insurance
- −$81
- HOA
- −$5
- Vacancy / Maint / Mgmt
- −$619
- Net cashflow
- $906
Break-even live
UW: 25.0% down · 7.5% · 30yr · 1.5% tax · 5.0% vac · 8.0% maint · 8.0% mgmt
Financing live
Cash to close
- Down payment
- $48,750
- Closing costs
- $5,850
- Reserves months
- —
- Total cash needed
- —
Loan-product check · same deal, 3 products live
Conventional
25% down · 7.5% · 30yr
- Down + closing
- —
- Monthly P&I
- —
- Monthly cashflow
- —
- DSCR
- —
- Eligible?
- —
Personal DTI + credit; lowest rate.
DSCR
20% down · 8.5% · 30yr
- Down + closing
- —
- Monthly P&I
- —
- Monthly cashflow
- —
- DSCR
- —
- Eligible?
- —
No personal income docs; deal must DSCR.
Hard money
10% down · 12.0% · 12mo
- Down + closing
- —
- Monthly P&I
- —
- Monthly cashflow
- —
- DSCR
- —
- Eligible?
- —
Short-term bridge; refi at stabilization.
Rent comps 7 comps
| Address | Beds | Baths | Sqft | Rent | $/sqft | DOM | Units | Dist |
|---|---|---|---|---|---|---|---|---|
| 11715 Village Way Dr Pickerington, OH | 4.0 | 3.0 | 2340 | $3,000 | $1.28 | 43d | 1 | 0.11mi |
| 8286 Kingfisher Ln Pickerington, OH | 3.0 | 3.0 | 1447 | $2,700 | $1.87 | 20d | 1 | 0.50mi |
| 522 Warwick Ln Pickerington, OH | 3.0 | 2.5 | 1520 | $2,400 | $1.58 | 43d | 1 | 1.07mi |
| 12143 Twincreek Dr Pickerington, OH | 3.0 | 2.5 | 2074 | $2,570 | $1.24 | 43d | 1 | 1.09mi |
| 12111 Peppermill Ln Pickerington, OH | 4.0 | 2.5 | 2068 | $2,771 | $1.34 | 4d | 1 | 1.25mi |
| 145 Timber Ridge Dr Pickerington, OH | 4.0 | 2.5 | 1798 | $2,520 | $1.40 | 7d | 1 | 1.32mi |
| 12896 Pacer Dr Pickerington, OH | 3.0 | 2.0 | 2066 | $3,081 | $1.49 | 7d | 1 | 1.38mi |
HOA detail
- Monthly dues
- $5 · $60/yr
Listing history 2 events
-
2026-05-06status Pending 403-char remark
Show marketing remark (403 chars)
List price is minimum reserve for this online auction. See agent to agent remarks for instructions to register buyer and participate in online auction. Desirable Pickerington location in Easton Village. Lots of potential in this 4-bedroom, 2.5 bath 2 story on large corner lot. Full basement, lots of newer mechanicals but needs cosmetic updating. This one is ready for your creative ideas and finishes.
-
2026-04-07$195,000 Active 403-char remark
Show marketing remark (403 chars)
List price is minimum reserve for this online auction. See agent to agent remarks for instructions to register buyer and participate in online auction. Desirable Pickerington location in Easton Village. Lots of potential in this 4-bedroom, 2.5 bath 2 story on large corner lot. Full basement, lots of newer mechanicals but needs cosmetic updating. This one is ready for your creative ideas and finishes.
ⓘ Source: listings_history table (triggers on properties + properties_extension) + one-shot
backfill from property_details.listing_events for pre-trigger history.
Tax reassessment forecast OH · Partial reset (capped growth)
- Current annual tax
- $3,786 · $316/mo
- Projected year-2 tax
- $3,786 · $316/mo
- Expected delta
- $0/yr ($0/mo · 0.0%)
ⓘ Screening estimate from a state-policy table — verify with the county assessor before closing.
Climate risk First Street
- Flood 1/10 Low FEMA zone X (unshaded) · 0% chance over 30 yrs
- Wildfire 1/10 Low
- Heat 3/10 Moderate 7 d/yr ≥99°F today · 18 d/yr by 30 yrs out
- Wind 2/10 Low 100% chance of damaging wind over 30 yrs
- Air quality 2/10 Low 1 unhealthy d/yr today · 3 by 30 yrs out
Nearby sold comps map
Loading sold comps map…
Walkable amenities ~0.75 mi
Loading nearby amenities…
Taxation est. · year 1
- Rental income
- $35,395
- − Mortgage interest
- −$10,923
- − Property taxes
- −$3,786
- − Insurance
- −$975
- − Repairs & maintenance
- −$2,832
- − Management
- −$2,832
- − HOA
- −$60
- − Depreciation
- −$5,673
- Taxable income
- $8,315
- Est. tax owed @ 24.0%
- −$1,996
- After-tax cash flow
- $8,874/yr
For passive investors: Depreciation is non-cash, so a rental often shows a tax loss while cash-flowing — sheltering income. Rental losses are passive: they offset passive income freely, and up to $25,000/yr can offset ordinary (W-2) income if you actively participate and your MAGI is under $100k (phasing out to $0 by $150k); unused losses carry forward. On sale, claimed depreciation is recaptured at up to 25%, and gains may owe capital-gains tax (a 1031 exchange can defer both). Figures are a year-1 estimate at your 24.0% rate — not tax advice; consult a CPA.
Schools (NCES district)
- District
- Pickerington Local
- NCES district ID
- 3904689
- Math proficiency
- 58% ▼ -18.00%
- Reading proficiency
- 69% ▼ -8.00%
- Median HH income
- $81,735
- Composite
- 56.97/100
- National rank
- #1112
- State rank
- #186 of 656 in OH
Livability — Pickerington
- Score
- 77/100
- State rank
- #197
- US rank
- #3031
Category grades
Schools grade is shown separately in the Schools card above.
Census & demographics
- County
- Fairfield County · 109,896 people
- City population
- 46,963
- Metro
- Columbus, OH
- Population (ZIP)
- 46,963
- Household income
- $126,534
- Rent vs Own
- Severe rent burden
- 375.0
Population outlook (Fairfield County) Hauer SSP2
- Today (2025)
- 162,442 people
- By 2030
- 166,796 · +2.7%
- By 2040
- 172,835 · +6.4%
- By 2050
- 174,822 · +7.6%
- By 2075
- 174,938 · +7.7%
- By 2100
- 160,988 · -0.9%
Race, ethnicity, and origin ACS 2023
- Neighborhood character
- Predominantly White (67%)
- Race & ethnicity
- White 67% Black 20% Two or more races 6% Asian 4% Hispanic / Latino 3%
- Common ancestry
- Romanian 2% Slovak 2% Lithuanian 2%
- Foreign-born
- 6% · Canada, India, Vietnam
- Languages at home
- 93% English-only · Other Indo-European 2% Spanish 1% Russian/Polish/Slavic 1%
Political lean MEDSL · Fairfield
- 2024 margin
- Strong R (+24.1) · D 37.5% · R 61.6%
- 2008→2024 swing
- -6.9pp toward R · 2008: -17.1pp · 2024: -24.1pp
- All cycles
- 2024: R+24.1 2020: R+23.5 2016: R+27.0 2012: R+16.1 2008: R+17.1
Not yet ingested
- Civics
- —
Market trends
- HPI YoY
- ▼ -221.01%
- Current HPI
- 232.8039
- Rent YoY
- ▲ 3.01%
- Metro
- Columbus, OH
- State GDP YoY
- ▲ 1.98%
- F500 in state
- 48
Industry mix (Fortune 500 HQ in OH)
| Industry | F500 HQs | Revenue |
|---|---|---|
| Insurance | 3 | $145B |
|
||
| Industrial Machinery | 3 | $49B |
|
||
| Financial Services | 3 | $24B |
|
||
| Consumer Goods | 2 | $93B |
|
||
| Aerospace / Defense | 2 | $47B |
|
||
| Utilities | 2 | $33B |
|
||
Price history
2 events — show timeline
- 2026-05-06 Pending — CBRMLS
- 2026-04-07 Listed $195,000 CBRMLS
Property tax history
+4.3%/yrLatest (2025): $3,786 · +9.1% YoY. Source: county tax records.
Cash-flow waterfall
monthlySold comps — $/sqft
last 12 mo · ≤1 miLoading sold comps…