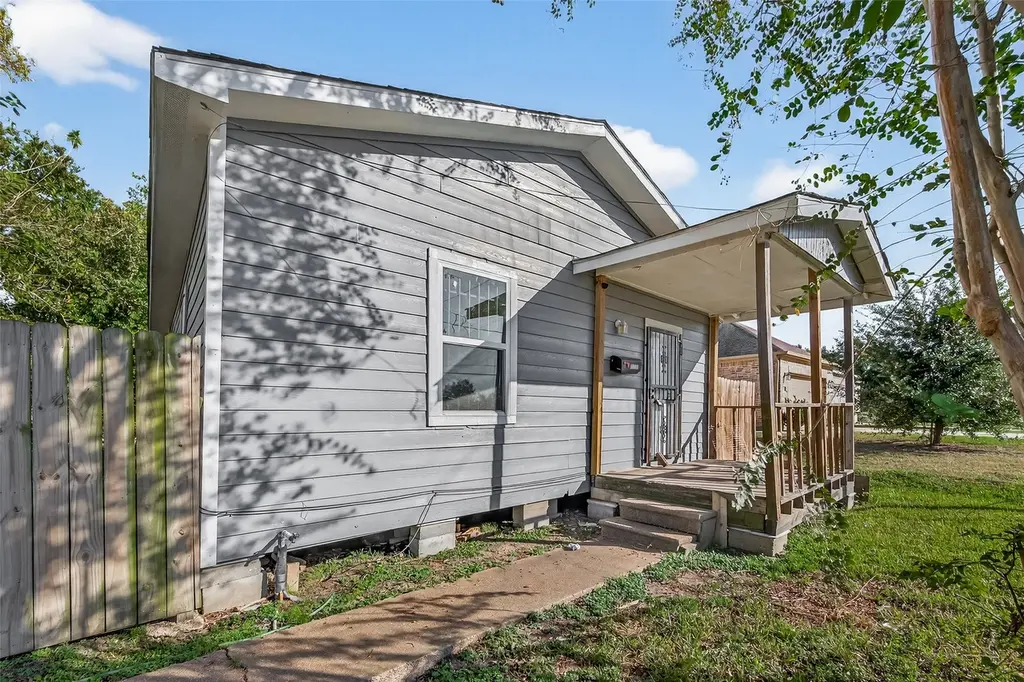
8211 Parnell St · Houston, TX
Flood risk 6/10 · Moderate
- FEMA flood zone
- X (unshaded)
- Chance of flooding over 30 yrs
- 0.73%
- Est. flood insurance / yr
- $507 – $1,088
Fire risk 2/10 · Minimal
- Est. fire insurance / yr
- $1,222 – $2,270
Heat risk 9/10 · Severe
- Hot days now (above 109°F)
- 7 days/yr
- Hot days in 30 yrs
- 22 days/yr
Wind risk 9/10 · Severe
- Chance of severe wind over 30 yrs
- 99.0%
Air-quality risk 2/10 · Minimal
- Unhealthy air days now
- 2 days/yr
- Unhealthy air days in 30 yrs
- 2 days/yr
Risk factors via First Street. Map © Google.
Why this score? — see what drove the D+ grade
The composite is a weighted blend of 9 inputs, each scored 0–100. Each bar is that input's sub-score; the figure is the points it added to the 100-point composite (weight × sub-score).
- Cash flow +12.2/30.0
- Appreciation +10.0/10.0
- ARV discount +5.1/15.0
- 1% rule +4.2/10.0
- Rent growth +3.7/5.0
- Livability +3.7/5.0
- DSCR +3.6/10.0
- Schools +2.7/10.0
- Condition / age +2.5/5.0
$169,000
🖨 Deal sheet 📄 Offer letter ✓ Due diligence
Listing remarks
The home is tenant occupied and perfect for an investor looking for tenant-occupied properties. This well-maintained home offers 3 spacious bedrooms and 2 full bathrooms, featuring central air and heating for year-round comfort. The kitchen is equipped with granite countertops, and the home is vacant and move-in ready, providing a smooth transition for its next owner. Ideally located with easy access to Highway 288, Loop 610, and Beltway 8, the property allows for a convenient commute to the Texas Medical Center, Downtown Houston, and surrounding employment hubs. Positioned in an area experiencing continued revitalization and growth, this home presents a great opportunity for both homeowner
Key facts
- Granite countertops
- Central air
- 5,510 sq ft lot
Tags
Property features AI
Finance
- Financial info: Leasing considered
Exterior
- Utilities: Public water; Public sewer
- Home design: Residential property; Built in 1950; Pillar/post/pier foundation; Composition roof
- Construction: Unknown construction materials
- Exterior features: Located in a subdivision
Interior
- Bathrooms: 2 full bathrooms
- Heating & cooling: Central heating (electric and gas); Central cooling (electric and gas)
- Interior features: Total of 3 rooms
Neighborhood map
What this means for you Summary
Snapshot
- This is a 2-bed/1.0-bath single-family listed at $169k.
Deal economics
- At list price, monthly cash flow is $-34 ($-414/yr) — negative.
- To cash-flow at today's rent, offer at most $163k (3.6% below list).
- To meet the 1% rule (rent ≥ 1% of price), the offer needs to be $155k (8.5% below list).
- Recommended offer: $155k (8.5% below list) — sets the bar for 1% rule.
- Cap rate 6.0% vs local median 3.2% in Houston — top-decile yield for the area; either an underpriced asset or a hidden risk that comps aren't pricing in. Stress-test before assuming the spread holds.
Location & tenants
- Location reads 74/100 on livability (#184 in TX, #4,771 nationally) — a middle-class / working-renter tenant base. Strengths: amenities A+, cost of living A+, housing A+; Watch: crime F.
- Houston ISD (urban): math 27% / reading 35% proficiency, ranked #593 of 826 in TX (top 72%) — families likely to look elsewhere, expect single-tenant / working-renter base with shorter leases; 71% free/reduced lunch — lower-income household profile, screen leases tightly.
- Zoned schools: Attucks Middle (math 15% / reading 22%, grade F, #1,478 of 1,662 statewide, top 90%, 439 students, 98% FRL); Worthing H S (math 22% / reading 21%, grade F, #1,377 of 1,632 statewide, top 85%, 827 students, 96% FRL) — zoned schools average 97% FRL vs 71% district-wide (26 pts higher); higher-poverty schools than district average — tighter screening recommended.
- Market conditions: Rents rising fast (+4.8%/yr); 312 active listings in the ZIP; 40 comparable units currently listed for rent nearby; rentals leasing fast (median 11d on market — plan ~1-2 weeks tenant-placement turnaround); lower-income renter base — watch delinquency; 29,883 units permitted in Harris County in 2024 (8,621 in 5+ unit buildings).
Forward outlook
- In year one you build about $18k of equity ($1k loan paydown + $17k appreciation (10.0% local appreciation)).
- Harris County population projected at +47% by 2050 — long-run rental-demand tailwind backs the buy-and-hold thesis.
- At projected returns (10.0% appreciation + 4.8% rent growth), your $47k cash investment doubles in ~3 years — after that, you're playing with house money.
- By year 3, paydown + projected appreciation supports a ~$46k cash-out refi (75% LTV) — recoverable capital for the next deal without selling this one.
Negotiation context
- It's been on market 40 days — a 3% lower offer ($164k) is reasonable based on typical stale-listing flexibility.
- 14 sale attempts since 7y ago with the ask held roughly flat each time — persistent listings suggest the price (not the market) is what's stuck; bring a comps-based counter.
Risks & watch-outs
- Watch-outs: built in 1950 — expect roof / HVAC / electrical / plumbing capex.
- Climate carrying-cost: major flood risk; severe wind risk, 99% chance of damaging wind over 30y; extreme-heat days projected 7→22/yr by 2055 (HVAC capex compounding) — expect insurance premiums to compound above CPI over the hold.
Questions for the listing agent
- What do current leases actually rent for vs. the listed asking? Can we see a recent rent roll and the last 12 months of T-12 income?
- It's been on market 40 days. Have you received any prior offers? Is the seller open to a 8% concession, seller financing, or rate buy-down credit?
- Built in 1950 — when were the roof, HVAC, electrical panel, plumbing, and water heater last replaced?
- Is there a deadline driving the sale (1031 exchange, divorce, estate, relocation)? That informs how much negotiation room exists.
- Schools are D-rated, which usually means shorter tenancies and higher turnover. Who's the typical renter profile here, and what's been the actual vacancy rate?
- Crime grade is F in this area — have there been break-ins, vandalism, or insurance claims at this property in the last 3 years? What carrier currently insures it and at what premium?
- The area grade is low — what's the realistic commute time and amenity access for the typical tenant pool here? Any planned neighborhood developments (good or bad) we should know about?
- What's the average days-on-market for RENTAL listings here right now (not sales)? A rising rental-DOM trend means longer vacancies and softer asking-rent achievability than the comps imply.
- What's the recent tenant-quality profile in this submarket — average credit score on applications, eviction rate, late-payment / NSF rate, and stable-employment percentage? A property-management company in the area should have these aggregated.
- How much new for-sale + rental construction is in the pipeline within 1–3 miles? Heavy new supply typically softens prices + rents 12–24 months out; constrained supply supports both.
Investment metrics
- 1% rule
- 0.92% ✗
- Cap rate
- 6.05%
- Cash-on-cash
- -0.87%
- DSCR
- 0.96
- GRM
- 9.1
CMA / ARV
- ARV (median comp)
- $160,366
- List price
- $169,000
- Delta
- 5.38%
- Verdict
- FAIR
- Comps
- 20 within 1.0 mi
Show comp detail 12 sales within ~0.75 mi
| Address | Dist | Beds/Ba | Sqft | Sold | Price | $/sf | Match |
|---|---|---|---|---|---|---|---|
| 8015 Cannon St | 0.20mi | 2/1.0 | 1,114 (-0%) | 11mo | $175,000 | $157 | 81 |
| 8022 Corinth St | 0.27mi | 3/1.0 (+1) | 1,112 (-1%) | 15mo | $89,000 | $80 | 68 |
| 8412 Fountain St | 0.18mi | 3/1.0 (+1) | 1,048 (-6%) | 12mo | $200,000 | $191 | 66 |
| 8122 Corinth St Unit B | 0.23mi | 3/2.0 (+1) | 1,094 (-2%) | 12mo | $286,000 | $261 | 66 |
| 8137 Canyon St | 0.16mi | 2/1.0 | 957 (-15%) | 3mo | $110,000 | $115 | 66 |
| 8019 Lawler St | 0.22mi | 2/1.0 | 1,008 (-10%) | 14mo | $98,000 | $97 | 62 |
| 3902 Aledo St | 0.58mi | 3/1.0 (+1) | 1,176 (+5%) | 4mo | $90,000 | $77 | 56 |
| 8030 Lawler St | 0.19mi | 3/1.0 (+1) | 952 (-15%) | 10mo | $139,900 | $147 | 53 |
| 7811 Lawler St | 0.36mi | 2/1.0 | 992 (-11%) | 15mo | $75,000 | $76 | 51 |
| 8416 Livingston St | 0.24mi | 3/2.0 (+1) | 1,247 (+11%) | 15mo | $210,000 | $168 | 48 |
| 7634 Lady St | 0.70mi | 3/1.0 (+1) | 1,270 (+13%) | 12mo | $120,000 | $94 | 30 |
| 3454 Bacon St | 0.73mi | 3/2.0 (+1) | 1,278 (+14%) | 11mo | $255,000 | $200 | 24 |
Match score weights: distance 35% · size 25% · config 20% · recency 20%. Top-matched comps best support the ARV.
Projected returns pro-forma
10.0% appreciation · 4.77% rent growth · sell at horizon
- IRR
- 24.3%
- Equity multiple
- 2.96×
- Total profit
- $92,727
- Equity at exit
- $152,249
- IRR
- 22.0%
- Equity multiple
- 6.94×
- Total profit
- $281,057
- Equity at exit
- $328,330
Cash invested: $47,320 (down + closing). Projections, not guarantees.
Landlord ↔ Tenant lean methodology
- Overall (STATE)
- 87 Strongly Landlord-Friendly
- State Texas
- 87 Strongly Landlord-Friendly · R+5
- County
- — inherits STATE
- City
- — inherits STATE
ZIP-level market 77051
- Home prices YoY
- 9.7%
- Rents YoY
- 4.8%
- Active inventory
- 312
- Price-to-rent
- 9.1×
Monthly cashflow live
- Estimated rent
- $1,546 high interval (Pro) →
- Mortgage (P&I)
- −$886
- Tax from tax record
- −$299 /mo · $3,593/yr
- Insurance
- −$70
- HOA
- −$0
- Vacancy / Maint / Mgmt
- −$325
- Net cashflow
- $-34
Break-even live
UW: 25.0% down · 7.5% · 30yr · 1.5% tax · 5.0% vac · 8.0% maint · 8.0% mgmt
Financing live
Cash to close
- Down payment
- $42,250
- Closing costs
- $5,070
- Reserves months
- —
- Total cash needed
- —
Loan-product check · same deal, 3 products live
Conventional
25% down · 7.5% · 30yr
- Down + closing
- —
- Monthly P&I
- —
- Monthly cashflow
- —
- DSCR
- —
- Eligible?
- —
Personal DTI + credit; lowest rate.
DSCR
20% down · 8.5% · 30yr
- Down + closing
- —
- Monthly P&I
- —
- Monthly cashflow
- —
- DSCR
- —
- Eligible?
- —
No personal income docs; deal must DSCR.
Hard money
10% down · 12.0% · 12mo
- Down + closing
- —
- Monthly P&I
- —
- Monthly cashflow
- —
- DSCR
- —
- Eligible?
- —
Short-term bridge; refi at stabilization.
Rent comps 40 comps
| Address | Beds | Baths | Sqft | Rent | $/sqft | DOM | Units | Dist |
|---|---|---|---|---|---|---|---|---|
| 8328 Corinth St Unit B Houston, TX | 3.0 | 2.5 | 1500 | $2,800 | $1.87 | 20d | 1 | 0.23mi |
| 8010 Livingston St Houston, TX | 3.0 | 2.0 | 1400 | $1,800 | $1.29 | 43d | 1 | 0.27mi |
| 3137 W Bellfort Ave Houston, TX | 2.0 | 2.0 | 1164 | $1,802 | $1.55 | 43d | 1 | 0.49mi |
| 7823 Gladstone St Houston, TX | 2.0 | 2.0 | 850 | $1,600 | $1.88 | 43d | 1 | 0.56mi |
| 7812 Tierwester St Houston, TX | 2.0 | 1.0 | 800 | $950 | $1.19 | 16d | 2 | 0.69mi |
| 1600 Jester St Houston, TX | 1.0–2.0 | 1.0 | 707 | $1,395 | $1.97 | 2d | 4 | 0.76mi |
| 4410 Bellfort Ave Unit 4404 8 Houston, TX | 2.0 | 1.0 | 812 | $999 | $1.23 | 7d | 1 | 0.84mi |
| 2889 Reed Rd Houston, TX | 1.0–2.0 | 1.0–2.0 | 997 | $1,648 | $1.65 | 3d | 2 | 0.88mi |
| 8181 El Mundo St Houston, TX | 1.0–3.0 | 1.0–2.0 | 1241 | $1,772 | $1.43 | 24d | 18 | 0.91mi |
| 8181 El Mundo St Houston, TX | 1.0–3.0 | 1.0–2.5 | 1356 | $1,636 | $1.21 | 1d | 47 | 0.91mi |
| 8383 El Mundo St Houston, TX | 1.0 | 1.0 | 737 | $1,292 | $1.75 | 14d | 1 | 0.92mi |
| 8389 El Mundo St Houston, TX | 1.0 | 1.0 | 763 | $1,240 | $1.63 | 43d | 1 | 0.98mi |
| 8383 El Mundo St Unit 2174 Houston, TX | 2.0 | 2.0 | 1104 | $1,553 | $1.41 | 10d | 1 | 0.99mi |
| 8383 El Mundo St Unit 422 Houston, TX | 2.0 | 2.0 | 1104 | $1,529 | $1.38 | 7d | 1 | 0.99mi |
| 8383 El Mundo St Unit 8457 Houston, TX | 1.0 | 1.0 | 737 | $1,187 | $1.61 | 10d | 1 | 0.99mi |
| 8383 El Mundo St Unit 1148 Houston, TX | 1.0 | 1.0 | 737 | $1,145 | $1.55 | 3d | 1 | 0.99mi |
| 8383 El Mundo St Unit 2165 Houston, TX | 2.0 | 2.0 | 1104 | $1,521 | $1.38 | 3d | 1 | 0.99mi |
| 8383 El Mundo St Apt 321 Houston, TX | 1.0 | 1.0 | 737 | $1,148 | $1.56 | 7d | 1 | 0.99mi |
| 8383 El Mundo St Unit 8440 Houston, TX | 2.0 | 2.0 | 1104 | $1,558 | $1.41 | 43d | 1 | 0.99mi |
| 8383 El Mundo St Unit 1174 Houston, TX | 1.0 | 1.0 | 737 | $1,188 | $1.61 | 10d | 1 | 0.99mi |
| 8383 El Mundo St Unit 8404 Houston, TX | 1.0 | 1.0 | 737 | $1,297 | $1.76 | 14d | 1 | 0.99mi |
| 2725 Reed Rd Houston, TX | 1.0–3.0 | 1.0–2.5 | 911 | $862 | $0.95 | 43d | 1 | 1.01mi |
| 8306 El Mundo St Houston, TX | 1.0 | 1.0 | 770 | $1,297 | $1.68 | 43d | 1 | 1.03mi |
| 4326 Larkspur St Unit 3 Houston, TX | 2.0 | 1.0 | 800 | $1,200 | $1.50 | 16d | 1 | 1.03mi |
| 8521 Dosia St Houston, TX | 3.0 | 2.0 | 1028 | $1,665 | $1.62 | 12d | 1 | 1.04mi |
| 8380 El Mundo St Houston, TX | 1.0–2.0 | 1.0–2.0 | 712 | $1,263 | $1.77 | 1d | 28 | 1.04mi |
| 8300 El Mundo St Houston, TX | 1.0 | 1.0 | 770 | $948 | $1.23 | 12d | 1 | 1.05mi |
| 8300 El Mundo St Unit 8357 Houston, TX | 2.0 | 2.0 | 970 | $1,289 | $1.33 | 10d | 1 | 1.06mi |
| 8300 El Mundo St Unit 1112 Houston, TX | 1.0 | 1.0 | 770 | $956 | $1.24 | 3d | 1 | 1.06mi |
| 8300 El Mundo St Unit 2174 Houston, TX | 2.0 | 2.0 | 970 | $1,300 | $1.34 | 10d | 1 | 1.06mi |
| 8300 El Mundo St Apt 324 Houston, TX | 1.0 | 1.0 | 770 | $959 | $1.25 | 7d | 1 | 1.06mi |
| 8300 El Mundo St Unit 8321 Houston, TX | 1.0 | 1.0 | 770 | $994 | $1.29 | 14d | 1 | 1.06mi |
| 8300 El Mundo St Unit 424 Houston, TX | 2.0 | 2.0 | 970 | $1,265 | $1.30 | 5d | 1 | 1.06mi |
| 8300 El Mundo St Unit 1162 Houston, TX | 1.0 | 1.0 | 770 | $959 | $1.25 | 5d | 1 | 1.06mi |
| 8300 El Mundo St Unit 8321 Houston, TX | 1.0 | 1.0 | 770 | $998 | $1.30 | 10d | 1 | 1.06mi |
| 8300 El Mundo St Unit 8351 Houston, TX | 1.0 | 1.0 | 770 | $994 | $1.29 | 44d | 1 | 1.06mi |
| 8300 El Mundo St Unit 422 Houston, TX | 2.0 | 2.0 | 970 | $1,265 | $1.30 | 7d | 1 | 1.06mi |
| 8300 El Mundo St Unit 2112 Houston, TX | 2.0 | 2.0 | 970 | $1,257 | $1.30 | 3d | 1 | 1.06mi |
| 4205 Phlox St Unit 2 BEDROOM 6 Houston, TX | 2.0 | 1.0 | 736 | $860 | $1.17 | 18d | 1 | 1.06mi |
| 2750 Holly Hall St Houston, TX | 1.0–2.0 | 1.0–2.0 | 704 | $2,000 | $2.84 | 2d | 12 | 1.07mi |
Listing history 45 events
-
2026-06-18days on market $169,000 Active 40 DOM
-
2026-06-17days on market $169,000 Active 39 DOM
-
2026-06-16days on market $169,000 Active 38 DOM
-
2026-06-15days on market $169,000 Active 37 DOM
-
2026-06-13days on market $169,000 Active 35 DOM
-
2026-06-10days on market $169,000 Active 31 DOM
-
2026-06-08days on market $169,000 Active 30 DOM
-
2026-06-07days on market $169,000 Active 29 DOM
-
2026-06-04days on market $169,000 Active 26 DOM
-
2026-06-01days on market $169,000 Active 23 DOM
-
2026-05-31days on market $169,000 Active 22 DOM
-
2026-05-09$175,000 Active 744-char remark
-
2026-03-26historical
-
2026-03-24historical $1,395
-
2026-03-05$1,395
-
2026-03-04historical $1,395
-
2026-03-03$180,000 Active
-
2026-03-03historical
-
2026-01-29price $1,395
-
2026-01-28price $180,000
-
2026-01-14$1,400
-
2026-01-13historical $1,400
-
2026-01-06$165,000 Active
-
2025-12-04$1,400
-
2025-11-27historical $1,400
-
2025-11-14$1,400
-
2025-11-13historical $1,400
-
2025-11-13$1,400
-
2024-10-16historical $1,400
-
2024-10-09$1,400
-
2024-10-08historical $1,450
-
2024-09-24$1,450
-
2024-09-23historical $1,499
-
2024-09-12$1,499
-
2024-09-12historical $1,550
-
2024-08-08$1,550
-
2023-11-13historical $1,300
-
2023-11-07$1,300
-
2019-11-18soldstatus
-
2019-06-18soldstatus
-
2019-06-12soldstatus Sold
-
2019-05-25status Pending
-
2019-05-02$63,500 Active
-
2016-02-02soldstatus
-
2014-07-07soldstatus
ⓘ Source: listings_history table (triggers on properties + properties_extension) + one-shot
backfill from property_details.listing_events for pre-trigger history.
Tax reassessment forecast TX · Resets to sale price
- Current annual tax
- $3,593 · $299/mo
- Projected year-2 tax
- $3,593 · $299/mo
- Expected delta
- $0/yr ($0/mo · 0.0%)
ⓘ Screening estimate from a state-policy table — verify with the county assessor before closing.
Climate risk First Street
- Flood 6/10 Major FEMA zone X (unshaded) · 73% chance over 30 yrs
- Wildfire 2/10 Low
- Heat 9/10 Extreme 7 d/yr ≥109°F today · 22 d/yr by 30 yrs out
- Wind 9/10 Extreme 99% chance of damaging wind over 30 yrs
- Air quality 2/10 Low 2 unhealthy d/yr today · 2 by 30 yrs out
Nearby sold comps map
Loading sold comps map…
Walkable amenities ~0.75 mi
Loading nearby amenities…
Taxation est. · year 1
- Rental income
- $18,557
- − Mortgage interest
- −$9,467
- − Property taxes
- −$3,593
- − Insurance
- −$845
- − Repairs & maintenance
- −$1,485
- − Management
- −$1,485
- − Depreciation
- −$4,916
- Taxable loss
- −$3,234
- Est. tax savings @ 24.0%
- +$776
- After-tax cash flow
- $363/yr
For passive investors: Depreciation is non-cash, so a rental often shows a tax loss while cash-flowing — sheltering income. Rental losses are passive: they offset passive income freely, and up to $25,000/yr can offset ordinary (W-2) income if you actively participate and your MAGI is under $100k (phasing out to $0 by $150k); unused losses carry forward. On sale, claimed depreciation is recaptured at up to 25%, and gains may owe capital-gains tax (a 1031 exchange can defer both). Figures are a year-1 estimate at your 24.0% rate — not tax advice; consult a CPA.
Schools (NCES district)
- District
- Houston ISD
- NCES district ID
- 4823640
- Math proficiency
- 27% ▼ -18.00%
- Reading proficiency
- 35% ▼ -6.00%
- Median HH income
- $46,054
- Composite
- 26.63/100
- National rank
- #7173
- State rank
- #593 of 826 in TX
Livability — Houston
- Score
- 74/100
- State rank
- #184
- US rank
- #4771
Category grades
Schools grade is shown separately in the Schools card above.
Census & demographics
- Census place
- Houston, TX
- County
- Harris County · 4,702,590 people
- City population
- 3,226,434
- Metro
- Houston-The Woodlands-Sugar Land, TX
- Population (ZIP)
- 19,795
- Household income
- $37,415
- Rent vs Own
- Severe rent burden
- 1446.0
Population outlook (Harris County) Hauer SSP2
- Today (2025)
- 5,571,493 people
- By 2030
- 6,089,821 · +9.3%
- By 2040
- 7,142,806 · +28.2%
- By 2050
- 8,185,864 · +46.9%
- By 2075
- 10,574,329 · +89.8%
- By 2100
- 12,109,958 · +117.4%
Race, ethnicity, and origin ACS 2023
- Neighborhood character
- Predominantly Black (77%)
- Race & ethnicity
- Black 77% Hispanic / Latino 16% Two or more races 11% White 3%
- Hispanic origin (detail)
- Mexican 6% Puerto Rican 1%
- Foreign-born
- 8% · Canada, China
- Languages at home
- 88% English-only · Spanish 10%
Political lean MEDSL · Harris
- 2024 margin
- Lean D (+5.5) · D 52.0% · R 46.4% · Other 1.6%
- 2008→2024 swing
- +3.9pp toward D · 2008: 1.6pp · 2024: 5.5pp
- All cycles
- 2024: D+5.5 2020: D+13.3 2016: D+12.4 2012: D+0.1 2008: D+1.6
Not yet ingested
- Civics
- —
Market trends
- HPI YoY
- ▲ 16.02%
- Current HPI
- 180.4283
- Rent YoY
- ▲ 4.77%
- Metro
- Houston-The Woodlands-Sugar Land, TX
- State GDP YoY
- ▲ 3.95%
- F500 in state
- 110
Industry mix (Fortune 500 HQ in TX)
| Industry | F500 HQs | Revenue |
|---|---|---|
| Energy | 16 | $1,198B |
|
||
| Technology | 5 | $198B |
|
||
| Engineering / Construction | 4 | $72B |
|
||
| Energy Services | 3 | $60B |
|
||
| Utilities | 3 | $41B |
|
||
| Healthcare | 2 | $330B |
|
||
Price history
+166.1% since first listed35 events — show timeline
- 2026-05-21 Price Changed $169,000 HARMLS
- 2026-05-09 Listed $175,000 HARMLS
- 2026-03-26 Listing Removed — HARMLS
- 2026-03-24 Rental Removed $1,395 HARMLS
- 2026-03-05 Listed for Rent $1,395 HARMLS
- 2026-03-04 Rental Removed $1,395 HARMLS
- 2026-03-03 Listing Removed — HARMLS
- 2026-03-03 Listed $180,000 HARMLS
- 2026-01-29 Price Changed $1,395 HARMLS
- 2026-01-28 Price Changed $180,000 HARMLS
- 2026-01-14 Listed for Rent $1,400 HARMLS
- 2026-01-13 Rental Removed $1,400 HARMLS
- 2026-01-06 Listed $165,000 HARMLS
- 2025-12-04 Listed for Rent $1,400 HARMLS
- 2025-11-27 Rental Removed $1,400 HARMLS
- 2025-11-14 Listed for Rent $1,400 HARMLS
- 2025-11-13 Rental Removed $1,400 APPFOLIO
- 2025-11-13 Listed for Rent $1,400 APPFOLIO
- 2024-10-16 Rental Removed $1,400 HARMLS
- 2024-10-09 Listed for Rent $1,400 HARMLS
- 2024-10-08 Rental Removed $1,450 HARMLS
- 2024-09-24 Listed for Rent $1,450 HARMLS
- 2024-09-23 Rental Removed $1,499 HARMLS
- 2024-09-12 Listed for Rent $1,499 HARMLS
- 2024-09-12 Rental Removed $1,550 HARMLS
- 2024-08-08 Listed for Rent $1,550 HARMLS
- 2023-11-13 Rental Removed $1,300 HARMLS
- 2023-11-07 Listed for Rent $1,300 HARMLS
- 2019-11-18 Sold (Public Records) — Public Records
- 2019-06-18 Sold (Public Records) — Public Records
- 2019-06-12 Sold (MLS) — HARMLS
- 2019-05-25 Pending — HARMLS
- 2019-05-02 Listed $63,500 HARMLS
- 2016-02-02 Sold (Public Records) — Public Records
- 2014-07-07 Sold (Public Records) — Public Records
Property tax history
+12.4%/yrLatest (2025): $3,593 · +1.6% YoY. Source: county tax records.
Cash-flow waterfall
monthlySold comps — $/sqft
last 12 mo · ≤1 miLoading sold comps…