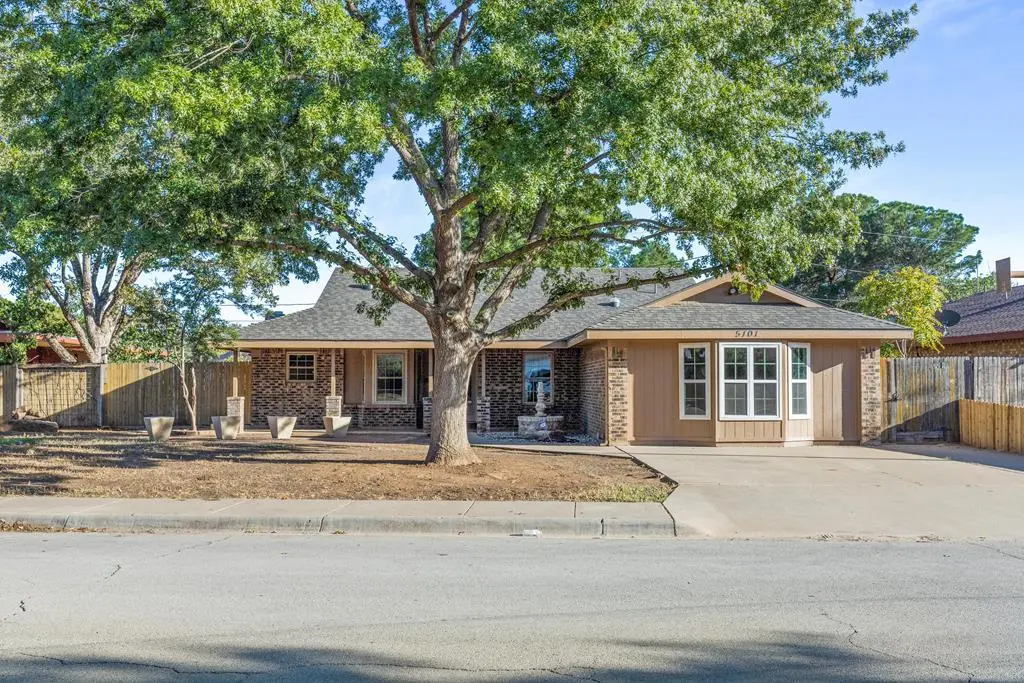
5101 Brazos St · Midland, TX
Flood risk 2/10 · Minimal
- FEMA flood zone
- X
- Chance of flooding over 30 yrs
- 0.06%
- Est. flood insurance / yr
- $507 – $1,088
Fire risk 7/10 · Major
- Est. fire insurance / yr
- $1,222 – $2,270
Heat risk 6/10 · Moderate
- Hot days now (above 101°F)
- 7 days/yr
- Hot days in 30 yrs
- 22 days/yr
Wind risk 2/10 · Minimal
- Chance of severe wind over 30 yrs
- 3.0%
Air-quality risk 1/10 · Minimal
- Unhealthy air days now
- 0 days/yr
- Unhealthy air days in 30 yrs
- 0 days/yr
Risk factors via First Street. Map © Google.
Why this score? — see what drove the F grade
The composite is a weighted blend of 9 inputs, each scored 0–100. Each bar is that input's sub-score; the figure is the points it added to the 100-point composite (weight × sub-score).
- ARV discount +7.1/15.0
- Cash flow +6.8/30.0
- Livability +4.0/5.0
- Rent growth +3.6/5.0
- Schools +3.2/10.0
- Condition / age +2.5/5.0
- 1% rule +1.3/10.0
- DSCR +1.0/10.0
- Appreciation +0.0/10.0
$315,000
🖨 Deal sheet 📄 Offer letter ✓ Due diligence
Listing remarks MLS
Large open spaces with tons of light and great style! 3 bedrooms, 2 baths and 2 living areas! Chef's kitchen with commercial grade range. Large hall bath with huge walk-in shower and great tile! Open concept primary suite features good closet, great tub and updated vanity area! Converted garage would be great game room, homeschool room, or easily converted back! Nice covered patio, privacy fence, outdoor kitchen area plus about a 300sf studio with mini-split! Come see it today!
Key facts
- 8,407 sq ft lot
- Built 1985
- Listed 84 days
Neighborhood map
What this means for you Summary
Snapshot
- This is a 3-bed/2.0-bath single-family listed at $315k.
Deal economics
- At list price, monthly cash flow is $-488 ($-6k/yr) — negative.
- To cash-flow at today's rent, offer at most $229k (27.4% below list).
- To meet the 1% rule (rent ≥ 1% of price), the offer needs to be $199k (36.7% below list).
- Recommended offer: $199k (36.7% below list) — sets the bar for 1% rule.
Location & tenants
- Location reads 79/100 on livability (#57 in TX, #2,192 nationally) — a middle-class / working-renter tenant base. Strengths: employment A+, housing A+, health & safety A+; Watch: schools C-, crime C-, commute D+.
- Midland ISD (urban): math 34% / reading 36% proficiency, ranked #477 of 826 in TX (top 58%) — families likely to look elsewhere, expect single-tenant / working-renter base with shorter leases.
- Market conditions: Rents rising fast (+4.5%/yr); 314 active listings in the ZIP; 20 comparable units currently listed for rent nearby; rentals leasing fast (median 14d on market — plan ~1-2 weeks tenant-placement turnaround); solid renter incomes; 1,504 units permitted in Midland County in 2024 (0 in 5+ unit buildings).
Forward outlook
- Local home prices are declining (-3.0%/yr); year-one equity from $2k of loan paydown is wiped out by about $9k of value loss. Plan a longer hold.
- Midland County population projected at +83% by 2050 — long-run rental-demand tailwind backs the buy-and-hold thesis.
Negotiation context
- It's been on market 85 days — a 6% lower offer ($296k) is reasonable based on typical stale-listing flexibility.
Risks & watch-outs
- Climate carrying-cost: major wildfire risk; extreme-heat days projected 7→22/yr by 2055 (HVAC capex compounding) — expect insurance premiums to compound above CPI over the hold.
Questions for the listing agent
- What do current leases actually rent for vs. the listed asking? Can we see a recent rent roll and the last 12 months of T-12 income?
- It's been on market 85 days. Have you received any prior offers? Is the seller open to a 37% concession, seller financing, or rate buy-down credit?
- Why hasn't it sold? Are there any deal-killer items the seller is aware of (foundation, flood, title, zoning, code violations)?
- Is there a deadline driving the sale (1031 exchange, divorce, estate, relocation)? That informs how much negotiation room exists.
- The area grade is low — what's the realistic commute time and amenity access for the typical tenant pool here? Any planned neighborhood developments (good or bad) we should know about?
- What's the average days-on-market for RENTAL listings here right now (not sales)? A rising rental-DOM trend means longer vacancies and softer asking-rent achievability than the comps imply.
- What's the recent tenant-quality profile in this submarket — average credit score on applications, eviction rate, late-payment / NSF rate, and stable-employment percentage? A property-management company in the area should have these aggregated.
- How much new for-sale + rental construction is in the pipeline within 1–3 miles? Heavy new supply typically softens prices + rents 12–24 months out; constrained supply supports both.
Investment metrics
- 1% rule
- 0.63% ✗
- Cap rate
- 4.43%
- Cash-on-cash
- -6.64%
- DSCR
- 0.70
- GRM
- 13.2
CMA / ARV
- ARV (median comp)
- $312,058
- List price
- $315,000
- Delta
- 0.94%
- Verdict
- FAIR
- Comps
- 6 within 2.0 mi
Projected returns pro-forma
-3.0% appreciation · 4.45% rent growth · sell at horizon
- IRR
- -26.3%
- Equity multiple
- 0.10×
- Total profit
- $-79,230
- Equity at exit
- $46,968
- IRR
- -19.5%
- Equity multiple
- -0.10×
- Total profit
- $-96,728
- Equity at exit
- $27,235
Cash invested: $88,200 (down + closing). Projections, not guarantees.
Landlord ↔ Tenant lean methodology
- Overall (STATE)
- 87 Strongly Landlord-Friendly
- State Texas
- 87 Strongly Landlord-Friendly · R+5
- County
- — inherits STATE
- City
- — inherits STATE
ZIP-level market 79707
- Rents YoY
- 4.5%
- Active inventory
- 314
- Price-to-rent
- 13.2×
Monthly cashflow live
- Estimated rent
- $1,993 high interval (Pro) →
- Mortgage (P&I)
- −$1,652
- Tax from tax record
- −$280 /mo · $3,358/yr
- Insurance
- −$131
- HOA
- −$0
- Vacancy / Maint / Mgmt
- −$419
- Net cashflow
- $-488
Break-even live
UW: 25.0% down · 7.5% · 30yr · 1.5% tax · 5.0% vac · 8.0% maint · 8.0% mgmt
Financing live
Cash to close
- Down payment
- $78,750
- Closing costs
- $9,450
- Reserves months
- —
- Total cash needed
- —
Loan-product check · same deal, 3 products live
Conventional
25% down · 7.5% · 30yr
- Down + closing
- —
- Monthly P&I
- —
- Monthly cashflow
- —
- DSCR
- —
- Eligible?
- —
Personal DTI + credit; lowest rate.
DSCR
20% down · 8.5% · 30yr
- Down + closing
- —
- Monthly P&I
- —
- Monthly cashflow
- —
- DSCR
- —
- Eligible?
- —
No personal income docs; deal must DSCR.
Hard money
10% down · 12.0% · 12mo
- Down + closing
- —
- Monthly P&I
- —
- Monthly cashflow
- —
- DSCR
- —
- Eligible?
- —
Short-term bridge; refi at stabilization.
Rent comps 20 comps
| Address | Beds | Baths | Sqft | Rent | $/sqft | DOM | Units | Dist |
|---|---|---|---|---|---|---|---|---|
| 4805 Briarwood Ave Midland, TX | 1.0–3.0 | 1.0–2.0 | 1028 | $2,285 | $2.22 | 13d | 18 | 0.31mi |
| 5244 West Loop 250 N Midland, TX | 1.0–2.0 | 1.0–2.0 | 791 | $1,749 | $2.21 | 13d | 34 | 0.33mi |
| 5200 Briarwood Ave Midland, TX | 1.0–2.0 | 1.0–2.0 | 893 | $2,124 | $2.38 | 13d | 24 | 0.34mi |
| 4415 Northcrest Dr Midland, TX | 1.0–2.0 | 1.0–2.0 | 804 | $1,594 | $1.98 | 13d | 17 | 0.42mi |
| 3705 Dentcrest Dr Midland, TX | 3.0 | 2.0 | 1402 | $1,800 | $1.28 | 13d | 1 | 0.44mi |
| 5216 Tremont Ave Midland, TX | 1.0–2.0 | 1.0–2.0 | 771 | $1,411 | $1.83 | 13d | 19 | 0.57mi |
| 3417 N Midland Dr Midland, TX | 1.0–3.0 | 1.0–2.0 | 887 | $1,624 | $1.83 | 13d | 13 | 0.83mi |
| 4301 Raleigh Ct Midland, TX | 1.0–2.0 | 1.0–2.0 | 766 | $1,490 | $1.94 | 13d | 18 | 0.85mi |
| 4715 W Wadley Ave Midland, TX | 1.0–2.0 | 1.0–2.5 | 872 | $1,514 | $1.74 | 13d | 10 | 0.87mi |
| 4800 Dentcrest Dr Midland, TX | 2.0 | 2.0 | 1148 | $1,999 | $1.74 | 43d | 1 | 0.89mi |
| 4704 Dentcrest Dr Unit A Midland, TX | 2.0 | 2.0 | 1500 | $1,850 | $1.23 | 43d | 1 | 0.90mi |
| 5001 W Wadley Ave Midland, TX | 1.0–3.0 | 1.0–2.0 | 1098 | $2,720 | $2.48 | 13d | 17 | 0.90mi |
| 3600 N Midland Dr Midland, TX | 1.0–2.0 | 1.0–2.0 | 900 | $1,425 | $1.58 | 13d | 9 | 0.91mi |
| 4713 Dentcrest Dr Unit A Midland, TX | 2.0 | 2.0 | 1400 | $3,250 | $2.32 | 21d | 1 | 0.92mi |
| 3101 Midland Dr Midland, TX | 1.0–2.0 | 1.0–2.0 | 765 | $1,285 | $1.68 | 43d | 1 | 1.12mi |
| 6000 Briarwood Ave Midland, TX | 1.0–3.0 | 1.0–2.0 | 996 | $2,856 | $2.87 | 13d | 28 | 1.12mi |
| 5108 Rainbow Rd Unit A Midland, TX | 3.0 | 2.0 | 1406 | $3,250 | $2.31 | 43d | 1 | 1.16mi |
| 4700 Boulder Dr Midland, TX | 1.0–2.0 | 1.0–2.0 | 823 | $1,500 | $1.82 | 21d | 2 | 1.24mi |
| 3315 Godfrey St Midland, TX | 1.0–3.0 | 1.5–4.0 | 1764 | $2,800 | $1.59 | 13d | 8 | 1.34mi |
| 3609 Caldera Blvd Midland, TX | 1.0–2.0 | 1.0–2.0 | 850 | $1,599 | $1.88 | 13d | 67 | 1.41mi |
Listing history 21 events
-
2026-06-19days on market $315,000 Active 85 DOM
-
2026-06-18days on market $315,000 Active 84 DOM
-
2026-06-17days on market $315,000 Active 83 DOM
-
2026-06-16days on market $315,000 Active 82 DOM
-
2026-06-15days on market $315,000 Active 81 DOM
-
2026-06-14days on market $315,000 Active 79 DOM
-
2026-06-13days on market $315,000 Active 78 DOM
-
2026-06-10days on market $315,000 Active 76 DOM
-
2026-06-09days on market $315,000 Active 75 DOM
-
2026-06-08days on market $315,000 Active 74 DOM
-
2026-06-07days on market $315,000 Active 73 DOM
-
2026-06-03days on market $315,000 Active 69 DOM
-
2026-06-02days on market $315,000 Active 68 DOM
-
2026-06-01days on market $315,000 Active 67 DOM
-
2026-05-31days on market $315,000 Active 66 DOM
-
2026-05-30days on market $315,000 Active 65 DOM
-
2026-04-30price $315,000 482-char remark
Show marketing remark (482 chars)
Large open spaces with tons of light and great style! 3 bedrooms, 2 baths and 2 living areas! Chef's kitchen with commercial grade range. Large hall bath with huge walk-in shower and great tile! Open concept primary suite features good closet, great tub and updated vanity area! Converted garage would be great game room, homeschool room, or easily converted back! Nice covered patio, privacy fence, outdoor kitchen area plus about a 300sf studio with mini-split! Come see it today!
-
2026-03-26$325,000 Active 482-char remark
Show marketing remark (482 chars)
Large open spaces with tons of light and great style! 3 bedrooms, 2 baths and 2 living areas! Chef's kitchen with commercial grade range. Large hall bath with huge walk-in shower and great tile! Open concept primary suite features good closet, great tub and updated vanity area! Converted garage would be great game room, homeschool room, or easily converted back! Nice covered patio, privacy fence, outdoor kitchen area plus about a 300sf studio with mini-split! Come see it today!
-
2012-06-01soldstatus
-
2010-02-26soldstatus
-
1992-06-04soldstatus
ⓘ Source: listings_history table (triggers on properties + properties_extension) + one-shot
backfill from property_details.listing_events for pre-trigger history.
Tax reassessment forecast TX · Resets to sale price
- Current annual tax
- $3,358 · $280/mo
- Projected year-2 tax
- $5,764 · $480/mo
- Expected delta
- +$2,407/yr (+$201/mo · 71.7%)
ⓘ Screening estimate from a state-policy table — verify with the county assessor before closing.
Climate risk First Street
- Flood 2/10 Low FEMA zone X · 6% chance over 30 yrs
- Wildfire 7/10 Severe
- Heat 6/10 Major 7 d/yr ≥101°F today · 22 d/yr by 30 yrs out
- Wind 2/10 Low 3% chance of damaging wind over 30 yrs
- Air quality 1/10 Low 0 unhealthy d/yr today · 0 by 30 yrs out
Nearby sold comps map
Loading sold comps map…
Walkable amenities ~0.75 mi
Loading nearby amenities…
Taxation est. · year 1
- Rental income
- $23,920
- − Mortgage interest
- −$17,645
- − Property taxes
- −$3,358
- − Insurance
- −$1,575
- − Repairs & maintenance
- −$1,914
- − Management
- −$1,914
- − Depreciation
- −$9,164
- Taxable loss
- −$11,649
- Est. tax savings @ 24.0%
- +$2,796
- After-tax cash flow
- $-3,063/yr
For passive investors: Depreciation is non-cash, so a rental often shows a tax loss while cash-flowing — sheltering income. Rental losses are passive: they offset passive income freely, and up to $25,000/yr can offset ordinary (W-2) income if you actively participate and your MAGI is under $100k (phasing out to $0 by $150k); unused losses carry forward. On sale, claimed depreciation is recaptured at up to 25%, and gains may owe capital-gains tax (a 1031 exchange can defer both). Figures are a year-1 estimate at your 24.0% rate — not tax advice; consult a CPA.
Schools (NCES district)
- District
- Midland ISD
- NCES district ID
- 4830570
- Math proficiency
- 34% ▼ -7.00%
- Reading proficiency
- 36% ▬ 0.00%
- Median HH income
- $63,457
- Composite
- 31.63/100
- National rank
- #5938
- State rank
- #477 of 826 in TX
Livability — Midland
- Score
- 79/100
- State rank
- #57
- US rank
- #2192
Category grades
Schools grade is shown separately in the Schools card above.
Census & demographics
- Census place
- Midland, TX
- County
- Midland County · 168,494 people
- City population
- 168,494
- Metro
- Midland, TX
- Population (ZIP)
- 40,010
- Household income
- $99,886
- Rent vs Own
- Severe rent burden
- 1919.0
Population outlook (Midland County) Hauer SSP2
- Today (2025)
- 220,895 people
- By 2030
- 253,667 · +14.8%
- By 2040
- 325,498 · +47.4%
- By 2050
- 404,168 · +83.0%
- By 2075
- 609,802 · +176.1%
- By 2100
- 760,172 · +244.1%
Race, ethnicity, and origin ACS 2023
- Neighborhood character
- Diverse neighborhood (Simpson 0.58)
- Race & ethnicity
- White 56% Hispanic / Latino 31% Two or more races 11% Asian 5% Black 4%
- Hispanic origin (detail)
- Mexican 26% Cuban 1%
- Common ancestry
- Slovak 3% Lithuanian 2% Italian 1%
- Foreign-born
- 11% · Canada, China, Philippines
- Languages at home
- 79% English-only · Spanish 14% Other Asian/Pacific 2% Other Indo-European 1%
Political lean MEDSL · Midland
- 2024 margin
- Solid R (+60.5) · D 19.3% · R 79.8%
- 2008→2024 swing
- -3.3pp toward R · 2008: -57.3pp · 2024: -60.5pp
- All cycles
- 2024: R+60.5 2020: R+56.6 2016: R+55.2 2012: R+61.5 2008: R+57.3
Not yet ingested
- Civics
- —
Market trends
- HPI YoY
- ▼ -208.65%
- Current HPI
- 198.7489
- Rent YoY
- ▲ 4.45%
- Metro
- Midland, TX
- State GDP YoY
- ▲ 3.95%
- F500 in state
- 110
Industry mix (Fortune 500 HQ in TX)
| Industry | F500 HQs | Revenue |
|---|---|---|
| Energy | 16 | $1,198B |
|
||
| Technology | 5 | $198B |
|
||
| Engineering / Construction | 4 | $72B |
|
||
| Energy Services | 3 | $60B |
|
||
| Utilities | 3 | $41B |
|
||
| Healthcare | 2 | $330B |
|
||
Price history
-3.1% since first listed5 events — show timeline
- 2026-04-30 Price Changed $315,000 PBBOR
- 2026-03-26 Listed $325,000 PBBOR
- 2012-06-01 Sold (Public Records) — Public Records
- 2010-02-26 Sold (Public Records) — Public Records
- 1992-06-04 Sold (Public Records) — Public Records
Property tax history
-0.2%/yrLatest (2025): $3,358 · -1.9% YoY. Source: county tax records.
Cash-flow waterfall
monthlySold comps — $/sqft
last 12 mo · ≤1 miLoading sold comps…