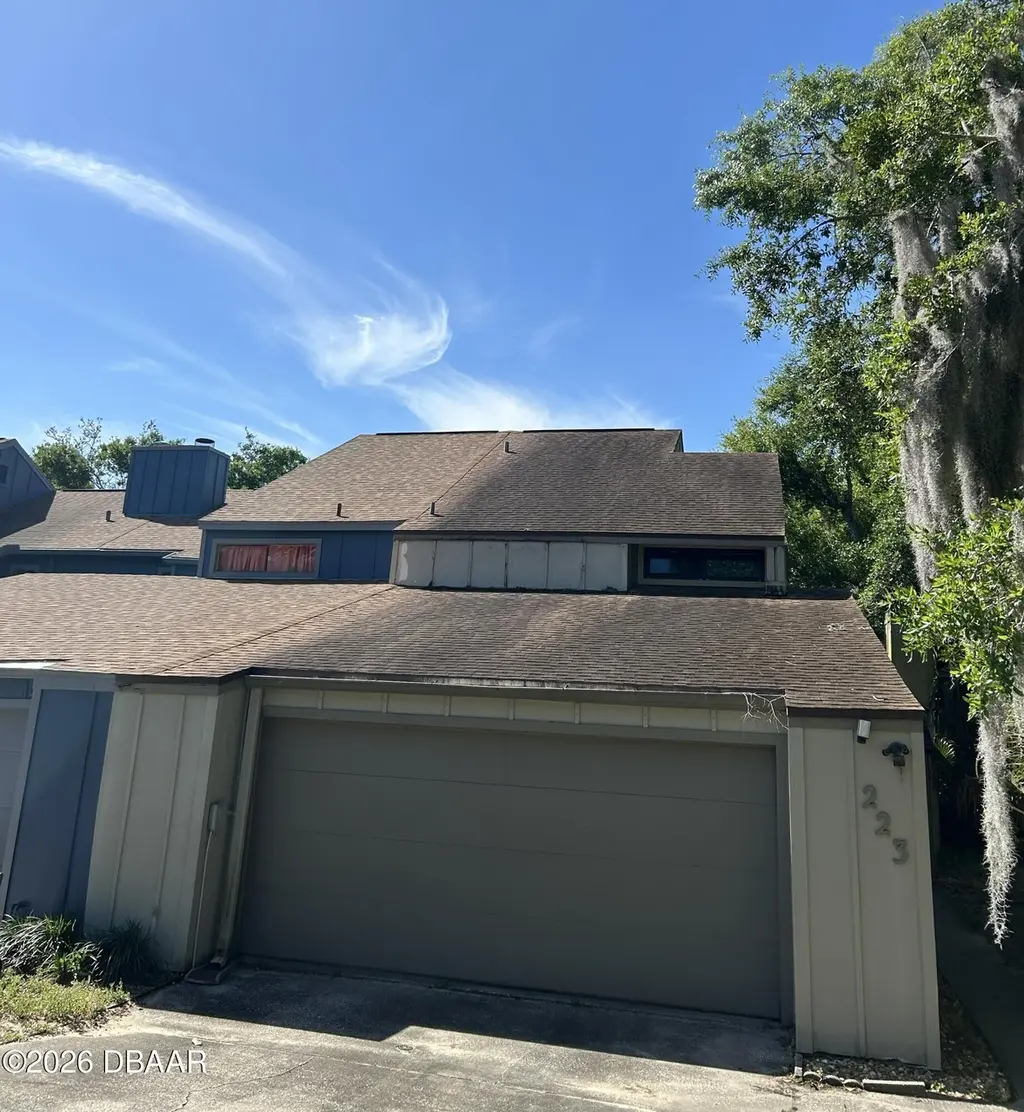
223 Pine Cone Trl · Ormond Beach, FL
Flood risk 1/10 · Minimal
- FEMA flood zone
- X (unshaded)
- Chance of flooding over 30 yrs
- 0.0%
- Est. flood insurance / yr
- $507 – $1,088
Fire risk 4/10 · Minor
- Est. fire insurance / yr
- $947 – $1,759
Heat risk 9/10 · Severe
- Hot days now (above 105°F)
- 7 days/yr
- Hot days in 30 yrs
- 20 days/yr
Wind risk 10/10 · Severe
- Chance of severe wind over 30 yrs
- 99.0%
Air-quality risk 3/10 · Minor
- Unhealthy air days now
- 3 days/yr
- Unhealthy air days in 30 yrs
- 3 days/yr
Risk factors via First Street. Map © Google.
Why this score? — see what drove the D+ grade
The composite is a weighted blend of 9 inputs, each scored 0–100. Each bar is that input's sub-score; the figure is the points it added to the 100-point composite (weight × sub-score).
- Cash flow +17.3/30.0
- ARV discount +7.5/15.0
- 1% rule +5.8/10.0
- DSCR +5.4/10.0
- Livability +4.2/5.0
- Schools +3.9/10.0
- Rent growth +2.9/5.0
- Condition / age +2.5/5.0
- Appreciation +0.0/10.0
$205,000
🖨 Deal sheet 📄 Offer letter ✓ Due diligence
Listing remarks MLS
Short Sale, In Foreclosure Welcome to The Trails, where modern convenience meets cozy charm in a tranquil setting. The living room boasts vaulted ceilings, a stunning coquina stone wood-burning fireplace The ground floor also features a dining area, 3rd bedroom, 1/2 bath, kitchen, laundry room, and a 2-car garage. Sliding doors off both the kitchen and living room lead to a secluded fenced patio to bbq on. Upstairs, you'll find two generously sized bedrooms, each with its own en suite bathroom, along with ample closet space throughout the home. Community amenities include an pool, clubhouse, tennis and pickleball courts, racquetball, and scenic walking/biking trails with nearby parks. Conveniently located close to shopping, top-rated schools, and major highways, this home combines lifestyle, location, and opportunity.
Key facts
- Community amenities
- Top-rated schools
- $183 HOA
Tags
Neighborhood map
What this means for you Summary
Snapshot
- This is a 3-bed/3.0-bath single-family listed at $205k.
Deal economics
- At list price, monthly cash flow is $150 ($2k/yr) — positive.
- The deal already cash-flows at list — no discount required.
- Meets the 1% rule at list price ($2k rent vs $205k).
- Recommended offer: $199k (3.0% below list) — sets the bar for market timing.
- Cap rate 7.2% vs local median 3.9% in Ormond Beach — top-decile yield for the area; either an underpriced asset or a hidden risk that comps aren't pricing in. Stress-test before assuming the spread holds.
Location & tenants
- Location reads 83/100 on livability (#55 in FL, #965 nationally) — a professional / high-income tenant draw. Strengths: amenities A+, housing A+, health & safety A+; Watch: commute F.
- Volusia (suburban): math 44% / reading 49% proficiency, ranked #47 of 73 in FL (top 64%) — families likely to look elsewhere, expect single-tenant / working-renter base with shorter leases.
- Market conditions: Rents rising (+1.6%/yr); 985 active listings in the ZIP; 11 comparable units currently listed for rent nearby; rentals at typical pace (median 19d on market — plan ~3-4 weeks tenant-placement turnaround); 3,402 units permitted in Volusia County in 2024 (681 in 5+ unit buildings).
- This rent runs 38% of the median local income ($71k/yr) — at the standard rent-burdened threshold; future hikes will face affordability resistance.
Forward outlook
- Local home prices are declining (-3.0%/yr); year-one equity from $1k of loan paydown is wiped out by about $6k of value loss. Plan a longer hold.
- Volusia County population projected at +19% by 2050 — long-run rental-demand tailwind backs the buy-and-hold thesis.
Negotiation context
- It's been on market 60 days — a 3% lower offer ($199k) is reasonable based on typical stale-listing flexibility.
- 5 sale attempts since 11y ago; this cycle's ask has dropped $25k (11%) from the opening price — seller is motivated, your offer sets the floor, not the list.
- Current owner paid $150k; 37% above their basis — modest negotiation headroom, anchor on the comps not their cost.
Risks & watch-outs
- Climate carrying-cost: severe wind risk, 99% chance of damaging wind over 30y; extreme-heat days projected 7→20/yr by 2055 (HVAC capex compounding) — expect insurance premiums to compound above CPI over the hold.
Questions for the listing agent
- It's been on market 60 days. Have you received any prior offers? Is the seller open to a 3% concession, seller financing, or rate buy-down credit?
- Built in 1978 — when were the roof, HVAC, electrical panel, plumbing, and water heater last replaced?
- What does the HOA fee cover, when was the last increase, and are there any pending special assessments or reserve-fund shortfalls?
- Is there a deadline driving the sale (1031 exchange, divorce, estate, relocation)? That informs how much negotiation room exists.
- Schools are B-rated — typically a magnet for longer-tenancy family renters. What's the average tenant stay here, and is there a school-zone premium baked into asking?
- The area grade is low — what's the realistic commute time and amenity access for the typical tenant pool here? Any planned neighborhood developments (good or bad) we should know about?
- What's the average days-on-market for RENTAL listings here right now (not sales)? A rising rental-DOM trend means longer vacancies and softer asking-rent achievability than the comps imply.
- What's the recent tenant-quality profile in this submarket — average credit score on applications, eviction rate, late-payment / NSF rate, and stable-employment percentage? A property-management company in the area should have these aggregated.
- How much new for-sale + rental construction is in the pipeline within 1–3 miles? Heavy new supply typically softens prices + rents 12–24 months out; constrained supply supports both.
Investment metrics
- 1% rule
- 1.08% ✓
- Cap rate
- 7.17%
- Cash-on-cash
- 3.14%
- DSCR
- 1.14
- GRM
- 7.7
CMA / ARV
No comps found within radius.
Projected returns pro-forma
-3.0% appreciation · 1.64% rent growth · sell at horizon
- IRR
- -13.0%
- Equity multiple
- 0.54×
- Total profit
- $-26,496
- Equity at exit
- $30,566
- IRR
- -6.4%
- Equity multiple
- 0.61×
- Total profit
- $-22,109
- Equity at exit
- $17,725
Cash invested: $57,400 (down + closing). Projections, not guarantees.
Landlord ↔ Tenant lean methodology
- Overall (STATE)
- 87 Strongly Landlord-Friendly
- State Florida
- 87 Strongly Landlord-Friendly · R+3
- County
- — inherits STATE
- City
- — inherits STATE
ZIP-level market 32174
- Rents YoY
- 1.6%
- Active inventory
- 985
- Price-to-rent
- 7.7×
Monthly cashflow live
- Estimated rent
- $2,219 high interval (Pro) →
- Mortgage (P&I)
- −$1,075
- Tax from tax record
- −$259 /mo · $3,113/yr
- Insurance
- −$85
- HOA
- −$183
- Vacancy / Maint / Mgmt
- −$466
- Net cashflow
- $150
Break-even live
UW: 25.0% down · 7.5% · 30yr · 1.5% tax · 5.0% vac · 8.0% maint · 8.0% mgmt
Financing live
Cash to close
- Down payment
- $51,250
- Closing costs
- $6,150
- Reserves months
- —
- Total cash needed
- —
Loan-product check · same deal, 3 products live
Conventional
25% down · 7.5% · 30yr
- Down + closing
- —
- Monthly P&I
- —
- Monthly cashflow
- —
- DSCR
- —
- Eligible?
- —
Personal DTI + credit; lowest rate.
DSCR
20% down · 8.5% · 30yr
- Down + closing
- —
- Monthly P&I
- —
- Monthly cashflow
- —
- DSCR
- —
- Eligible?
- —
No personal income docs; deal must DSCR.
Hard money
10% down · 12.0% · 12mo
- Down + closing
- —
- Monthly P&I
- —
- Monthly cashflow
- —
- DSCR
- —
- Eligible?
- —
Short-term bridge; refi at stabilization.
Rent comps 11 comps
| Address | Beds | Baths | Sqft | Rent | $/sqft | DOM | Units | Dist |
|---|---|---|---|---|---|---|---|---|
| 162 Pine Cone Trl Ormond Beach, FL | 3.0 | 2.0 | 1555 | $2,100 | $1.35 | 14d | 1 | 0.10mi |
| 25 Cherokee Trl Ormond Beach, FL | 3.0 | 3.0 | 2056 | $2,600 | $1.26 | 14d | 1 | 0.31mi |
| 7 Stone Haven Trl Ormond Beach, FL | 3.0 | 2.0 | 1678 | $2,200 | $1.31 | 19d | 1 | 0.45mi |
| 35 Magnolia Ave Unit 35 Ormond Beach, FL | 2.0 | 2.0 | 1300 | $1,800 | $1.38 | 23d | 1 | 0.54mi |
| 51 Brookwood Dr Ormond Beach, FL | 3.0 | 2.0 | 1791 | $2,100 | $1.17 | 23d | 1 | 0.59mi |
| 67 Brookwood Dr Ormond Beach, FL | 3.0 | 2.0 | 1602 | $2,500 | $1.56 | 23d | 1 | 0.64mi |
| 1088 W Granada Blvd Ormond Beach, FL | 1.0–2.0 | 1.0–2.0 | 950 | $1,570 | $1.65 | 11d | 8 | 0.69mi |
| 3 Glen Arbor Park Ormond Beach, FL | 2.0 | 1.5 | 1200 | $1,700 | $1.42 | 23d | 1 | 0.72mi |
| 173 Nature Trl Ormond Beach, FL | 3.0 | 2.5 | 1888 | $2,350 | $1.24 | 14d | 1 | 0.83mi |
| 500 Shadow Lakes Blvd Ormond Beach, FL | 1.0–2.0 | 1.0–2.0 | 856 | $1,645 | $1.92 | 11d | 15 | 0.84mi |
| 36 Spring Meadows Dr Ormond Beach, FL | 3.0 | 2.0 | 2036 | $2,700 | $1.33 | 23d | 1 | 1.25mi |
HOA detail
- Monthly dues
- $183 · $2,196/yr
- Likely covers
- pool
Listing history 34 events
-
2026-06-18days on market $205,000 Active 60 DOM
-
2026-06-17days on market $205,000 Active 59 DOM
-
2026-06-16pricedays on market $205,000 Active 58 DOM
-
2026-06-15days on market $220,000 Active 57 DOM
-
2026-06-14days on market $220,000 Active 55 DOM
-
2026-06-10days on market $220,000 Active 52 DOM
-
2026-06-09days on market $220,000 Active 51 DOM
-
2026-06-08days on market $220,000 Active 50 DOM
-
2026-06-07days on market $220,000 Active 49 DOM
-
2026-06-05days on market $220,000 Active 46 DOM
-
2026-06-03days on market $220,000 Active 45 DOM
-
2026-06-03days on market $220,000 Active 44 DOM
-
2026-06-01days on market $220,000 Active 43 DOM
-
2026-05-31days on market $220,000 Active 42 DOM
-
2026-05-31days on market $220,000 Active 41 DOM
-
2026-04-17$230,000 Active 829-char remark
Show marketing remark (829 chars)
Short Sale, In Foreclosure Welcome to The Trails, where modern convenience meets cozy charm in a tranquil setting. The living room boasts vaulted ceilings, a stunning coquina stone wood-burning fireplace The ground floor also features a dining area, 3rd bedroom, 1/2 bath, kitchen, laundry room, and a 2-car garage. Sliding doors off both the kitchen and living room lead to a secluded fenced patio to bbq on. Upstairs, you'll find two generously sized bedrooms, each with its own en suite bathroom, along with ample closet space throughout the home. Community amenities include an pool, clubhouse, tennis and pickleball courts, racquetball, and scenic walking/biking trails with nearby parks. Conveniently located close to shopping, top-rated schools, and major highways, this home combines lifestyle, location, and opportunity.
-
2025-09-05status Active
-
2025-08-12status Pending
-
2025-08-12historical
-
2025-08-05$239,500 Active
-
2015-09-25soldstatus $150,000 Closed
-
2015-09-25soldstatus $150,000 Sold
-
2015-08-27status Pending
-
2015-08-22historical Contingent
-
2015-08-14price $150,000
-
2015-07-09price $156,900
-
2015-07-09price $156,900
-
2015-06-15$164,900 Active
-
2015-06-15price $164,900
-
2015-05-15$169,900 Active
-
2005-04-04soldstatus $111,000
-
1995-03-01soldstatus $52,000
-
1993-06-17soldstatus $74,857
-
1985-12-01soldstatus $66,900
ⓘ Source: listings_history table (triggers on properties + properties_extension) + one-shot
backfill from property_details.listing_events for pre-trigger history.
Tax reassessment forecast FL · Resets to sale price
- Current annual tax
- $3,113 · $259/mo
- Projected year-2 tax
- $3,113 · $259/mo
- Expected delta
- $0/yr ($0/mo · 0.0%)
ⓘ Screening estimate from a state-policy table — verify with the county assessor before closing.
Climate risk First Street
- Flood 1/10 Low FEMA zone X (unshaded) · 0% chance over 30 yrs
- Wildfire 4/10 Moderate
- Heat 9/10 Extreme 7 d/yr ≥105°F today · 20 d/yr by 30 yrs out
- Wind 10/10 Extreme 99% chance of damaging wind over 30 yrs
- Air quality 3/10 Moderate 3 unhealthy d/yr today · 3 by 30 yrs out
Nearby sold comps map
Loading sold comps map…
Walkable amenities ~0.75 mi
Loading nearby amenities…
Taxation est. · year 1
- Rental income
- $26,631
- − Mortgage interest
- −$11,483
- − Property taxes
- −$3,113
- − Insurance
- −$1,025
- − Repairs & maintenance
- −$2,130
- − Management
- −$2,130
- − HOA
- −$2,196
- − Depreciation
- −$5,964
- Taxable loss
- −$1,411
- Est. tax savings @ 24.0%
- +$339
- After-tax cash flow
- $2,142/yr
For passive investors: Depreciation is non-cash, so a rental often shows a tax loss while cash-flowing — sheltering income. Rental losses are passive: they offset passive income freely, and up to $25,000/yr can offset ordinary (W-2) income if you actively participate and your MAGI is under $100k (phasing out to $0 by $150k); unused losses carry forward. On sale, claimed depreciation is recaptured at up to 25%, and gains may owe capital-gains tax (a 1031 exchange can defer both). Figures are a year-1 estimate at your 24.0% rate — not tax advice; consult a CPA.
Schools (NCES district)
- District
- Volusia
- NCES district ID
- 1201920
- Math proficiency
- 44% ▼ -9.00%
- Reading proficiency
- 49% ▼ -3.00%
- Median HH income
- $42,946
- Composite
- 39.2/100
- National rank
- #4019
- State rank
- #47 of 73 in FL
Livability — Ormond Beach
- Score
- 83/100
- State rank
- #55
- US rank
- #965
Category grades
Schools grade is shown separately in the Schools card above.
Census & demographics
- Census place
- Ormond Beach, FL
- County
- Volusia County · 556,871 people
- City population
- 69,624
- Metro
- Deltona-Daytona Beach-Ormond Beach, FL
- Population (ZIP)
- 54,783
- Household income
- $71,011
- Rent vs Own
- Severe rent burden
- 1158.0
Population outlook (Volusia County) Hauer SSP2
- Today (2025)
- 572,749 people
- By 2030
- 598,695 · +4.5%
- By 2040
- 644,880 · +12.6%
- By 2050
- 681,451 · +19.0%
- By 2075
- 759,957 · +32.7%
- By 2100
- 778,902 · +36.0%
Race, ethnicity, and origin ACS 2023
- Neighborhood character
- Predominantly White (82%)
- Race & ethnicity
- White 82% Black 6% Hispanic / Latino 5% Two or more races 5% Asian 3%
- Hispanic origin (detail)
- Puerto Rican 2%
- Common ancestry
- Romanian 4% Lithuanian 3% Slovak 3%
- Foreign-born
- 7% · Canada, China
- Languages at home
- 91% English-only · Spanish 3% Other Indo-European 1% German/W. Germanic 1%
Political lean MEDSL · Volusia
- 2024 margin
- Strong R (+21.8) · D 38.7% · R 60.5%
- 2008→2024 swing
- -27.4pp toward R · 2008: 5.7pp · 2024: -21.8pp
- All cycles
- 2024: R+21.8 2020: R+14.1 2016: R+13.1 2012: R+1.2 2008: D+5.7
Not yet ingested
- Civics
- —
Market trends
- HPI YoY
- ▼ -327.97%
- Current HPI
- 271.92
- Rent YoY
- ▲ 1.64%
- Metro
- Deltona-Daytona Beach-Ormond Beach, FL
- State GDP YoY
- ▲ 3.28%
- F500 in state
- 36
Industry mix (Fortune 500 HQ in FL)
| Industry | F500 HQs | Revenue |
|---|---|---|
| Industrial Technology | 2 | $29B |
|
||
| Insurance | 2 | $17B |
|
||
| Retail | 1 | $60B |
|
||
| Technology Distribution | 1 | $58B |
|
||
| Homebuilding | 1 | $35B |
|
||
| Technology Manufacturing | 1 | $35B |
|
||
Price history
+243.8% since first listed19 events — show timeline
- 2026-04-17 Listed $230,000 Daytona MLS
- 2025-09-05 Relisted — Daytona MLS
- 2025-08-12 Pending — Daytona MLS
- 2025-08-12 Listing Removed — Daytona MLS
- 2025-08-05 Listed $239,500 Daytona MLS
- 2015-09-25 Sold (MLS) $150,000 Stellar MLS as Distributed by MLS Grid
- 2015-09-25 Sold (MLS) $150,000 Daytona MLS
- 2015-08-27 Pending — Stellar MLS as Distributed by MLS Grid
- 2015-08-22 Contingent — Daytona MLS
- 2015-08-14 Price Changed $150,000 Daytona MLS
- 2015-07-09 Price Changed $156,900 Stellar MLS as Distributed by MLS Grid
- 2015-07-09 Price Changed $156,900 Daytona MLS
- 2015-06-15 Listed $164,900 Stellar MLS as Distributed by MLS Grid
- 2015-06-15 Price Changed $164,900 Daytona MLS
- 2015-05-15 Listed $169,900 Daytona MLS
- 2005-04-04 Sold (Public Records) $111,000 Public Records
- 1995-03-01 Sold (Public Records) $52,000 Public Records
- 1993-06-17 Sold (Public Records) $74,857 Public Records
- 1985-12-01 Sold (Public Records) $66,900 Public Records
Property tax history
+3.8%/yrLatest (2025): $3,113 · +4.3% YoY. Source: county tax records.
Cash-flow waterfall
monthlySold comps — $/sqft
last 12 mo · ≤1 miLoading sold comps…